

GS Oil_watermark
.pdfvk.com/id446425943
13 November 2018 | 9:56PM EST
Oil
A negative gamma effect sets oil up to snap back
1. What began as a cross-asset risk-off sell-off accelerated last week for oil on news of the Iranian waivers and is now being further exacerbated by systematic trading and hedging strategies. While the macro demand concerns from October were likely overdone, the forward supply fundamental picture has substantially deteriorated with large upward revisions in US production and stronger than expected Libyan and Venezuelan output. Importantly, though, this has yet to materialize in sharply rising inventories and does not justify the magnitude of today’s sell off, especially if OPEC is now discussing a production cut as a result.
Exhibit 1: Oil prices have sold off sharply, with the last move lower occurring alongside a surge in volatility
WTI 6-mo forward (lhs, $/bbl) vs. 6-mo ATM implied volatility (rhs)
76 |
0.32 |
|
|
|
0.3 |
71 |
0.28 |
|
|
66 |
0.26 |
|
|
|
0.24 |
61 |
0.22 |
|
|
56 |
0.2 |
|
|
6m rolling forward |
|
6m ATM Vol |
|
|
|||
|
|
|
|
|
2. Driving the most recent leg of the oil sell-off has instead first been momentum trading strategies and second, increased selling of crude oil futures by swap dealers as they manage the risk incurred from existing producer hedging programs in a falling price environment. Taking out November 5th, this would be the 12th oil down day, similar to the move we saw in copper earlier this year with 17 consecutive down days, with both underscoring the rising importance of momentum trading strategies. Similar sharp oil downward moves have historically all been associated with large “negative gamma” effects, which we discuss below, such as in early 2007 (physical destocking like today) and mid 2012 (demand concerns and Iranian waivers like today). In both cases, oil prices collapsed, volatility levels surged and the market rebounded sharply once these negative gamma effects played out (see Exhibits 2 and 3).
Jeffrey Currie
+1(212)357-6801 | jeffrey.currie@gs.com Goldman Sachs & Co. LLC
Damien Courvalin
+1(212)902-3307 | damien.courvalin@gs.com Goldman Sachs & Co. LLC
Michael Hinds
+1(212)357-7528 | michael.hinds@gs.com Goldman Sachs & Co. LLC
Callum Bruce
+44(20)7774-6112 | callum.bruce@gs.com Goldman Sachs International
Investors should consider this report as only a single factor in making their investment decision. For Reg AC certification and other important disclosures, see the Disclosure Appendix, or go to www.gs.com/research/hedge.html

vk.com/id446425943 |
Oil |
Goldman Sachs |
Exhibit 2: We have seen similar “negative gamma” events in oil before, in both 2007 (physical destocking)...
WTI 6-mo forward (lhs, $/bbl) vs. 6-mo ATM implied volatility (rhs)
Exhibit 3: ... and in 2012 on demand concerns and Iran waivers, just like today
WTI 6-mo forward (lhs, $/bbl) vs. 6-mo ATM implied volatility (rhs)
80 |
Negative |
0.38 |
120 |
|
Gamma |
|
115 |
||
|
0.36 |
|||
75 |
effect |
110 |
||
|
||||
|
|
|||
|
|
0.34 |
||
70 |
|
105 |
||
|
|
|||
|
0.32 |
|
||
65 |
|
100 |
||
|
0.3 |
95 |
||
|
|
|||
60 |
|
0.28 |
90 |
|
|
|
85 |
||
55 |
|
0.26 |
||
|
80 |
|||
|
|
|
||
50 |
|
0.24 |
75 |
Negative |
0.4 |
|
Gamma |
0.38 |
|
effect |
||
0.36 |
||
|
||
|
0.34 |
|
|
0.32 |
|
|
0.3 |
|
|
0.28 |
|
|
0.26 |
|
|
0.24 |
|
|
6m rolling forward |
|
6m ATM Vol |
|
|
|
6m rolling forward |
|
6m ATM Vol |
|
|
|
|
|
||||||
|
|
|
|
|
|
|
||||
Source: CME |
|
|
Source: CME |
|
|
|||||
3. In the current environment, momentum trading strategies ultimately moved calendar 2019 WTI prices through $60/bbl and near $55/bbl, a region where many of the put options purchased by producers in order to hedge their oil risk exposure had been struck. These put options are typically sold by financial houses and other swap dealers to oil producers looking to hedge their exposure to declining oil prices. In order to hedge the oil price risk that the dealers take on by selling put options to producers, the dealers will typically hedge some of their exposure by selling crude oil futures. The number of crude oil futures that must be sold to hedge the short put position is called the “delta” of the short put position, because it is the change in the value of the put option given a change in the price of the crude oil. This risk management practice is known as “delta-hedging”.
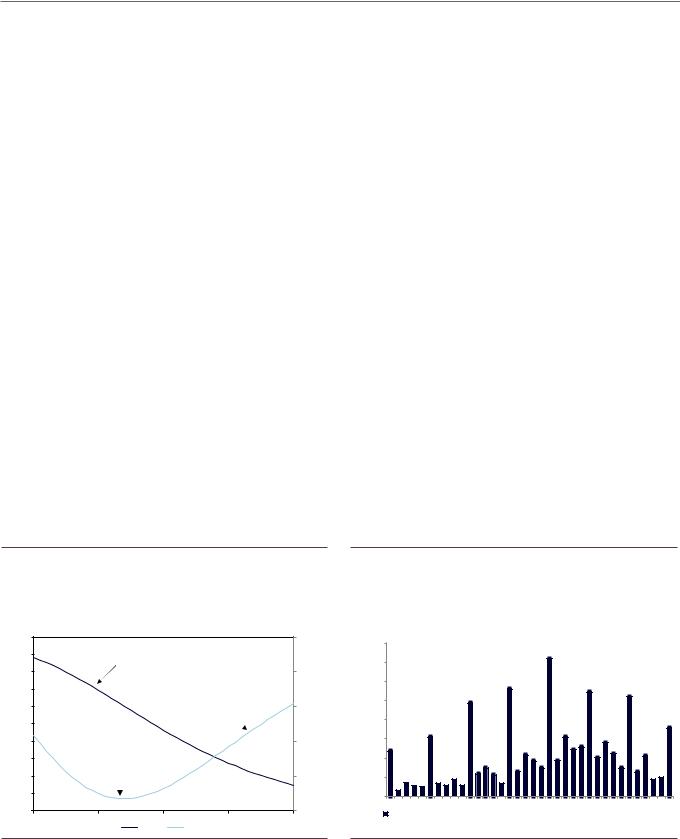
Exhibit 4: US E&Ps have mostly hedged their 2019 production around $55-60/bbl WTI prices
Average WTI hedge price level across US E&Ps ($/bbl)
$65
$60
$55
$50
$45
2017 |
2018 |
2019 |
|
Average hedged oil price |
|
Exhibit 5: Such hedging flows through 2017 left dealers with large offsetting positions
CFTC CoT Net short Swap Dealer positioning in WTI, number of
contracts |
200,000 |
100,000 |
0 |
-100,000 |
-200,000 |
-300,000 |
-400,000 |
-500,000 |
-600,000 |
-700,000 |
-800,000 |
-900,000 |
Source: Company data, Goldman Sachs Global Investment Research |
Source: CFTC, Goldman Sachs Global Investment Research |
4. However, the number of oil contracts that must be sold in order to hedge the short put position will vary with the price of crude oil. More specifically, as the price of crude oil falls, the “delta” of the short put position will increase. The intuition for this is straightforward: as the price of crude oil falls, the probability that the producer will
13 November 2018 |
2 |
vk.com/id446425943 |
Oil |
Goldman Sachs |
exercise the put option moves closer to one. Upon exercise of the put option, the seller of the put becomes an owner of crude oil, which by definition has a “delta” of one. Consequently, the closer the put option comes to being exercised (i.e., the closer to “in the money” it becomes) the higher the delta of the short put position. The rate at which the “delta” of the short put position changes with changes in the price of crude oil is known as the “gamma” of the short put position.
5.As shown in Exhibit 6, the rate at which the “delta” changes (i.e. the “gamma”) is close to zero for short put positions that are either far “out of the money” (unlikely to be exercised) or “deep in the money” (almost certain to be exercised). However, for puts that are “near the money” (closer to being exercised) the “gamma” on the short put position increases and reaches a point of maximum magnitude. At this point, a decline in the price of oil causes the largest increase in the “delta” of the short put position and a swap dealer that is trying to manage the risk of a short put position through delta-hedging will have to sell the largest amount of crude oil in response to a decline in crude oil prices.
6.These large “negative gamma” effects have become important in the current price environment as producers had already sold a large amount of forward production on the way up (see Exhibits 4 & 5). Unlike the sell-off earlier this month, the current sell-off has been accompanied by a sharp decline in longer-dated prices. In the recent sell-off, calendar 2019 WTI prices have declined to $55/bbl, which was viewed a year ago as the marginal cost of shale production. This has brought 2019 prices closer to the levels at which many put options were struck (see Exhibit 7). As crude oil prices have fallen closer to the strikes of these short put positions, the delta and the negative gamma of these positions have been increasing, forcing the swap dealer who sold the puts to producers to sell accelerating quantities of oil in order to stay delta-hedged.
Exhibit 6: Hedging the risk incurred by selling puts to producers generates added downward pressure when forward prices fall toward option strikes
Example of delta and gamma on European put options, using input data as of Fri Nov 9 close
Exhibit 7: The sell-off accelerated as WTI prices traded through the strikes of put options with large open interest
Open interest on WTI options by strike
1.000 |
|
|
|
|
|
0.900 |
Delta on a short put |
|
|
|
|
0.800 |
|
(left axis) |
|
|
|
|
|
|
|
|
|
0.700 |
|
|
|
|
|
0.600 |
|
Gamma on a short put |
|
||
|
|
(right axis) |
|
||
|
|
|
|
||
0.500 |
|
|
|
|
|
0.400 |
|
|
|
|
|
0.300 |
Maximum |
|
|
|
|
0.200 |
|
|
|
||
impact point |
|
|
|
||
0.100 |
|
|
|
|
|
0.000 |
|
|
|
|
|
40 |
50 |
Delta60 |
Gamma |
70 |
80 |
0.000 |
160,000 |
|
|
|
|
|
|
|
|
|
|
|
|
|
|
|
|
-0.005 |
140,000 |
|
|
|
|
|
|
|
120,000 |
|
|
|
|
|
|
|
|
|
|
|
|
|
|
|
|
|
-0.010 |
100,000 |
|
|
|
|
|
|
|
|
|
|
|
|
|
|
|
|
|
80,000 |
|
|
|
|
|
|
|
-0.015 |
60,000 |
|
|
|
|
|
|
|
|
40,000 |
|
|
|
|
|
|
|
-0.020 |
20,000 |
|
|
|
|
|
|
|
|
0 |
|
|
|
|
|
|
|
-0.025 |
40 |
45 |
50 |
55 |
60 |
65 |
70 |
75 |
WTI option open interest (Jan-19 through Dec-19 expirations) as of 13-Nov-18 |
|
|||||||
|
|
|||||||
Source: Goldman Sachs Global Investment Research |
Source: CME, Goldman Sachs Global Investment Research |
7. As seen in Exhibit 6, this dynamic was much less of an issue at higher prices (and would also be at much lower prices) as the change in delta relative to a change in price is much flatter. However, at current prices the market is near the point of maximum
13 November 2018 |
3 |
vk.com/id446425943 |
Oil |
Goldman Sachs |
impact for this dynamic. Further, the large concentration of open interest in put positions at the $50/bbl, $55/bbl, and $60/bbl strikes (see Exhibit 7) suggests that price volatility will remain extremely high while WTI prices remain in the $50-$60/bbl range as the need to adjust delta-hedges will cause the market to move away from the prices at which put open interest is concentrated, creating significant near-term volatility. This higher volatility in a wide trading band will likely drive a reduction in momentum chasing flows, although breaking out of this trading range would likely require a fundamental event. While we expect the move to be to the upside out of this trading range, given the large concentration of puts at $50/bbl, a temporary move in prices to near $50/bbl should not be precluded.
8. The fundamental catalysts for higher prices will be evidence that OPEC production is sequentially declining (not visible in export data so far in November) and further proof of demand resilience. Simple announcements of production cuts in the context of recent communications out of the White House puts the burden on the physical markets to create the catalyst. Further, upside in oil prices will face headwinds with a strong dollar and likely rising US producer hedging. Such a recovery in prices will therefore require that the Brent forward curve returns into backwardation from its sudden and significant flattening, which current data does not justify: inventories are not elevated, demand growth is likely to beat low expectations, Iran exports will decline further and ultimately core OPEC will likely reduce output, with positioning likely stretched short. The two main risks to our expectation that prices will recover from current levels are either (1) a sharp collapse in demand - a low probability outcome in our economists’ view and given current economic momentum - or (2) the absence of an OPEC cut - unlikely in our view given the associated economic strains. While both are unlikely, we are more concerned about the latter, with such a shift leading to sustainably lower prices.
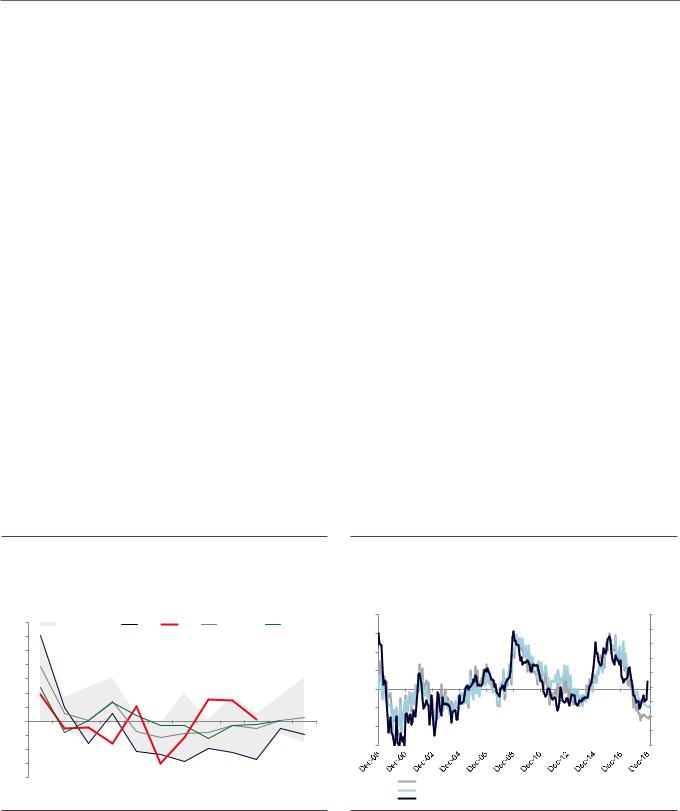
Exhibit 8: High-frequency inventory data showed near seasonal stock changes in October...
High frequency monthly total petroleum stock changes for in US, Japan, ARA, and Singapore (mb)
70 |
2013-2017 Range |
2017 |
2018 |
|
5-yr average |
Seasonal |
|||||
60 |
|
|
|
|
|
|
|
|
|
|
|
50 |
|
|
|
|
|
|
|
|
|
|
|
40 |
|
|
|
|
|
|
|
|
|
|
|
30 |
|
|
|
|
|
|
|
|
|
|
|
20 |
|
|
|
|
|
|
|
|
|
|
|
10 |
|
|
|
|
|
|
|
|
|
|
|
0 |
|
|
|
|
|
|
|
|
|
|
|
-10 |
|
|
|
|
|
|
|
|
|
|
|
-20 |
|
|
|
|
|
|
|
|
|
|
|
-30 |
|
|
|
|
|
|
|
|
|
|
|
-40 |
|
|
|
|
|
|
|
|
|
|
|
Jan |
Feb |
Mar |
Apr |
May |
Jun |
Jul |
Aug |
Sep |
Oct |
Nov |
Dec |
Exhibit 9: ... leaving the flattening of the Brent forward curve disconnected from inventory levels
OECD commercial stocks in days of OECD demand coverage vs. 3- or 5-yr avg (lhs) vs. 1-mo to 3-yr Brent timespreads (%, rhs, inverted)
20% |
-45% |
|
15% |
-35% |
|
-25% |
||
10% |
||
-15% |
||
|
||
5% |
-5% |
|
0% |
5% |
|
-5% |
15% |
|
25% |
||
-10% |
||
35% |
||
|
||
-15% |
45% |
OECD inventories (in days of fwd demand cover) vs. 3-yr avg vs. 5-yr avg
1-mo vs. 3-yr Brent timespread (rhs, inverted)
Source: Goldman Sachs Global Investment Research, EIA, PJK, PAJ, IE Singapore |
Source: Goldman Sachs Global Investment Research, IEA, ICE |
13 November 2018 |
4 |