

vk.com/id446425943
Russia
Energy: Integrated Oil & Gas
15 March 2019
Lukoil, ord. (LKOH RX, USD)
Hold (13 Nov 2018, 06:11 UTC)
Previous: Buy (12 Jan 2018, 13:01 UTC)
Target price, 12mo: 86.00
Last price: 85.64 (07 Mar 2019, close)
Expected total return: 5%
Upside, 12mo: 0%
DY, next 12mo: 4.4%
Lukoil, ADR (LKOD LI, USD)
Hold (13 Nov 2018, 06:11 UTC)
Previous: Buy (12 Jan 2018, 13:01 UTC)
Target price, 12mo: 86.00
Last price: 85.64 (07 Mar 2019, close)
Expected total return: 5%
Upside, 12mo: 0%
DY, next 12mo: 4.4%
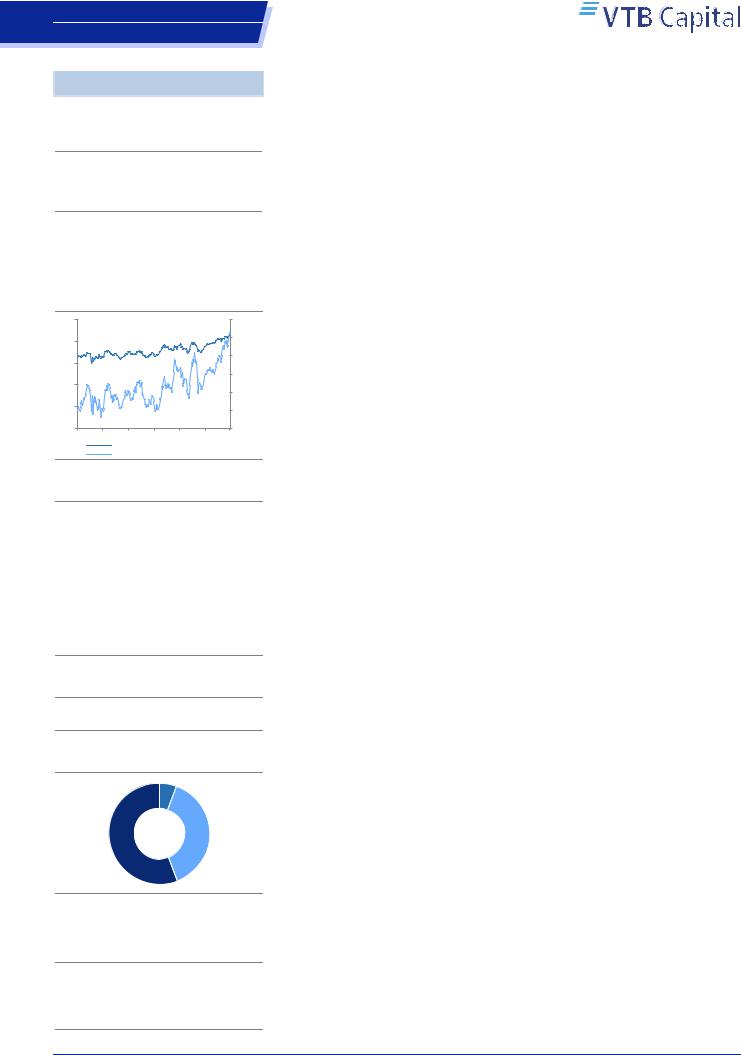
Share price performance, 12-mo
|
100 |
25% |
|
|
80 |
20% |
|
|
|
||
|
60 |
15% |
|
|
|
||
|
|
10% |
|
Equities |
40 |
5% |
|
|
|||
20 |
0% |
||
|
|||
0 |
-5% |
||
|
Mar May |
Jul |
Sep |
Nov |
Jan |
|
|
|
|
LKOH RX, USD, lhs |
|
|
||
|
|
|
|
|||
|
|
Relative to MOEX Index, %, rhs |
|
|||
|
|
|
||||
|
|
|
|
|
|
|
|
|
|
1M |
3M |
12M |
3Y |
Price |
|
5% |
8% |
31% |
122% |
|
Price relative |
|
6% |
6% |
21% |
71% |
|
ADTV (USD mn) |
|
101.00 |
105.59 |
110.26 |
101.49 |
|
Key financial highlights
Fiscal year end |
12/18 |
12/19F |
12/20F |
12/21F |
P/E, x |
5.2x |
8.9x |
7.6x |
7.4x |
EV/EBITDA, x |
2.9x |
4.4x |
4.0x |
3.7x |
P/B, x |
0.9x |
0.9x |
0.8x |
0.7x |
FCF yield, % |
17.2% |
6.5% |
8.0% |
7.9% |
DY (ords), % |
5.3% |
4.6% |
5.1% |
5.7% |
Net sales, USD mn |
128,218 |
103,649 |
105,701 |
108,398 |
EBITDA, USD mn |
17,787 |
14,474 |
15,601 |
16,146 |
Net income, USD mn |
9,879 |
7,202 |
8,458 |
8,731 |
Net sales, chg |
26% |
-19% |
2% |
3% |
EBITDA, chg |
25% |
-19% |
8% |
3% |
Net income, chg |
38% |
-27% |
17% |
3% |
EPS(ords), USD |
13.17 |
9.60 |
11.28 |
11.64 |
DPS (ord.), USD |
3.65 |
3.95 |
4.40 |
4.85 |
BPS(ords), USD |
78.18 |
90.30 |
103.8 |
117.2 |
EBITDA margin, % |
13.9% |
14.0% |
14.8% |
14.9% |
ROE, % |
17% |
11% |
11% |
10% |
Net Debt, USD mn |
233 |
(476) |
(2,380) |
(3,928) |
ND/EBITDA, x |
0.0x |
0.0x |
(0.2x) |
(0.2x) |
Net int. cover, x |
20.2x |
13.0x |
42.4x |
44.4x |
Multiples and yields are calculated based on period-average prices where available.
Source: Bloomberg, Company data, VTB Capital Research
Focus
Lukoil
I can see clearly now the rain is gone
Lukoil is one of the best examples of a gradual but steady improvement in corporate governance, and we think this has been appreciated by the investment community. With USD 1.7bn spent on the buyback since September, the stock is one of the best performing in the sector. We note that in some weeks, the company has accounted for more than 20% of the ADTV this year. We continue to have a relative preference for Lukoil in the oil sector in Russia. However, the upside on the stock is capped by our reserved stance on oil prices. We reiterate our 12-month Target Price of USD 86 (5% ETR) and Hold recommendation.
Steady improvement in corporate governance. Lukoil is one of the brightest examples of a multi-year corporate governance improvement, and we think the investment community has started to appreciate this of late. In 2013, the company explicitly stated its targets on this front, but real delivery came with the treasury shares issue resolution in January 2018. Since 2013, Lukoil has addressed every issue, including international M&A (limited activity), decent dividends, buybacks and the cancellation of treasuries.
Lukoil to benefit modestly from regulatory changes. Lukoil will not particularly benefit from the introduction of EPT, we think, as Filanovskogo enjoys a special tax regime, while Korchagina would be better off staying under the current regulations (thanks to the existing tax breaks). However, the company is to increase the share of high-margin barrels further thanks to HTR expansion. The risks for Lukoil stem from a potential payment under the damper mechanism that could lead to USD 0.2bn of additional taxes (1.4% of EBITDA) in 2019 in our base scenario (under the current oil price, Lukoil might get some USD 0.6bn from the state, though, we estimate).
Buyback is one of the most important stock price drivers. Lukoil has spent some USD 1.7bn since last September, or 55% of the announced USD 3bn buyback. It formed more than 20% of the ADTV in February, which we believe is probably the most important factor behind the rally in the name (Lukoil has outperformed the RTS and RTS O&G by 9% and 14% YTD).
‘Inside out’ indicates undervaluation if oil price holds. Lukoil’s tax breaks have historically formed c.65% of earnings, making the company’s profitability dependent on the oil price. Given our muted stance on the crude price (USD 57/bbl in 2019F) we estimate that Lukoil’s shares are now trading at a 73% premium to the NPV of its tax reliefs. However, the stock is trading at just a 9% premium to the NPV of the tax breaks under the current oil price, which might be a good indication of the likely shares appreciation for those investors with a more bullish view on oil prices, we think.
Dmitry Loukashov, CFA, Equities Analyst
+7 495 663 46 34 // dmitry.loukashov@vtbcapital.com
Ekaterina Rodina, Equities Analyst
+7 495 663 47 33 // ekaterina.rodina@vtbcapital.com
Alexander Donskoy, Equities Analyst
+7 495 660 67 88 // alexander.donskoy@vtbcapital.com
Artur Muradyants, Equities Analyst
+7 495 663 46 38 // artur.muradyants@vtbcapital.com
Aydar Safin, Equities Analyst
+7 495 663 46 32 // aydar.safin@vtbcapital.com
Prices cited in the body of this report are as of the last close before, or the close on, 14 Mar 2019 (except where indicated otherwise). VTB Capital analysts update their recommendations periodically as required. This research report was prepared by the analyst(s) named above who is(are) associated with JSC VTB Capital and is distributed by JSC VTB Capital and VTB Capital PLC and their non-U.S. affiliates outside the United States. This VTB Capital research report is distributed to investors located within United States by Xtellus Capital Partners, Inc. (“Xtellus”) as a “third-party research report” as defined in Rule 2241(a)(14) and Rule 2242(a)(17) of the U.S. Financial Industry Regulatory Authority. Please refer to the Disclosures section of this report for other important disclosures, including the analyst certification and information required by regulation.

vk.com/id446425943 |
|
|
Russia |
Lukoil |
|
Energy: Integrated Oil & Gas |
|
|
|
Table of contents |
|
|
Lukoil – Impressive Corporate Governance Drive................................................... |
4 |
|
Way to being the most owned stock in the Russian oil space ................................. |
6 |
|
Focus on High Margin Barrels in Upstream............................................................. |
8 |
|
Regulatory environment .................................................................................... |
10 |
|
West Qurna-2 and other potential international expansion................................ |
13 |
|
Downstream........................................................................................................... |
13 |
|
Downstream tax amendments........................................................................... |
15 |
|
Valuation................................................................................................................ |
16 |
|
‘Inside out’ approach ......................................................................................... |
17 |
|
Appendix – Korchagina field regulatory regime ..................................................... |
19 |
|
Disclosures ............................................................................................................... |
20 |
15 March 2019 |
2 |
vk.com/id446425943
Russia
Energy: Integrated Oil & Gas
VTB Capital Facts & Forecasts
Russia
Energy / Integrated Oil & Gas
Lukoil
Prices as of: 7 March 2019
Ticker |
CCY |
Current |
12mo TP |
Rating |
LKOH RX |
USD |
85.64 |
86.00 |
Hold |
Share price performance, 12-mo
100 |
25% |
80 |
20% |
|
|
60 |
15% |
|
|
|
10% |
40 |
5% |
|
|
20 |
0% |
|
|
0 |
-5% |
Mar May Jul Sep Nov Jan Mar
LKOH RX, USD, lhs
Relative to MOEX Index, %, rhs
Company description
Lukoil is Russia's largest non-state-owned integrated oil and gas company. In 2018, it produced 84.8mmt (flat YoY) of crude oil (including oil produced within international projects) which makes it the second largest oil producer in Russia. Refining occurs in Russia (in the Central region and Timano-Pechora) and abroad (Romania, Bulgaria, Italy and the Netherlands). The company's total proved reserves of crude amounted to 12bn bbl, according to SEC standards, as of the end of 2018, thus representing a robust 19 years of liquids reserves life. Total refining in 2018 was 73.9mmt (also flat YoY).
Company website
http://www.lukoil.com/
Shareholder structure
Other/Free |
Treasury |
float |
shares |
56% |
5% |
Management of the company 39%
Source: Company data, VTB Capital Research
Research team
Dmitry Loukashov, CFA / +7 495 663 46 34
Ekaterina Rodina / +7 495 663 47 33
Alexander Donskoy / +7 495 660 67 88
Aydar Safin / +7 495 663 46 32
Artur Muradyants / +7 495 663 46 38
Lukoil
Last model update on: 5 March 2019
|
IFRS |
2017 |
2018 |
2019F |
2020F |
2021F |
|
2022F |
|
|
Company data |
|
|
|
|
|
|
|
|
|
Weighted avg # shares, mn |
850.6 |
750.0 |
750.0 |
750.0 |
750.0 |
|
750.0 |
|
|
Avg market cap, USD mn |
37,177 |
48,957 |
59,685 |
59,685 |
59,685 |
|
59,685 |
|
|
EV, USD mn |
41,802 |
49,190 |
59,209 |
57,304 |
55,756 |
|
54,187 |
|
|
Ratios & analysis |
|
|
|
|
|
|
|
|
|
P/E, x |
6.2x |
5.2x |
8.9x |
7.6x |
7.4x |
|
7.3x |
|
|
EV/EBITDA, x |
3.4x |
2.9x |
4.4x |
4.0x |
3.7x |
|
3.6x |
|
|
P/B, x |
0.7x |
0.9x |
0.9x |
0.8x |
0.7x |
|
0.7x |
|
|
FCF yield, % |
9.6% |
17.2% |
6.5% |
8.0% |
7.9% |
|
8.5% |
|
|
Dividend yield (ords), % |
6.6% |
5.3% |
4.6% |
5.1% |
5.7% |
|
5.7% |
|
|
Dividend yield (prefs), % |
|
|
|
|
|
|
|
|
|
EPS(ords), USD |
8.44 |
13.17 |
9.60 |
11.28 |
11.64 |
|
11.75 |
|
|
CFPS, USD |
15.28 |
21.42 |
16.75 |
17.74 |
18.16 |
18.29 |
|
|
|
Free CFPS, USD |
5.01 |
11.91 |
5.57 |
6.83 |
6.80 |
7.28 |
|
|
|
DPS (ords), USD |
3.43 |
3.65 |
3.95 |
4.40 |
4.85 |
4.85 |
|
|
|
Payout ratio (ords), % |
34.0% |
26.2% |
38.2% |
36.2% |
38.7% |
38.3% |
|
|
|
BPS(ords), USD |
71.24 |
78.18 |
90.30 |
103.8 |
117.2 |
130.3 |
|
|
|
Revenues growth, % |
31% |
26% |
-19% |
2% |
3% |
0% |
|
|
|
EBITDA, chg |
31% |
25% |
-19% |
8% |
3% |
1% |
|
|
|
EPS growth, % |
133% |
56% |
-27% |
17% |
3% |
1% |
|
|
|
EBIT margin, % |
9% |
10% |
9% |
10% |
10% |
10% |
|
|
|
EBITDA margin, % |
14.0% |
13.9% |
14.0% |
14.8% |
14.9% |
|
15.1% |
|
|
Net margin, % |
7.1% |
7.7% |
6.9% |
8.0% |
8.1% |
8.1% |
|
|
|
ROE, % |
11.9% |
16.9% |
10.7% |
10.9% |
10.0% |
|
9.0% |
|
|
ROIC, % |
8.5% |
13.8% |
9.5% |
9.7% |
9.1% |
8.5% |
|
|
|
Capex/Revenues, % |
9% |
6% |
8% |
8% |
8% |
8% |
|
|
|
Capex/Depreciation, x |
1.6x |
1.3x |
1.7x |
1.6x |
1.7x |
|
1.6x |
|
|
Net debt/Equity, % |
8% |
0% |
-1% |
-3% |
-4% |
-6% |
|
|
|
Net debt/EBITDA, x |
0.3x |
0.0x |
0.0x |
(0.2x) |
(0.2x) |
|
(0.3x) |
|
|
Net interest cover, x |
18.5x |
20.2x |
13.0x |
42.4x |
44.4x |
|
45.2x |
|
|
Income statement summary, USD mn |
|
|
|
|
|
|
|
|
|
Revenues |
101,739 |
128,218 |
103,649 |
105,701 |
108,398 |
108,655 |
|
|
|
Cost of sales |
(84,655) |
(107,360) |
(86,249) |
(87,075) |
(89,083) |
(89,094) |
|
|
|
SG&A and other opexp. |
(2,833) |
(3,070) |
(2,926) |
(3,025) |
(3,169) |
(3,187) |
|
|
|
EBITDA |
14,251 |
17,787 |
14,474 |
15,601 |
16,146 |
16,374 |
|
|
|
Depreciation & amortization |
(5,571) |
(5,474) |
(4,994) |
(4,973) |
(5,012) |
(5,031) |
|
|
|
Operating profit |
8,680 |
12,313 |
9,480 |
10,628 |
11,134 |
11,343 |
|
|
|
Non-operating gains /(exp.) |
223 |
(83) |
(595) |
(580) |
(580) |
(580) |
|
|
|
EBIT |
8,680 |
12,313 |
9,480 |
10,628 |
11,134 |
11,343 |
|
|
|
Net interest income/(exp.) |
(209) |
(299) |
(194) |
151 |
151 |
|
151 |
|
|
Profit before tax |
8,983 |
12,334 |
9,067 |
10,575 |
11,081 |
|
11,290 |
|
|
Income tax |
(1,778) |
(2,424) |
(1,843) |
(2,091) |
(2,323) |
|
(2,452) |
|
|
Minority interests |
(28) |
(31) |
(22) |
(26) |
(27) |
(27) |
|
|
|
Net income |
7,177 |
9,879 |
7,202 |
8,458 |
8,731 |
8,810 |
|
|
|
Cash flow statement summary, USD mn |
|
|
|
|
|
|
|
|
|
Cash flow from operations |
12,998 |
16,062 |
12,561 |
13,305 |
13,617 |
|
13,716 |
|
|
Working capital changes |
(428) |
(536) |
|
|
|
|
|
|
|
Capex |
(8,766) |
(7,204) |
(8,381) |
(8,184) |
(8,517) |
|
(8,258) |
|
|
Other investing activities |
(112) |
(123) |
- |
- |
- |
- |
|
|
|
Free cash flow |
4,261 |
8,933 |
4,180 |
5,121 |
5,100 |
5,458 |
|
|
|
Share issue (reacquisition) |
(162) |
(957) |
|
|
|
|
|
|
|
Dividends paid |
(2,425) |
(2,559) |
(2,743) |
(2,966) |
(3,301) |
(3,637) |
|
|
|
Net change in borrowings |
(987) |
(3,325) |
|
|
|
|
|
|
|
Other financing cash flow |
(665) |
(635) |
(728) |
(251) |
(251) |
(251) |
|
|
|
Movement in cash |
1,183 |
2,589 |
709 |
1,904 |
1,548 |
1,570 |
|
|
|
Balance sheet summary, USD mn |
|
|
|
|
|
|
|
|
|
Cash and equivalents |
5,736 |
7,091 |
7,801 |
9,705 |
11,253 |
12,823 |
|
|
|
PP&E |
62,069 |
55,119 |
63,500 |
71,684 |
80,201 |
88,459 |
|
|
|
Goodwill |
717 |
601 |
601 |
601 |
601 |
601 |
|
|
|
Investments |
3,192 |
3,660 |
3,660 |
3,660 |
3,660 |
3,660 |
|
|
|
Other assets |
19,019 |
16,043 |
16,044 |
16,044 |
16,044 |
16,044 |
|
|
|
Total assets |
90,733 |
82,515 |
91,606 |
101,694 |
111,759 |
121,587 |
|
|
|
Interest bearing debt |
10,701 |
7,702 |
7,702 |
7,702 |
7,702 |
7,702 |
|
|
|
Other liabilities |
19,435 |
16,177 |
16,177 |
16,177 |
16,177 |
|
16,177 |
|
|
Total liabilities |
30,136 |
23,879 |
23,879 |
23,879 |
23,879 |
23,879 |
|
|
|
Total shareholder's equity |
60,468 |
58,522 |
67,589 |
77,652 |
87,690 |
97,491 |
|
|
|
Minority interest |
129 |
115 |
137 |
163 |
190 |
217 |
|
|
|
Net working capital |
4,453 |
3,808 |
3,808 |
3,808 |
3,808 |
3,808 |
|
|
|
Net Debt |
4,625 |
233 |
(476) |
(2,380) |
(3,928) |
(5,498) |
|
|
|
Capital |
71,168 |
66,224 |
75,291 |
85,354 |
95,392 |
105,193 |
|
|
|
|
|
|
|
|
|
|
|
|
15 March 2019 |
3 |
vk.com/id446425943 |
Lukoil |
Russia |
|
Energy: Integrated Oil & Gas |
|
Lukoil – Impressive Corporate Governance
Drive
Lukoil has attracted wider investment community attention as a result of the ongoing buyback and the share price has shown a decent performance, with the stock beating the RTSI by 9% YTD.
The company has demonstrated a notable trend of improving corporate governance since 2013, which we think is behind the stock’s strong performance.
We see the company’s domestic crude oil production increasing at a CAGR of 1% in 2019-20F with the share of high margin barrels growing to 41% in 2020F from c.31% now.
The profitability of the downstream is set to improve thanks to the growing share of diesel and declining share of FO, and this is likely to offset the negative effect of IMO restrictions.
Our ‘inside out’ approach under USD 57/bbl shows that Lukoil now trades at a 9% premium to the NPV of the combined tax reliefs. However, if oil stays at USD 67/bbl, that might be a good indication for likely further stock price appreciation.
Although we see the downside as pretty limited, given the buyback and predictable dividend policy, the upside is capped mainly due to our muted view on the oil price.
Lukoil still remains our relative preferred play in the Russian oils despite the Hold recommendation.
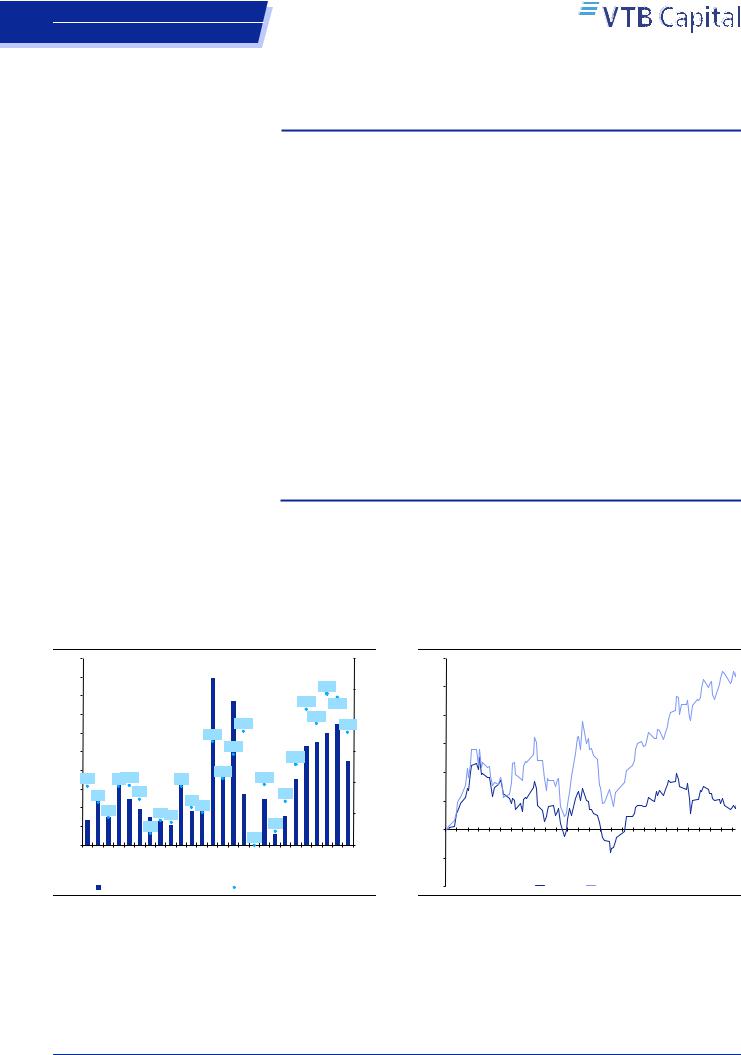
Lukoil has spent USD 1.7bn on the buyback since September 2018, accounting for some 10% of the daily trading volume on average for the period (22% for the last month, spending some USD 0.5bn). Although it is not particularly clear to us what is behind this accelerated buyback, we treat it as beneficial for minority shareholders. Nevertheless, we believe this has been one of the most important driver for the stock’s recent performance.
Figure 1: More than half of USD 3bn buyback has been spent by now
|
200 |
|
|
|
|
|
|
|
30% |
|
180 |
|
|
|
|
|
|
24% |
|
|
160 |
|
|
|
|
|
|
25% |
|
|
|
|
|
|
|
|
|
||
|
|
|
|
|
|
22% |
24% |
|
|
|
|
|
|
|
|
|
|
||
|
140 |
|
|
|
|
|
19% |
20% |
|
|
120 |
|
|
|
17% |
18% |
18% |
||
USDmn |
|
|
|
|
|
|
|||
100 |
|
|
|
|
15% |
|
15% |
||
|
|
|
|
|
|
||||
|
|
|
|
|
|
13% |
|
||
|
|
|
|
|
|
|
|
|
|
|
80 |
9% |
9%10% |
9% |
11% |
10% |
|
|
|
|
60 |
|
|
10% |
|||||
|
|
|
7% |
|
|
|
|
||
|
7% |
|
|
|
7% |
|
|
||
|
|
|
6%5% |
|
|
|
|||
|
40 |
4% |
|
|
|
|
|
||
|
|
4%4% |
|
|
|
5% |
|||
|
|
|
|
|
2% |
|
|||
|
20 |
|
|
2% |
|
|
|
|
|
|
0 |
|
|
|
|
|
0% |
|
0% |
|
Week 1 Week 2 Week 3 |
|
Week 4 Week 5 Week 6 Week 7 Week 8 |
Week 9 Week 10 Week 11 Week 12 Week 13 |
Week 14 Week 15 Week 16 Week 17 Week 18 Week 19 Week 20 Week 21 Week 22 Week 23 |
Week 24 Week 25 Week 26 |
|||
|
|
|
|
||||||
|
|
Buyback traded volumes, USDmn |
|
Share of total traded volumes |
|
||||
Source: Company data, VTB Capital Research
Figure 2: Lukoil’s shares have outperformed RTS O&G by 23% since the buyback was launched
30%
25% |
|
|
|
|
20% |
|
|
|
|
15% |
|
|
|
|
10% |
|
|
|
|
5% |
|
|
|
|
0% |
12-Sep |
19-Sep 26-Sep 3-Oct 10-Oct 17-Oct 24-Oct 31-Oct 7-Nov 14-Nov 21-Nov 28-Nov 5-Dec |
12-Dec 19-Dec 26-Dec 2-Jan 9-Jan 16-Jan 23-Jan 30-Jan 6-Feb 13-Feb 20-Feb 27-Feb 6-Mar 13-Mar |
|
-5% |
||||
|
|
|
||
-10% |
|
RTS O&G |
LKOD LI |
Source: Company data, VTB Capital Research
15 March 2019 |
4 |
vk.com/id446425943
Russia
Energy: Integrated Oil & Gas
Lukoil
We note the consistent trend of corporate governance improvements across the board at Lukoil in recent years. While, from the operational profitability standpoint, the company has remained more or less the same, in our view it is corporate governance that has provided the impetus for the appreciation in Lukoil’s shares. And it must be noted that over the last 12-15 months, Lukoil has addressed almost all the issues which had been raised:
Poor communication practices
Low dividends and reluctance to revise dividend policy
Treasury shares on the balance
International expansion
•Refineries in Europe
•Offshore exploration in Africa
General lack of care about minorities
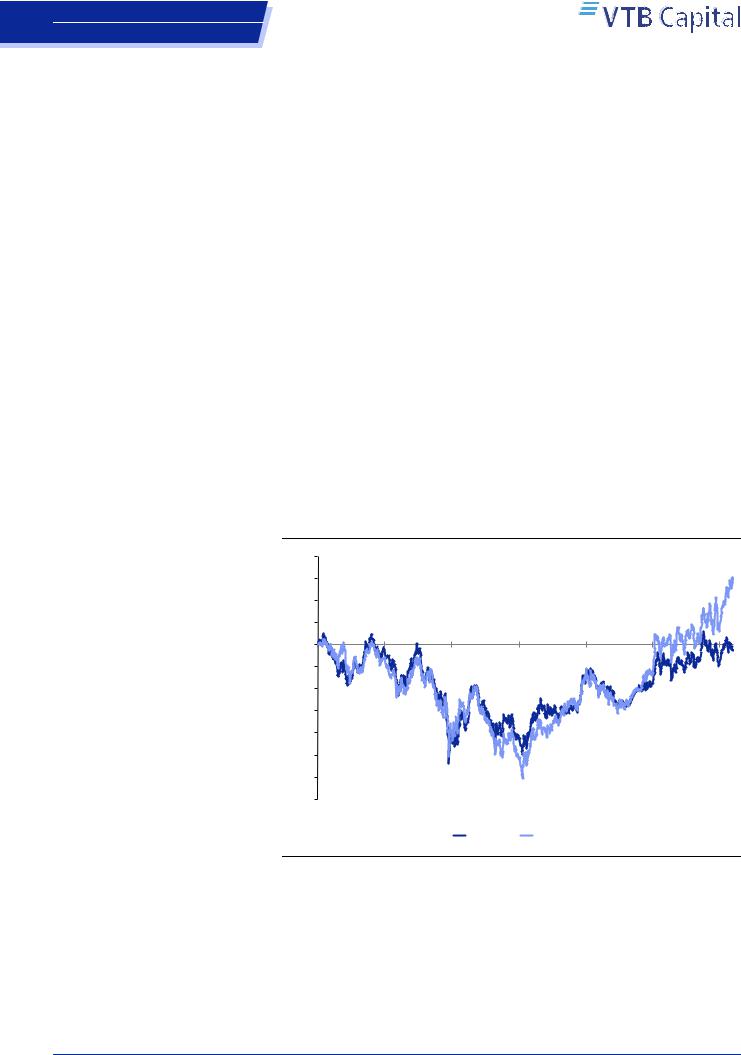
Improving corporate governance practices was one of the key targets of the company’s 2013 Strategy, with the first strategic aim being ‘Value creation and accelerating the growth of dividends’. Since then, Lukoil has behaved consistently. Based on the stock’s performance, we think that, although this was visible, investors were not in rush to price it in. The stock only started to outperform peers visibly after the company announced its intention to cancel 12% of treasury shares in January 2018. Since then, Lukoil has been the second best performing stock in the oil space (after Tatneft, which has also massively improved its corporate governance), delivering +49% in capital gains since 1 January 2018 and outperforming the RTS O&G Index by 31% in dollar terms.
Figure 3: Lukoil is among the top performers over the last five years
40%
30%
20%
10%
0% -10% -20% -30% -40% -50% -60% -70%
2013 |
2014 |
2015 |
2016 |
2017 |
2018 |
2019 |
|
|
|
RTS O&G |
LKOD LI |
|
|
Source: Bloomberg, VTB Capital Research
15 March 2019 |
5 |
vk.com/id446425943 |
Lukoil |
Russia |
|
Energy: Integrated Oil & Gas |
|
Way to being the most owned stock in the Russian oil space
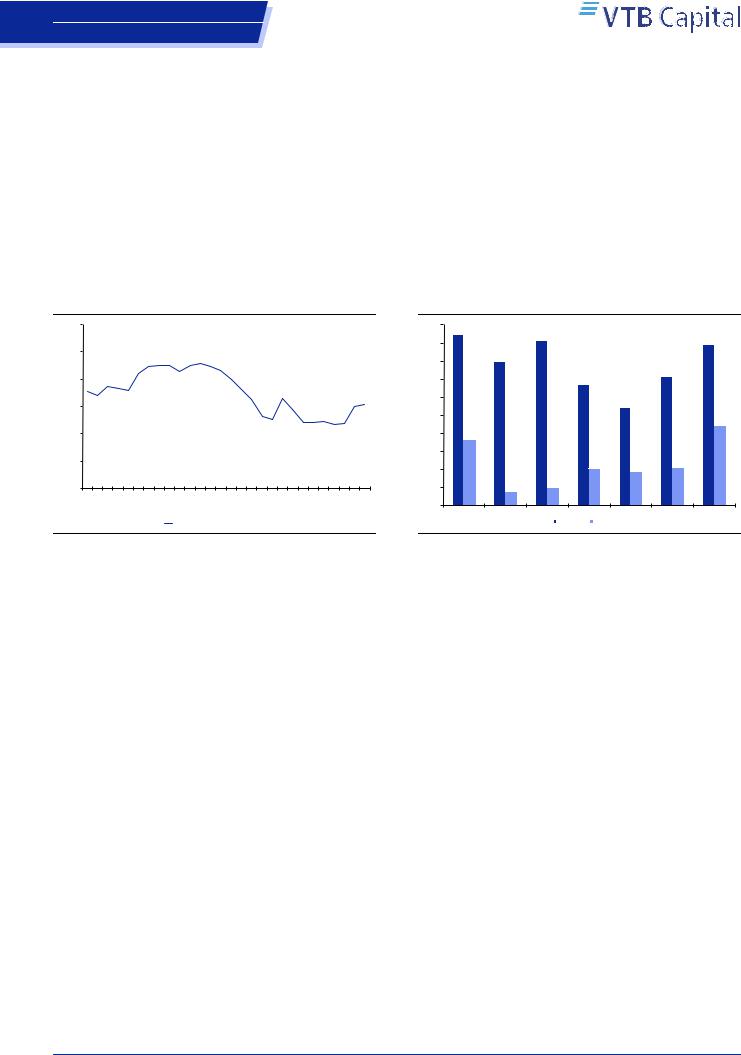
What was Lukoil back in 2012? Along with TNK-BP, Bashneft and Alliance oil, it was one of the non-state owned, public, large cap (hence, liquid) integrated oil and gas companies in Russia. Lukoil’s share in the core indices has always been significant – 14.5% and 0.8% in MSCI Russia and EM, respectively (on 1 January 2013) vs. 21.3% and 0.8% now. The company produced c.1.7mmbbl/d (84mmt) of oil in 2012 compared with 1.6mmbbl/d (c.81mmt) in 2018 (-c.3%) and refined in total 44mmt and 43mmt (-c.3%) of oil in the respective years in Russia. Lukoil’s EBITDA in 2018 came 6% lower than it was in 2012 (USD 18.9bn vs. USD 17.8bn), while the company’s FCF has increased 21% (from USD 7.4bn to USD 8.9bn) providing for the respective FCF yields of 14.5% and 15.4%.
Figure 4: Crude production in Russia remained broadly flat…
1.80
1.75
1.70 mnb/d 1.65 1.60
1.55
1.50
1Q2012 |
2Q2012 |
3Q2012 |
4Q2012 |
1Q2013 |
2Q2013 |
3Q2013 |
4Q2013 |
1Q2014 |
2Q2014 |
3Q2014 |
4Q2014 |
1Q2015 |
2Q2015 |
3Q2015 |
4Q2015 |
1Q2016 |
2Q2016 |
3Q2016 |
4Q2016 |
1Q2017 |
2Q2017 |
3Q2017 |
4Q2017 |
1Q2018 |
2Q2018 |
3Q2018 |
4Q2018 |
|
|
|
|
|
|
|
|
|
Crude production in Russia |
|
|
|
|
|
|
|
|
|
|
||||||||
Source: Company data, VTB Capital Research
Figure 5: …as did the financial performance, at first glance
20
18
16
14
12
USDbn 10
8
6
4
2
-
2012 |
2013 |
2014 |
2015 |
2016 |
2017 |
2018 |
|
|
|
EBITDA FCF |
|
|
|
Source: Company data, VTB Capital Research
We acknowledge that there have been changes in the company’s business operations (for example, it has launched large greenfields in Russia and Iraq, modernised refineries, developed premium sales channels in the downstream, and commissioned new oil and gas fields in former CIS countries). Also, in addition to the macro situation being quite volatile (with oil losing USD 40/bbl and RUB depreciating 50%), there have been significant changes in the regulatory environment (such as the numerous modifications to the tax manoeuvre). However, in terms of its operational profitability and financial performance, Lukoil seems not to have changed dramatically.
What has really changed is corporate governance.
Formally, as we mentioned above, Lukoil set value creation via an increase in the dividends as one of the targets in the March 2013 Strategy. Back then, the market took it with a grain of salt. Given the company’s track record, investors were sceptical and wanted to see proof of a change in the company’s attitude towards minority shareholders. We think that the first real step in the corporate governance turnaround for Lukoil happened in March 2015, when CEO Vagit Alekperov announced that Lukoil might exit all international offshore projects in Western Africa due to the lack of commercial reserves. International investments (in refining and risky offshore exploration), which has always been one of the most questionable parts of Lukoil’s business activity. Apart from the capex, which was constantly being channelled to offshore exploration with operational and regulatory risks (USD 16.7bn was spent during 2008-15), the company had been steadily writing off dry wells in Africa, Romania, Vietnam, Saudi Arabia and other foreign regions (USD 2.4bn in total for 2008-16), which negatively affected Lukoil’s earnings. In June 2015, the company announced that it had decided to exit from one of two exploratory projects in Ghana. Then, by January 2016 Lukoil left all the projects in Sierra Leone and Cote d’Ivoire, keeping its exposure to the region only via one project in each of Ghana, Cameroon and Nigeria (none of which is operated by Lukoil). International refining and upstream (apart from the West Qurna-2 and CIS projects – mostly PSAs) stopped to be a focus area for the company (the drop in the oil price in 4Q14 might be one of the reasons, though).
15 March 2019 |
6 |

vk.com/id446425943
Russia
Energy: Integrated Oil & Gas
Lukoil
Although the company had started to limit risky international activities, this had no immediate effect on the stock price (even when Lukoil really started to focus on the dividends part of the story). The first signs of a renaissance in investment community interest towards Lukoil’s shares merged after the approval of the new dividend policy, which made the distribution of dividends more predictable. Before that, the company’s official dividend policy implied a payout of not less than 15%. In April 2016, the payout ratio was increased to 25%, while the potential downside was limited to rouble inflation of the previous year’s DPS (the company pays out the higher of these two). Although this was an important step in the overall corporate governance improvement of Lukoil, this did not see any tangible reflection in the stock performance, which makes us think that investors were not really impressed back then.
The strengthening of the IR team in August 2016 led to an immediate improvement in disclosure practices (operating statistics became available before the financial results were published, databook updates were given in a timely fashion, etc). Moreover, this led to management being more accessible (during conference calls and investor/analyst meetings), which we think was also appreciated by investors.
After that, there was only one disturbing factor left in Lukoil’s story: the 17% quasitreasury shares stake. And, finally, continuing the trend of the improvement in corporate governance, in January 2018 Lukoil announced its intention to cancel almost 12% of share capital (100.6mn shares) with some 5% to be spent for the management compensation programme. We think this was the real turning point, when investors’ appreciation of the steady, multi-year improvement in the corporate governance at Lukoil finally started to be reflected in the stock’s performance. The treasury shares were officially cancelled in November last year.
Furthermore, during its Strategy Update in March 2018, Lukoil announced its intention to spend half of the FCF generated at oil prices above USD 50/bbl for the shares buyback. In September 2018, the company announced a USD 3bn buyback programme for 2018-20 with all treasuries to be cancelled after the completion of the buyback. Given the accelerated pace of the buyback (USD 1.66bn has been spent as of now) the company stated that it might complete it as early as this year. This buyback is to be followed by another one, the details of which are to be discussed in 3Q19.
In addition, on 6 March the company’s BoD approved the amendment of the dividend policy, which is now going to account for the shares owned by Lukoil’s Group. This means that the greater buyback pace could provide for faster dividends growth. As a result of this amendment, we estimate that for 2018 Lukoil’s shareholders might receive RUB 5 more in DPS, which implies 0.1% additional DY. For 2018 in total, the company might pay RUB 240 (including RUB 85/share distributed for 9mo18) or 4.3% DY, on our numbers.
Over the last 20 years, Lukoil’s FCF has turned negative only once, in 1998. The company has sustainably generated positive FCF, although we do not think this was really appreciated by the investment community, given that sharing this cash with investors was not considered to be a priority. Now, that is no longer valid. With USD 1.7bn of cash spent on the buyback of own shares over the last six months and the intention to amend the dividend policy to account for the cancellation of the treasuries, Lukoil is essentially sharing its FCF with minority investors. We therefore believe that it is worth reminding ourselves what Lukoil as a company is now.
15 March 2019 |
7 |