

McKinsey - Global gas and LNG outlook to 2035_watermark
.pdfvk.com/id446425943
Global gas & LNG outlook to 2035
H1 2019

|
Executive summary |
Recap 2018–H1 2019 Gas demand outlook Gas supply outlook |
Infrastructure |
LNG outlook |
Business model |
2 |
|
vk.com/id446425943 |
|
|
|
|
|
|
|
|
|
|
|
|
Key messages
A Recap 2018–H1 2019
• China emerged as the world’s largest gas/LNG importer
• 76 million tonnes per annum (mtpa) of LNG-related infrastructure became operational; the LNG industry registered an all time high volume of liquefaction projects taking final investment decisions (FIDs) (7 projects, 61 mtpa)
B Gas demand
• Gas is the only fossil fuel that is expected to grow continuously to 2035; demand growth will slow to 1.3% per annum (p.a.) between 2018 and 2023 and to 0.7% p.a. between 2023 and 2035
• Asia remains the engine for growth in gas demand, with growth of 2.1% p.a. between 2018-2035
• Demand growth in power and gas-intensive industry sectors represents ~70% of total global growth until 2035

|
Executive summary |
Recap 2018–H1 2019 Gas demand outlook Gas supply outlook |
Infrastructure |
LNG outlook |
Business model |
3 |
|
vk.com/id446425943 |
|
|
|
|
|
|
|
|
|
|
|
|
C Gas supply
•Global gas supply growth is expected to be driven primarily by the United States (+380 bcm (billion cubic meters)) as well as Russia (+110 bcm) and Africa (+110 bcm), while production in Europe and Rest of Asia will decline rapidly
D LNG outlook and infrastructure
•While LNG demand grows at 3.6% p.a.between 2018-35, we see oversupply returning to the market in 2024-2026 1 with new capacity required only from 2027-2028 onward
•China, ASEAN, and South Asia will account for more than 95% of global LNG demand growth until 2035
•US projects will likely compete intensely with each other as the marginal supply
E Business model
•Traditional LNG models are evolving with players expanding across the LNG value chain (i.e., forward or backward integration) and new business models emerging (e.g., traders, utility resellers)
1 We assume all post-FID capacity and Qatar North Field expansion to come onstream before 2025

Executive summary |
Recap 2018–H1 2019 |
Gas demand outlook Gas supply outlook |
Infrastructure |
LNG outlook |
Business model |
4 |
vk.com/id446425943 |
|
|
|
|
|
|
|
|
|
|
|
|
|
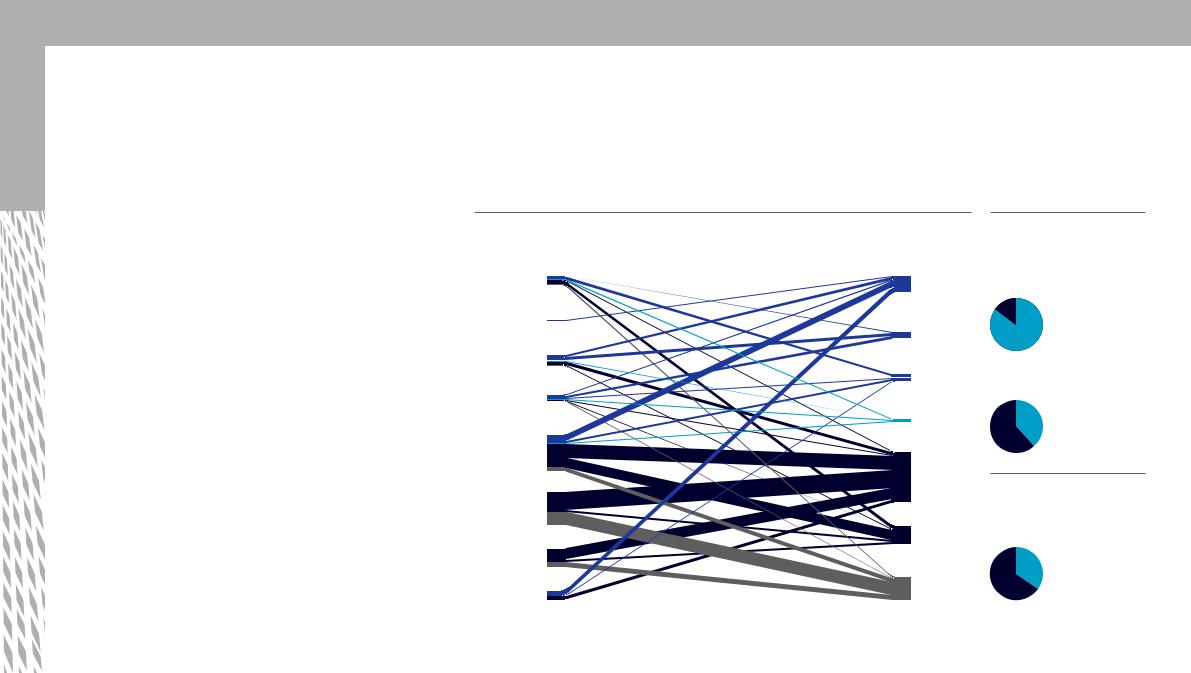
A Gas registered its highest year-over-year growth rate (5.3%) since 2010; 2018 saw increased flows across both LNG and cross-border pipeline flow
• China grew 18% year over |
Main 2018 pipeline and LNG flows |
|
|
|
|
|
|
Flow |
||
year, with growth driven by |
|
|
|
|
|
|
||||
bcm |
|
Supply 2018 |
2018 flows |
|
LNG |
Cross-border piped gas |
Domestic bcm |
|||
implementation of the “blue |
|
|
||||||||
|
|
|
|
|
|
|
|
|
|
|
sky” policy, and emerged as |
|
|
|
Europe |
Russia and Central Asia |
+5.3% |
||||
the largest total gas and LNG |
|
|
|
p.a. |
||||||
|
|
|
|
263 |
|
|
|
865 |
|
|
importer overtaking Japan |
|
North America |
|
10 |
|
|
3,603 |
|||
|
|
|
|
|
|
15 |
||||
• Nine new liquefaction projects |
|
987 |
4 |
|
|
203 |
|
|
398 |
|
|
|
|
|
45 |
China |
|||||
came onstream, increasing global |
|
|
|
|
|
|
|
15 |
||
|
46 |
|
|
Middle East |
99 |
164 |
524 |
|||
liquefaction capacity by ~49 mtpa |
|
8 |
|
|
||||||
|
38 |
27 |
677 |
|
|
|||||
|
|
|
|
2,681 |
||||||
|
|
|
|
|
|
|
|
|
||
|
|
|
|
|
|
|
|
|
|
|
• Two new countries joined the |
|
|
|
20 |
|
LNG importing club (Panama |
|
|
232 |
457 |
95 |
and Bangladesh) and global |
0-30 bcm |
180 |
|
||
Africa |
Asia Pacific |
|
|||
regasification capacity increased |
31-80 bcm |
|
|||
Latin America |
|
||||
by ~28 mtpa |
81-150 bcm |
|
|
|
|
>150 bcm |
|
|
|
|
|
|
|
|
|
|
•In H1 2019, the LNG industry has already registered an alltime high volume of liquefaction projects taking FID (4 projects, ~43 mtpa)
HH benchmark price |
TTF benchmark price |
JKM benchmark price |
|
|||
July 2018: 2.83 |
$/MMBtu1 |
July 2018: 7.62 |
$/MMBtu |
July 2018: 8.15 |
$/MMBtu |
|
July 2019: 2.36 |
$/MMBtu |
July 2019: 3.58 |
$/MMBtu |
July 2019: 4.65 |
$/MMBtu |
2017 |
|
|
|
|
|
|
|
1 Million British thermal units Source: ABB Energy Velocity; BP Statistical Review; Energy Insights’ LNGFlow; NDRC; press search
3,795
432
637
2,726
2018
Executive summary |
Recap 2018–H1 2019 |
Gas demand outlook Gas supply outlook |
Infrastructure |
LNG outlook |
Business model |
5 |
vk.com/id446425943 |
|
|
|
|
|
|
|
|
|
|
|
|
|
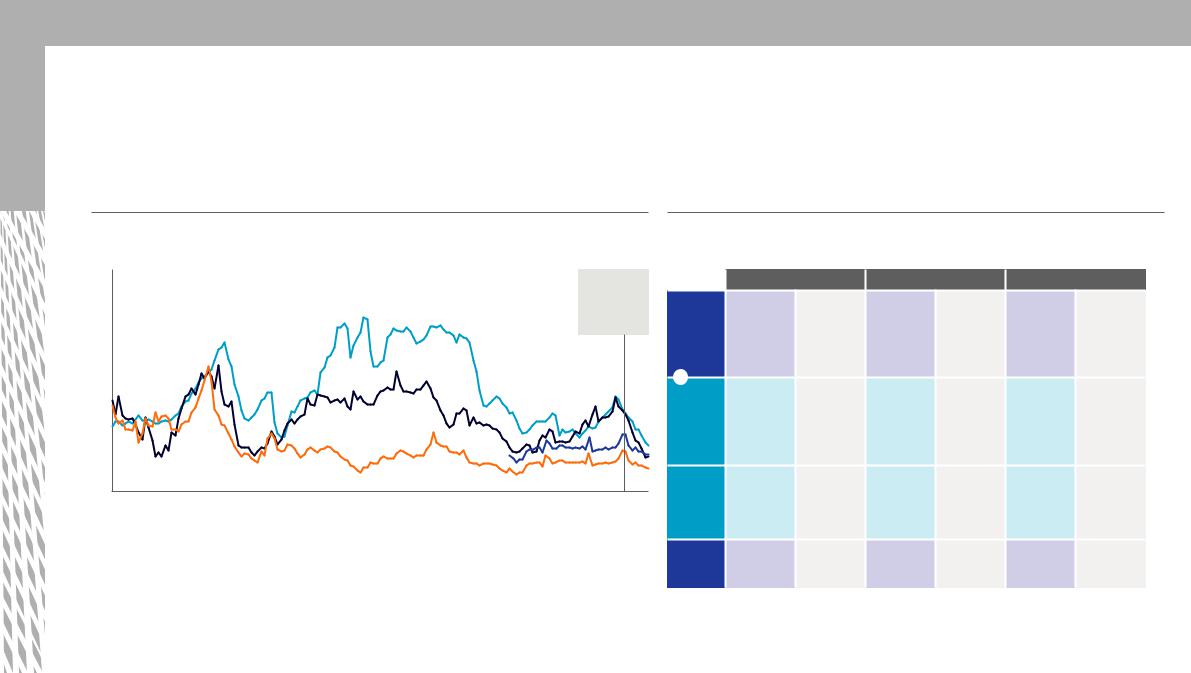
A Asia is the main destination for LNG flows; global share of spot and short-term cargoes represents ~35%
•The LNG market continued its expansion with a notable 14% year-over-year growth between August 2018-July 2019
•LNG market growth has been supply-led with the United States growing ~60%, Australia growing ~23%, and Russian LNG nearly doubling
•Demand growth has been driven by Europe (~81% growth), China, and South Asia (20 -26% growth), while JKT remained nearly flat and the Middle East contracted by ~20%
•Average LNG shipping tonne mile increased by ~14% as cargoes moved over long distances from the United States and the Middle East to Asian markets
•~20 mtpa out of 41 mtpa of LNG volume contracted had duration longer than 20 years
Actual LNG demand flow
Aug 2018 to Jul 2019, bcm
Africa  Europe
60 |
85 |
Europe and
Norway 7  Americas
24
North America
38  Iberia
South America 25
23
Middle East
9
Middle East
134
North Asia
189
Oceania
117
South Asia
67
South Asia
68
Russia |
China |
36  82
82
Source: Energy Insights by McKinsey
Global average utilization
Jan 2018 to Jun 2019, %
Liquefaction
85%
Regasification
38%
Liquidity
Jan 2018 to Jun 2019, % of spot and short-term trade
35%
Executive summary |
Recap 2018–H1 2019 |
Gas demand outlook Gas supply outlook |
Infrastructure |
LNG outlook |
Business model |
6 |
vk.com/id446425943 |
|
|
|
|
|
|
|
|
|
|
|
|
|
A Global LNG price indicators have converged in H1 2019; short-term prices will reflect cash costs while long-term Asia (baseload) prices may reflect US full costs
LNG price by market |
|
|
|
|
|
|
|
|
Price economics logic |
$/MMBtu |
|
JKM |
|
TTF |
|
Henry Hub |
|
US FOB Index1 |
$/MMBtu1 |
|
|
|
|
22 |
|
|
|
|
|
|
|
|
|
|
|
|
2019 YTD3 |
|
20 |
|
|
|
|
|
|
|
|
|
|
|
|
||
|
|
|
|
|
|
|
|
|
|
|
|
Supply glut |
||
18 |
|
|
|
|
|
|
|
|
|
|
|
|
and price |
|
|
|
|
|
|
|
|
|
|
|
|
|
convergence |
||
16 |
|
|
|
|
|
|
|
|
|
|
|
|
||
|
|
|
|
|
|
|
|
|
|
|
|
|
|
|
14 |
|
|
|
|
|
|
|
|
|
|
|
|
|
|
12 |
|
|
|
|
|
|
|
|
|
|
|
|
|
|
10 |
|
|
|
|
|
|
|
|
|
|
|
|
|
|
8 |
|
|
|
|
|
|
|
|
|
|
|
|
|
|
6 |
|
|
|
|
|
|
|
|
|
|
|
|
|
|
4 |
|
|
|
|
|
|
|
|
|
|
|
|
|
|
2 |
|
|
|
|
|
|
|
|
|
|
|
|
|
|
0 |
2006 |
07 |
08 |
09 |
10 |
11 |
12 |
13 |
14 |
15 |
16 |
17 |
18 |
19 |
2006 to 2009 |
|
2010 to 2014 |
|
2015 to 2018 |
LNG short bonanza |
|
Great dislocations, growth of flexibility, |
|
Portfolio players, proliferation |
|
|
and increase in liquidity |
|
and sophistication of non- |
|
|
|
|
traditional buyers, and US |
|
|
|
|
as source of supply |
|
|
|
|
|
|
Residual cash costs2 |
Cash cost |
|
Full cost |
|
||
Henry |
Base |
|
Base |
|
Base |
Abundant |
|
Hub |
|
|
|
|
|
supply |
|
(price |
|
|
|
|
|
drives gas |
|
setter) |
|
|
|
|
|
towards coal |
|
|
|
|
|
|
|
competition |
|
+ |
|
|
|
|
|
pricing |
|
0.4–0.5 |
Tolling ToP |
+0.8 |
LNG cash |
+2.2–2.7 |
LNG full |
||
|
|||||||
Liquefi- |
|
fixed fee |
|
cost in |
|
costs in a |
|
cation |
|
|
|
short-term |
|
balanced |
|
cost |
|
|
|
oversupplied |
|
market |
|
|
|
|
|
market |
|
(opex and |
|
|
|
|
|
(opex) |
|
capex) |
|
Shipping |
+0.5 |
Bunker fuel/ |
+1.7 |
Short-term |
+1.8–2.2 |
Full cost |
|
cost |
|
boil off only |
|
charter rates |
|
shipping |
|
|
|
|
|
|
|
(opex and |
|
|
|
|
|
|
|
capex) to |
|
|
|
|
|
|
|
Tokyo Bay |
|
Delivered |
Base |
Near-term |
Base |
Short-term |
Base |
Full cost |
|
LNG to |
+0.9-1.0 |
cash costs |
+2.5 |
cash costs |
+ 4–5 |
|
|
Asia |
|
|
|
|
|
|
|
1 US long-term LNG contracts FOB price. The formula is 115% HH+1.1$/MMBtu 2 Costs that are variable in the very short term 3 Until July 2019
Source: Energy Insights by McKinsey, BP Statistical Review of World Energy, EIA, Japan Ministry of Economy Trade and Industry, IGU Wholesale Gas Price Survey
Executive summary Recap 2018–H1 2019 Gas demand outlook Gas supply outlook |
Infrastructure |
LNG outlook |
Business model |
7 |
vk.com/id446425943 |
|
|
|
|
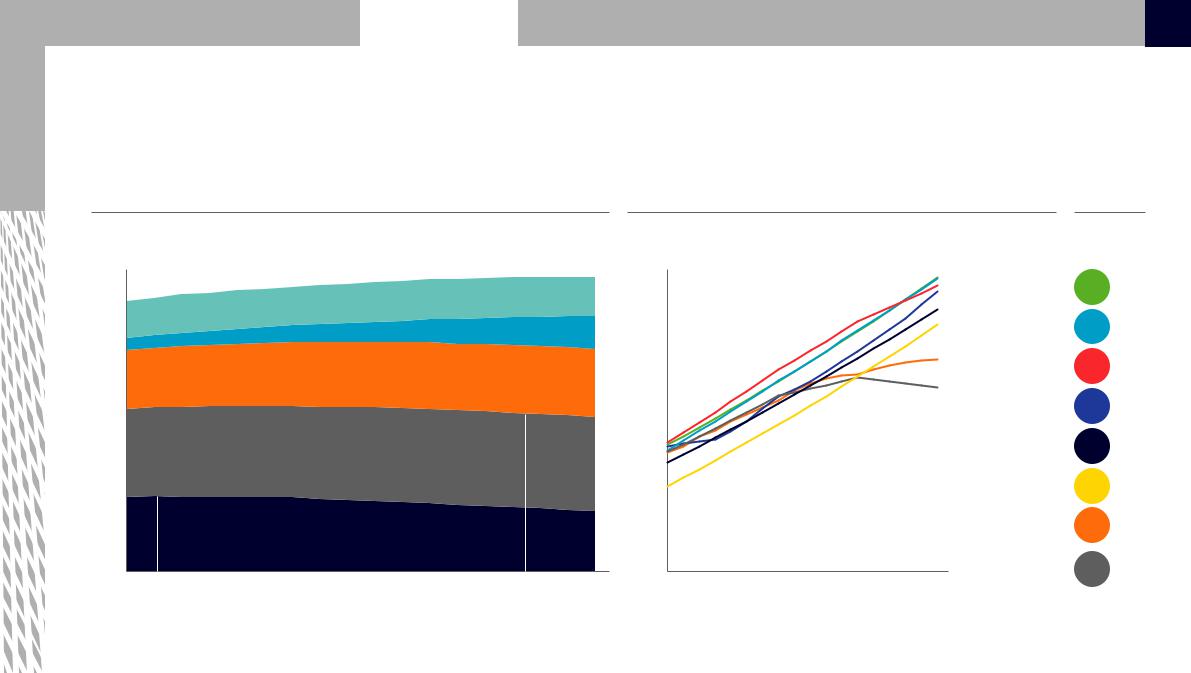
B Gas is the only fossil fuel that is expected to grow through 2035
Global primary energy demand per fuel |
|
|
|
|
|
Projected gas demand |
CAGR |
||||
Million terajoules |
|
Other1 |
|
Renewables |
|
Natural gas |
|
Oil |
|
Coal bcm |
2018–35, % |
|
|
|
|
|
|||||||
650 |
|
|
|
|
5,000 |
|
|
|
|
|
|
|
|
|
BP |
1.5% |
600 |
|
|
|
|
|
|
|
|
|
|
|
|
|
|
||
|
|
|
|
|
|
|
|
|
|
|
|
|
|
IEA – New |
|
|
550 |
|
|
|
|
|
|
|
|
|
|
|
|
|
|
1.6% |
|
|
|
|
|
|
|
|
|
|
|
|
|
|
|
Policies |
||
500 |
|
|
|
|
|
|
|
|
|
|
|
|
|
|
||
|
|
|
|
4,500 |
|
|
|
|
|
|
|
|
|
Scenario |
|
|
|
|
|
|
|
|
|
|
|
|
|
|
|
|
|
|
|
450 |
|
|
|
|
|
|
|
|
|
|
|
|
|
|
Exxon |
1.4% |
400 |
|
|
|
|
|
|
|
|
|
|
|
|
|
|
|
|
350 |
|
|
|
|
4,000 |
|
|
|
|
|
|
|
|
|
EIA |
1.4% |
|
|
|
|
|
|
|
|
|
|
|
|
|
|
|
||
300 |
|
|
|
Oil |
|
|
|
|
|
|
|
|
|
|
|
|
|
|
|
|
|
|
|
|
|
|
|
|
|
|
|
||
|
|
|
peaks |
|
|
|
|
|
|
|
|
|
|
Cedigaz |
1.4% |
|
250 |
|
|
|
|
|
|
|
|
|
|
|
|
|
|||
|
|
|
2033 |
|
|
|
|
|
|
|
|
|
|
|
|
|
|
|
|
|
|
|
|
|
|
|
|
|
|
|
|
|
|
200 |
|
|
|
|
|
|
|
|
|
|
|
|
|
|
Shell |
1.6% |
150 |
|
|
|
|
3,500 |
|
|
|
|
|
|
|
|
|
||
|
|
|
|
|
|
|
|
|
|
|
|
|
|
|
||
Coal |
|
|
|
|
|
|
|
|
|
|
|
|
|
McKinsey |
|
|
100 |
|
|
|
|
|
|
|
|
|
|
|
|
|
0.9% |
||
peaks |
|
|
|
|
|
|
|
|
|
|
|
|
|
(H1 2019) |
||
50 |
2019 |
|
|
|
|
|
|
|
|
|
|
|
|
|
IEA – Sustainable |
|
0 |
2020 |
2025 |
2030 |
2035 |
3,000 |
20 |
22 |
24 |
26 |
28 |
30 |
32 |
24 |
2036 |
Development |
0.6% |
2018 |
2018 |
Scenario |
|
1 Includes nuclear and biomass
Source: BP Energy Outlook 2019, EIA Internation Energy Outlook 2018, IEA World Energy Outlook 2018, Energy Insights by McKinsey 2019; Shell LNG Outlook 2019; Exxon Outlook for Energy 2018

Executive summary Recap 2018–H1 2019 |
Gas demand outlook |
Gas supply outlook |
Infrastructure |
LNG outlook |
Business model |
8 |
vk.com/id446425943 |
|
|
|
|
|
|
|
|
|
|
|
|
|
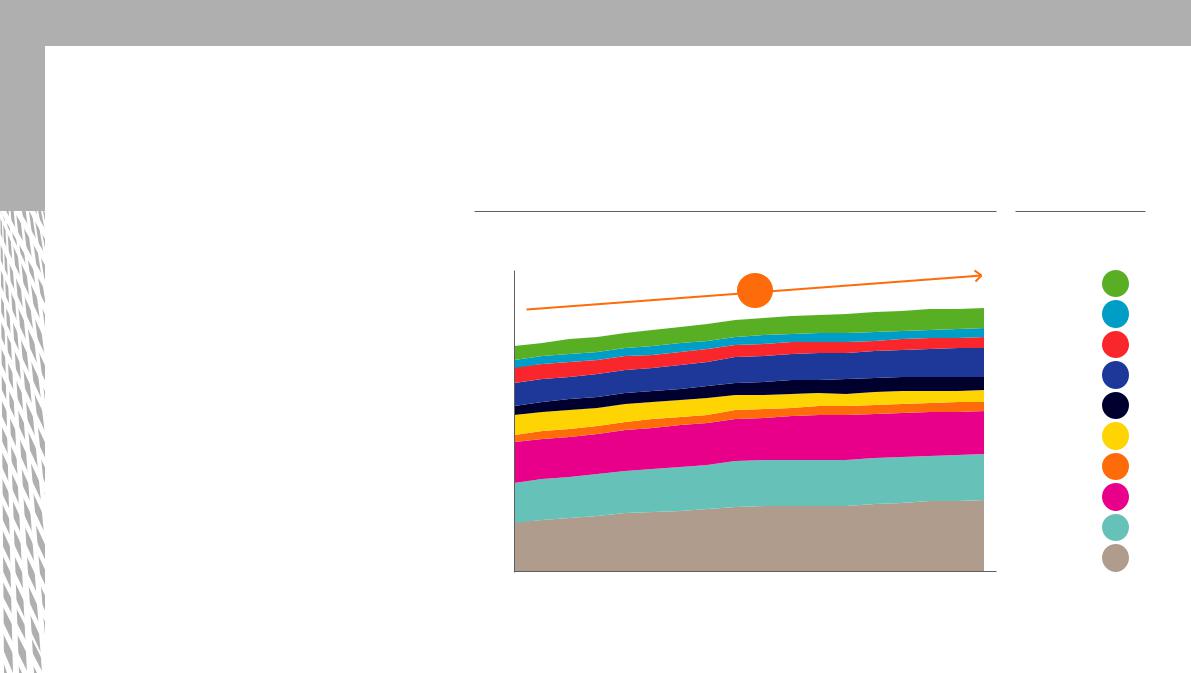
B Global gas demand expected to grow at 0.9% p.a. between 2018-35 driven by many regions’ power/gas-intensive industry and China’s residential/commercial sectors
1Geographically, China represents ~40% of total global demand growth to 2035, while North America, South Asia, and ASEAN represent another ~40% of global gas demand growth
2Gas demand growth in the power and gas–intensive industry sectors represents ~70% of total global growth; China residential accounts for additional ~65 bcm
•Power growth is driven by rapid electricity demand growth in China, ASEAN, Africa, and North America
•Strong industrial demand growth in China, the Middle East, and North America is driven by gas-intensive industries (e.g., petrochemicals) taking advantage of accessible and competitive gas supplies
•Growth in residential and commercial sectors in China is driven by a government push from coal- to-gas conversion for residential end-usage
Global gas demand by sector and region between 2018 and 2035 |
|
Key growth segments 2018 2035 |
||||||||
bcm |
|
∆>200 bcm |
|
∆ 50–200 bcm |
|
∆ 25–50 bcm |
|
∆ 0–25 bcm |
|
∆ <0 bcm |
|
|
|
|
|
||||||
|
|
|
|
|
||||||
|
1 |
|
1 |
|
1 |
|
|
|
Central |
1 |
|
|
|
|
|
|
|
|
|
|
|
|
|
|
|
||
|
|
|
South |
Middle |
ASEAN |
|
|
Latin |
Asia and |
North |
|
|
|
|
China1 |
JKT |
Asia |
East |
& Pacific |
Europe |
Africa |
America |
Russia |
America |
Total |
CAGR2 |
|
Power |
|
|
|
|
|
|
|
|
|
|
1,509 |
0.5% |
|
|
|
|
|
|
|
|
|
|
|
1,644 |
|||
2 |
|
|
|
|
|
|
|
|
|
|
|
||
|
|
|
|
|
|
|
|
|
|
961 |
|
||
Industry |
|
|
|
|
|
|
|
|
|
|
1.7% |
||
|
|
|
|
|
|
|
|
|
|
1,274 |
|||
|
|
|
|
|
|
|
|
|
|
|
|
||
Rescom3 |
|
|
|
|
|
|
|
|
|
|
818 |
0.5% |
|
|
|
|
|
|
|
|
|
|
|
889 |
|||
|
|
|
|
|
|
|
|
|
|
|
|
||
Transport |
|
|
|
|
|
|
|
|
|
|
56 |
3.9% |
|
|
|
|
|
|
|
|
|
|
|
118 |
|||
|
|
|
|
|
|
|
|
|
|
|
|
||
Other |
|
|
|
|
|
|
|
|
|
|
452 |
0.6% |
|
|
|
|
|
|
|
|
|
|
|
505 |
|||
|
|
|
|
|
|
|
|
|
|
|
|
||
Total |
287 |
200 |
130 |
553 |
209 |
570 |
144 |
225 |
562 |
915 |
3,795 |
0.9% |
|
551 |
179 |
195 |
559 |
276 |
544 |
205 |
283 |
590 |
1,048 |
4,430 |
|||
|
|
||||||||||||
CAGR |
3.9% |
-0.5% |
2.4% |
0.3% |
1.4% |
-0.4% |
2.0% |
0.5% |
0.3% |
0.8% |
0.9% |
|
1 Includes Hong Kong 2 Compound annual growth rate 2018–35 3 Household and commercial gas demand Source: Energy Insights by McKinsey
Executive summary Recap 2018–H1 2019 Gas demand outlook |
Gas supply outlook |
Infrastructure |
LNG outlook |
Business model |
9 |
vk.com/id446425943 |
|
|
|
|
|
|
|
|
|
|
|
C Global gas supply growth is expected to be driven primarily by the United States (+380 bcm) as well as Russia (+110 bcm) and Africa (+110 bcm)
•The main drivers are the United States, Africa, Russia, and China
•In addition to unconventional gas expansion, China will double its conventional gas production from 2018 to 2035
•Shale gas production growth in the US will continue, helping the US join Qatar and Australia as the top global LNG exporters
•Russia will further increase its role as a key supplier to gas-scarce Europe and China
•Production in Europe and Rest of Asia will decline rapidly as fields mature
Global gas supply by region to 20351 |
|
|
||
bcm |
|
|
|
|
5,000 |
|
|
0.9% |
|
|
|
|
|
|
4,500 |
|
|
p.a. |
|
|
|
|
|
|
4,000 |
|
|
|
|
3,500 |
|
|
|
|
3,000 |
|
|
|
|
2,500 |
|
|
|
|
2,000 |
|
|
|
|
1,500 |
|
|
|
|
1,000 |
|
|
|
|
500 |
|
|
|
|
0 |
2020 |
2025 |
2030 |
2035 |
2018 |
||||
Growth in gas supply
2018–35, bcm
Africa |
112 |
Australia |
15 |
Europe2 |
(86) |
RoW3 |
106 |
China |
70 |
Rest of Asia |
(127) |
Latin America |
29 |
Middle East |
30 |
Russia |
110 |
United States |
380 |
1 Assuming the LNG market oversupply gap in the shortto medium-term will be evenly filled by LNG supply and demand
2 Including Norway 3 Rest of World Source: Energy Insights by McKinsey; Energy Insights Gas Intelligence Model; IHS Vantage
Executive summary Recap 2018–H1 2019 Gas demand outlook |
Gas supply outlook |
Infrastructure |
LNG outlook |
Business model |
10 |
vk.com/id446425943 |
|
|
|
|
|
|
|
|
|
|
|
C The share of LNG in global gas trade will grow from 11% to 18% by 2035
LNG imports
•Domestic supplies face growth limitations (e.g., China, Western Europe)
•LNG is more cost competitive than piped gas over long distance (e.g., Thailand)
Pipe imports
•Russian exports growth to Europe (modest) and China (strong)
•US exports to Mexico
Domestically produced and consumed
•Gradual decline in Europe
•Strong growth in the US
2018–35 gas consumption breakdown per delivery mechanism |
|
CAGR |
|||||||||||||
% |
|
|
|
|
LNG flows |
|
Pipeline flows |
|
Gas consumed where produced 2018–35, % |
||||||
|
|
|
|
|
|
||||||||||
|
|
|
|
|
|
+0.9% |
|
|
|
|
|
4,430 |
|
||
|
|
|
|
|
|
|
|
|
|
|
|
||||
|
|
|
|
|
|
|
|
|
|
|
18% |
|
|||
|
|
|
|
|
|
p.a. |
|
|
|
|
|
|
|||
|
|
|
|
|
|
4,054 |
|
|
|
|
|
|
3.6% |
||
|
|
|
|
|
|
|
|
|
|
|
|
||||
3,795 |
|
|
|
|
13% |
|
|
|
|
|
|
||||
|
|
|
|
|
|
|
|
|
|
|
|||||
|
|
|
|
|
|
|
|
|
|
|
|
|
|
||
|
|
|
|
|
|
|
|
|
|
|
|
|
|
||
|
11% |
|
|
|
|
|
|
|
|
|
|
|
|
|
|
|
|
|
|
|
|
|
|
|
|
|
|
|
|
15% |
|
|
|
|
|
|
|
17% |
|
|
|
|
|
|
|
||
|
17% |
|
|
|
|
|
|
|
|
|
|
|
|
|
0.3% |
|
|
|
|
|
|
|
|
|
|
|
|
|
|
|
|
|
|
|
|
|
|
|
|
|
|
|
|
|
|
67% |
|
|
|
|
|
|
|
69% |
|
|
|
|
|
|
0.5% |
||
|
72% |
|
|
|
|
|
|
|
|
|
|
||||
|
|
|
|
|
|
|
|
|
|
|
|
|
|
|
|
|
|
|
|
|
|
|
|
|
|
|
|
|
|
|
|
2018 |
2018–23 additional |
2023 |
2023–35 additional |
2035 |
|
||||||||||
|
|
gas consumption |
|
|
|
gas consumption |
|
|
|||||||
Source: Energy Insights by McKinsey