

MailYandex-230119(2)_watermark
.pdfvk.com/id446425943
Renaissance Capital
23 January 2019
Media
integration with VK give it advantages. Consolidation similar to Yandex.Taxi/Uber cannot be ruled out either, in our view.
Figure 27: Delivery Club’s revenue has been growing fast but profitability is unlikely in the near-term due to competition from Yandex
1,200 |
|
|
|
Revenue, RUBmn |
|
|
|
|
|
growth, % |
|
|
|
|
|
|
60% |
|||
|
|
|
|
|
|
|
|
|
|
|
|
|
|
|||||||
|
|
|
|
|
|
|
|
|
|
|
|
|
|
|
|
|
|
|
||
|
|
|
|
|
|
|
|
|
|
|
|
|
|
|
|
|
|
|
||
1,000 |
|
|
|
|
|
|
|
|
|
|
|
|
|
|
|
|
|
|
|
50% |
|
|
|
|
|
|
|
|
|
|
|
|
|
|
|
|
|
|
|
||
|
|
|
|
|
|
|
|
|
|
|
|
|
|
|
|
|
|
|
||
800 |
|
|
|
|
|
|
|
|
|
|
|
|
|
|
|
|
|
|
|
40% |
|
|
|
|
|
|
|
|
|
|
|
|
|
|
|
|
|
|
|
||
600 |
|
|
|
|
|
|
|
|
|
|
|
|
|
|
|
|
|
|
|
30% |
|
|
|
|
|
|
|
|
|
|
|
|
|
|
|
|
|
|
|
||
|
|
|
|
|
|
|
|
|
|
|
|
|
|
|
|
|
|
|
||
400 |
|
|
|
|
|
|
|
|
|
|
|
|
|
|
|
|
|
|
|
20% |
|
|
|
|
|
|
|
|
|
|
|
|
|
|
|
|
|
|
|
||
|
|
|
|
|
|
|
|
|
|
|
|
|
|
|
|
|
|
|
||
|
|
|
|
|
|
|
|
|
|
|
|
|
|
|
|
|
|
|
||
200 |
|
|
|
|
|
|
|
|
|
|
|
|
|
|
|
|
|
|
|
10% |
|
|
|
|
|
|
|
|
|
|
|
|
|
|
|
|
|
|
|
||
0 |
|
|
|
|
|
|
|
|
|
|
|
|
|
|
|
|
|
|
|
0% |
|
|
|
|
|
|
|
|
|
|
|
|
|
|
|
|
|
|
|
||
|
1Q17 |
2Q17 |
3Q17 |
4Q17 |
1Q18 |
|
2Q18 |
3Q18 |
4Q18E |
|||||||||||
Source: Company data
Figure 28: Delivery Club is the most popular online restaurant delivery service on mobile but Yandex.Foods is making progress (Android DAU
in Russia, ‘000s)…
|
Delivery Club |
|
ZakaZaka |
|
Yakitoria |
||
|
Tanuki |
|
|
Papa Johns |
|
2 Berega |
|
60.0 |
Eda.Yandex |
|
|
|
|
|
|
|
|
|
|
|
|
|
|
50.0 |
|
|
|
|
|
|
|
40.0 |
|
|
|
|
|
|
|
30.0 |
|
|
|
|
|
|
|
20.0 |
|
|
|
|
|
|
|
10.0 |
|
|
|
|
|
|
|
0.0 |
|
|
|
|
|
|
|
Jan-17 |
Apr-17 |
Jul-17 |
Oct-17 |
Jan-18 |
Apr-18 |
Jul-18 |
Oct-18 |
Figure 29: …and the same is true for web traffic (desktop + mobile web, monthly visits, mn)
|
Delivery Club |
ZakaZaka |
|
Yakitoria |
||
|
Tanuki |
|
Papa Johns |
|
2 Berega |
|
|
Dodo Pizza |
Eda.Yandex |
|
|
||
3.5 |
|
|
|
|
|
|
3.0 |
|
|
|
|
|
|
2.5 |
|
|
|
|
|
|
2.0 |
|
|
|
|
|
|
1.5 |
|
|
|
|
|
|
1.0 |
|
|
|
|
|
|
0.5 |
|
|
|
|
|
|
0.0 |
|
|
|
|
|
|
Sep-16 |
Jan-17 |
May-17 |
Sep-17 |
Jan-18 |
May-18 |
Sep-18 |
Source: SimilarWeb |
Source: SimilarWeb |
Figure 30: Increased competition is likely to lead to faster market growth and higher long-term revenue opportunity
Total food delivery market
Others |
Food delivery |
Others |
Delivery Club |
|
40% |
||||
RUB 75bn |
aggregation |
|||
60% |
||||
|
||||
|
RUB 25bn |
|
||
|
|
|
Note: Estimates for 2018.
Source: Press reports, Renaissance Capital estimates
11

vk.com/id446425943
Figure 31: In the more mature US market leader GrubHub has a c. 50% share, a decline from 60% in 2017
US online food delivery market shares
70% |
|
|
|
|
|
|
|
GrubHub |
|
UberEats |
DoorDash |
Postmates |
|
Caviar |
Amazon |
60% |
|
|
|
|
|
|
|
|
|
|
|
|
|
|
50% |
50% |
|
|
|
|
|
|
|
40% |
|
|
|
|
|
|
|
30% |
|
|
|
|
|
|
|
|
|
|
|
|
|
|
21% |
20% |
|
|
|
|
|
|
15% |
|
|
|
|
|
|
|
|
10% |
|
|
|
|
|
|
9% |
|
|
|
|
|
|
4% |
|
|
|
|
|
|
|
|
|
0% |
|
|
|
|
|
|
1% |
|
|
|
|
|
|
|
|
Aug |
Sep |
Oct |
Nov |
Dec |
Jan |
Feb |
March |
Source: Second Measure
Figure 32: UK and US markets show that an online food delivery business can potentially generate a 30-40%
EBITDA margin at a mature stage
 Just Eat UK
  GrubHub
60%
50%
40%
30%
20%
10%
0%
2011 |
2012 |
2013 |
2014 |
2015 |
2016 |
2017 |
Source: Company data
AliExpress is the dominant platform in cross-border e-commerce
Russian e-commerce market growing fast and share of cross-border segment continues to increase
In 2018, the Russian e-commerce market grew 20% YoY to RUB1.25trn. With online retail penetration still only at around 5%, the medium-term growth outlook is good (Euromonitor forecasts an 18.5% CAGR 2018-23E). Within that, the cross-border segment has outperformed, with its share up from 15% in 2011 to 38% in 2018, equivalent to RUB470bn. China accounted for 91% / 53% of the cross-border e-commerce in terms of parcels / value last year, and we believe the bulk of that came via AliExpress, implying c. $3bn gross merchandise volume (GMV) in 2018.
Renaissance Capital
23 January 2019
Media
12

vk.com/id446425943
|
|
Renaissance Capital |
|
|
23 January 2019 |
|
|
Media |
|
|
|
Figure 33: Russian e-commerce is forecast to grow at 19% per annum |
Figure 34: Cross-border segment has outperformed, with its share reaching 38% |
|
|
in 2018 |
|
|
Ecommerce market, RUBbn |
|
|
|
Growth, % |
3,500 |
|
|
|
|
|
40% |
500 |
3,000 |
|
|
|
|
|
35% |
450 |
2,500 |
|
|
|
|
|
30% |
400 |
|
|
|
|
|
|
350 |
|
|
|
|
|
|
|
25% |
|
2,000 |
|
|
|
|
|
|
300 |
1,500 |
|
|
|
|
|
20% |
250 |
|
|
|
|
|
15% |
200 |
|
|
|
|
|
|
|
||
1,000 |
|
|
|
|
|
10% |
150 |
500 |
|
|
|
|
|
|
100 |
|
|
|
|
|
5% |
50 |
|
|
|
|
|
|
|
||
|
|
|
|
|
|
|
|
0 |
|
|
|
|
|
0% |
0 |
2010 |
2012 |
2014 |
2016 |
2018E |
2020E |
2022E |
|
Russian cross-border ecommerce market, RUBbn |
|
Growth, % |
||||||
|
|
|
|
|
|
|
|
160% |
|
|
|
|
|
|
|
|
140% |
|
|
|
|
|
|
|
|
120% |
|
|
|
|
|
|
|
|
100% |
|
|
|
|
|
|
|
|
80% |
|
|
|
|
|
|
|
|
60% |
|
|
|
|
|
|
|
|
40% |
|
|
|
|
|
|
|
|
20% |
|
|
|
|
|
|
|
|
0% |
2010 |
2011 |
2012 |
2013 |
2014 |
2015 |
2016 |
2017 |
2018E |
Note: AKIT is a source for actual |
|
Source: AKIT, Euromonitor |
Source: AKIT |
Figure 35: China is the key market for Russian cross-border e-commerce |
Figure 36: …and value |
|
|||
in terms of both volumes… |
|
|
|
|
|
Cross-border parcel distribution, 2017 |
|
Cross-border spending distribution, 2017 |
|
||
EU |
USA |
Other |
|
|
|
3% |
2% |
4% |
|
|
|
|
|
|
USA |
Other |
|
|
|
|
12% |
|
|
|
|
|
13% |
|
|
|
|
|
|
|
|
|
|
|
|
|
China |
|
|
China |
|
EU |
53% |
|
|
91% |
|
22% |
|
Source: AKIT |
Source: AKIT |
AliExpress’ market position is strong, with further support likely from integration into VK
Given the size of the China-Russia cross-border e-commerce market, AliExpress is unsurprisingly the largest e-commerce platform in Russia, with a significant lead in popularity vs competitors. With most peers including Yandex.Market, Beru and Ozon quite different in terms of their offering, AliExpress’ dominant position in the cross-border segment seems secure to us. The deal with Mail (which contributes Pandao and c. $100150mn cash in exchange for a 15% stake in AliExpress Russia) is expected to close in
1Q19 and we think the platform’s integration into VK could strengthen its position.
Assuming a GMV multiple of 1.0x (which could be conservative), we estimate AliExpress Russia’s valuation at c. $3bn for 100% or $450mn for Mail’s stake, with material upside on a three-to-five year view.
13

vk.com/id446425943
Figure 37: AliExpress’ app is significantly ahead of peers’ by usage in Russia
(Android DAU, ‘000s)…
Pandao |
|
Yandex Market |
|
AliExpress |
|
|
|||
Ozon.ru |
|
Lamoda.ru |
|
Beru |
|
|
Renaissance Capital
23 January 2019
Media
Figure 38: …and it is also popular on the web (monthly unique website visitors in Russia, mn)
Pandao |
|
Yandex Market |
|
AliExpress |
|
|
|||
Ozon.ru |
|
Lamoda.ru |
|
Beru |
|
|
4,000 |
|
|
|
|
|
|
70.0 |
|
|
|
|
|
3,500 |
|
|
|
|
|
|
60.0 |
|
|
|
|
|
3,000 |
|
|
|
|
|
|
50.0 |
|
|
|
|
|
|
|
|
|
|
|
|
|
|
|
|
|
|
2,500 |
|
|
|
|
|
|
40.0 |
|
|
|
|
|
|
|
|
|
|
|
|
|
|
|
|
|
|
2,000 |
|
|
|
|
|
|
|
|
|
|
|
|
1,500 |
|
|
|
|
|
|
30.0 |
|
|
|
|
|
|
|
|
|
|
|
|
|
|
|
|
|
|
1,000 |
|
|
|
|
|
|
20.0 |
|
|
|
|
|
|
|
|
|
|
|
|
|
|
|
|
|
|
500 |
|
|
|
|
|
|
10.0 |
|
|
|
|
|
|
|
|
|
|
|
|
|
|
|
|
|
|
0 |
|
|
|
|
|
|
0.0 |
|
|
|
|
|
Jun-17 |
Sep-17 |
Dec-17 |
Mar-18 |
Jun-18 |
Sep-18 |
Dec-18 |
Mar-17 |
Jun-17 |
Sep-17 |
Dec-17 |
Mar-18 |
Jun-18 Sep-18 Dec-18 |
|
|
|
|
|
Source: SimilarWeb |
|
|
|
|
|
Source: SimilarWeb |
|
We remain sceptical on the outlook for Youla and Citimobil but we were negative about Pandao and got that wrong
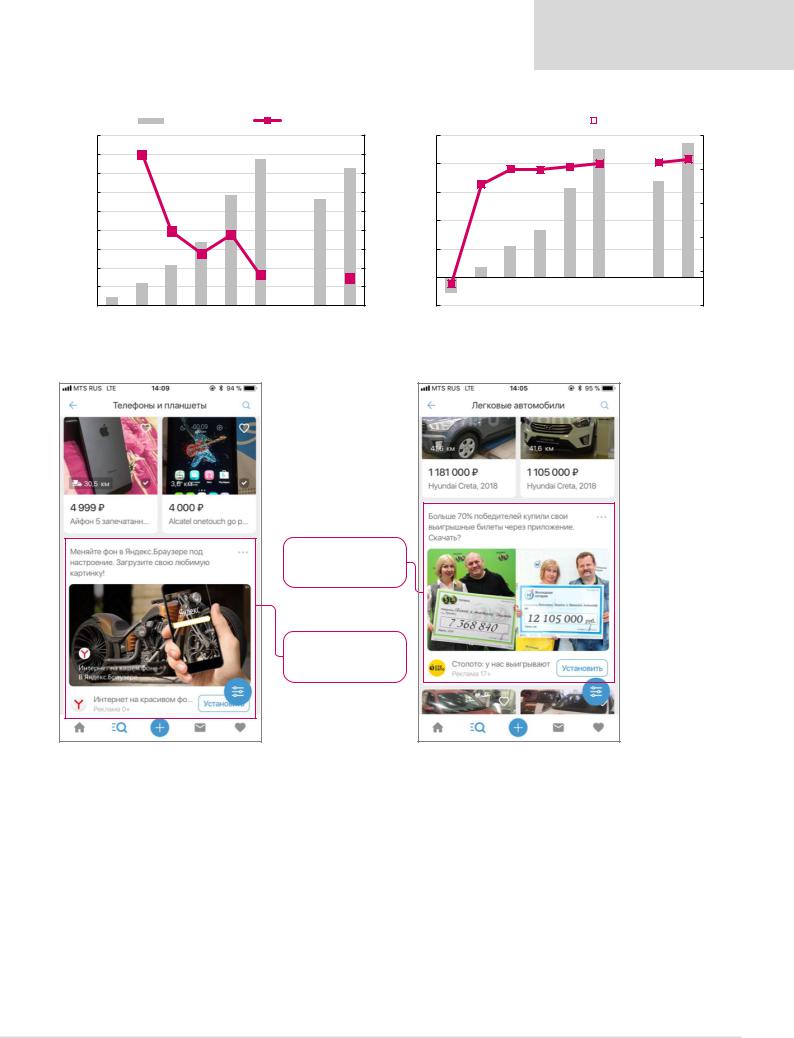
Youla remains very popular in Russia, helped by still quite aggressive marketing. However, we remain sceptical on its potential to considerably disrupt Avito’s (core shareholder Naspers) market leadership, with the latter’s financials still strong. We believe Mail has visibly increased Youla’s monetisation over the past six months, which may support the company’s near-term financials; however, unlike at Avito, Youla’s monetisation is largely via display ads (one ad in every eight listings), which could damage user experience and suggests the platform is not strong enough to be monetised via value-add-services and professional sellers.
We are also sceptical on Citimobil, in which Mail invested last year. Although it has gained popularity over the past nine months, it remains a small fraction of Yandex.Taxi in terms of usage (Figure 58).
That said, we were also quite sceptical on Pandao but Mail’s deal with AliExpress demonstrated that it can create value from its initiatives either organically or via M&A, and that it is helped by the power of its ecosystem with VK at the centre. We would be surprised if consolidation in some shape or form between Delivery Club, Youla, Avito, Naspers and Mail is not given consideration from time to time, at least by Mail’s management.
Figure 39: Youla’s popularity has been growing fast (Android DAU in |
Figure 40: …as has time online |
Russia, 000s)… |
|
Avito |
Youla |
|
|
Average daily usage time, mm:ss |
||||
|
|
|
Avito |
Youla |
||||
3.0 |
|
36:00 |
|
|
||||
|
|
|
|
|
|
|||
2.5 |
|
28:48 |
|
|
|
|
|
|
|
|
|
|
|
|
|
||
2.0 |
|
|
|
|
|
|
|
|
|
|
21:36 |
|
|
|
|
|
|
1.5 |
|
|
|
|
|
|
|
|
1.0 |
|
14:24 |
|
|
|
|
|
|
|
|
|
|
|
|
|
||
0.5 |
|
07:12 |
|
|
|
|
|
|
0.0 |
|
00:00 |
|
|
|
|
|
|
Jun-17 Aug-17 Oct-17 Dec-17 Feb-18 Apr-18 Jun-18 Aug-18 Oct-18 Dec-18 |
|
|
|
|
|
|||
Apr-16 |
Aug-16 |
Dec-16 |
Apr-17 |
Aug-17 |
Dec-17 Apr-18 Aug-18 Dec-18 |
|||
|
|
|||||||
|
Source: SimilarWeb |
|
|
|
|
|
Source: SimilarWeb |
|
|
|
|
|
|
|
|
14 |
|
vk.com/id446425943
Renaissance Capital
23 January 2019
Media
Figure 41: However, this has not affected Avito’s financials, with 32% revenue |
Figure 42: …and a c. 65% EBITDA margin |
growth in 2017 and 29% in 9M18… |
|
|
|
Revenue, RUBmn |
|
Growth, % |
|
|
|
||
18,000 |
159% |
|
|
|
|
|
|
180% 10,000 |
|
|
|
|
|
|
|
|
|
|
|
16,000 |
|
|
|
|
|
|
|
160% |
8,000 |
14,000 |
|
|
|
|
|
|
|
140% |
|
|
|
|
|
|
|
|
|
||
12,000 |
|
|
|
|
|
|
|
120% |
6,000 |
10,000 |
|
79% |
|
75% |
|
|
|
100% |
4,000 |
|
|
|
|
|
|
|
|||
8,000 |
|
|
|
|
|
|
80% |
||
|
|
55% |
|
|
|
|
|
||
|
|
|
|
|
|
|
|
|
|
6,000 |
|
|
|
|
32% |
|
|
60% |
2,000 |
4,000 |
|
|
|
|
|
29% |
40% |
|
|
|
|
|
|
|
|
|
|||
|
|
|
|
|
|
|
0 |
||
2,000 |
|
|
|
|
|
|
|
20% |
|
|
|
|
|
|
|
|
|
||
0 |
|
|
|
|
|
|
|
0% |
-2,000 |
2012 |
2013 |
2014 |
2015 |
2016 |
2017 |
9M17 |
9M18 |
|
|
Source: Company data
|
Adj. EBITDA, RUBmn |
|
|
|
Adj. EBITDA margin, % |
|
|
|
|
|
|
|
|
|
|
|
65% |
100% |
|
|
51% |
|
54% |
58% |
60% |
|
|
|
|
49% |
|
|
||||
|
|
|
|
|
|
|||
|
28% |
|
|
|
|
|
|
50% |
|
|
|
|
|
|
|
|
0% |
|
|
|
|
|
|
|
|
-50% |
|
|
|
|
|
|
|
|
-100% |
-118% |
|
|
|
|
|
|
|
|
|
|
|
|
|
|
|
|
-150% |
2012 |
2013 |
2014 |
2015 |
2016 |
2017 |
9M17 |
9M18 |
|
Source: Company data
Figure 43: Youla is heavily monetised via display ads which do not seem to us to be well-targeted…
Lottery tickets advertisement in the Cars category
Yandex.Browser
advertisement
Source: Youla app, Renaissance Capital
15

vk.com/id446425943
Renaissance Capital
23 January 2019
Media
Figure 44: …while Avito’s ads appear relevant and are also monetised via VAS and professional sellers
An example of a promoted private listing which is larger and has a highlighted price tag
An advertisement of the official dealer of Audi in the Audi section of the Cars category
Source: Avito app, Renaissance Capital
O2O spin-off should help crystallise value
In 2019, Mail plans to form a new O2O and local services platform based around Delivery Club and Youla, which is likely to be spun off from the core. We think this platform could then attract external capital from both Mail’s existing shareholders, especially Alibaba,
Naspers and Tencent, and new domestic and international investors. For Mail, this could demonstrate material value creation in just three years, while also providing greater transparency around the financial profile of its core social network and gaming business, which is delivering c. 30% top-line growth and c. 40% EBITDA profitability, with meaningful upside to the latter in case of the games margin recovering.
Figure 45: The potential spin-off of O2O should remind investors that Mail’s core business is growing fast and is highly profitable, with upside assuming games’ margin recovery
|
Core revenue, RUBmn |
|
Core EBITDA, RUBmn |
|
|
|
Margin, % |
18,000 |
|
|
|
|
|
|
|
|
|
60.0% |
16,000 |
|
|
|
|
|
|
|
|
|
50.0% |
14,000 |
|
|
|
|
|
|
|
|
|
|
|
|
|
|
|
|
|
|
|
|
|
12,000 |
|
|
|
|
|
|
|
|
|
40.0% |
10,000 |
|
|
|
|
|
|
|
|
|
30.0% |
8,000 |
|
|
|
|
|
|
|
|
|
|
|
|
|
|
|
|
|
|
|
|
|
6,000 |
|
|
|
|
|
|
|
|
|
20.0% |
4,000 |
|
|
|
|
|
|
|
|
|
10.0% |
2,000 |
|
|
|
|
|
|
|
|
|
|
|
|
|
|
|
|
|
|
|
|
|
0 |
|
|
|
|
|
|
|
|
|
0.0% |
1Q16 |
2Q16 |
3Q16 |
4Q16 |
1Q17 |
2Q17 |
3Q17 |
4Q17 |
1Q18 |
2Q18 |
3Q18 |
Note: Core revenue and EBITDA are calculated as the sum of ‘Email, Portal and IM’, ‘Social Networks ex VK’, ‘VK’ and ‘Online games’ segments’ financials.
Source: Company data
16

vk.com/id446425943
Renaissance Capital
23 January 2019
Media
Financials and valuation
Our Mail Group TP is derived using a DCF methodology, with an 11% WACC and a 3% terminal growth rate. Downside risks to our forecasts include: slower-than-expected ad market dynamics; lower-than-anticipated monetisation of VK; lower-than-expected medium-term profitability of the games segment; a lack of new popular games in the medium term; the inability to sustain strong market positions in online food delivery and e-commerce; and management and shareholder structure instability.
Figure 46: Mail Group income statement, 2015-2021E, RUBmn (unless otherwise stated)
|
2015 |
2016 |
2017 |
2018E |
2019E |
2020E |
2021E |
Online advertisement |
14,632 |
18,442 |
23,766 |
31,191 |
39,588 |
48,112 |
56,852 |
Growth |
17% |
26% |
29% |
37% |
27% |
22% |
18% |
MMO games |
9,401 |
11,390 |
17,422 |
23,054 |
27,142 |
30,283 |
33,187 |
Growth |
12% |
21% |
53% |
32% |
18% |
12% |
10% |
Community IVAS |
12,505 |
11,854 |
13,946 |
14,079 |
14,702 |
15,424 |
16,215 |
Growth |
5% |
-5% |
18% |
4% |
4% |
5% |
5% |
Other (incl. Delivery Club) |
689 |
1,065 |
2,335 |
6,734 |
9,320 |
12,383 |
15,984 |
Total revenue |
37,227 |
42,751 |
57,469 |
75,058 |
90,752 |
106,202 |
122,238 |
Growth |
14% |
15% |
34% |
32% |
21% |
17% |
15% |
EBITDA |
18,086 |
17,913 |
20,551 |
20,786 |
26,776 |
34,939 |
42,840 |
EBITDA margin |
49% |
42% |
36% |
28% |
30% |
33% |
35% |
EBIT |
14,363 |
14,973 |
16,964 |
14,209 |
20,423 |
27,505 |
34,283 |
Operating margin |
39% |
35% |
30% |
19% |
23% |
26% |
28% |
Finance income |
613 |
205 |
302 |
507 |
1,260 |
1,955 |
2,770 |
Finance costs |
(2,351) |
(767) |
0 |
0 |
0 |
0 |
0 |
Share of profit/(loss) of equity method investees |
69 |
46 |
31 |
(598) |
(1,140) |
(531) |
0 |
Profit before tax |
12,597 |
15,089 |
17,448 |
14,254 |
20,544 |
28,929 |
37,054 |
Income tax expense |
(2,753) |
(3,473) |
(3,204) |
(3,045) |
(4,445) |
(6,039) |
(7,596) |
Tax rate |
19% |
22% |
18% |
21% |
21% |
21% |
21% |
Net profit |
9,844 |
11,616 |
14,244 |
11,210 |
16,099 |
22,890 |
29,458 |
Growth |
-14% |
18% |
23% |
-21% |
44% |
42% |
29% |
EPS diluted, RUB/GDR |
47 |
56 |
68 |
54 |
77 |
109 |
141 |
Source: Company data, Renaissance Capital estimates
|
2020E |
2021E |
2022E |
2023E |
2024E |
2025E |
2026E |
2027E |
2028E |
2029E |
Revenue |
1,550.4 |
1,732.5 |
1,900.8 |
2,041.1 |
2,162.4 |
2,268.5 |
2,367.3 |
2,456.9 |
2,550.9 |
2,673.9 |
Growth |
14.6% |
11.7% |
9.7% |
7.4% |
5.9% |
4.9% |
4.4% |
3.8% |
3.8% |
4.8% |
EBIT |
401.5 |
485.9 |
543.3 |
589.2 |
625.8 |
656.4 |
682.9 |
707.5 |
733.1 |
768.3 |
Growth |
31.9% |
21.0% |
11.8% |
8.4% |
6.2% |
4.9% |
4.0% |
3.6% |
3.6% |
4.8% |
Margin |
25.9% |
28.0% |
28.6% |
28.9% |
28.9% |
28.9% |
28.8% |
28.8% |
28.7% |
28.7% |
Tax rate |
20.5% |
20.5% |
20.5% |
20.5% |
20.5% |
20.5% |
20.5% |
20.5% |
20.5% |
20.5% |
Tax on EBIT |
(82.3) |
(99.6) |
(111.4) |
(120.8) |
(128.3) |
(134.6) |
(140.0) |
(145.0) |
(150.3) |
(157.5) |
EBIT after tax |
319.2 |
386.3 |
432.0 |
468.4 |
497.5 |
521.9 |
542.9 |
562.5 |
582.8 |
610.8 |
D&A |
139.2 |
157.2 |
173.9 |
187.5 |
198.7 |
207.9 |
216.1 |
223.4 |
231.1 |
240.8 |
Changes in working capital |
- |
- |
- |
- |
- |
- |
- |
- |
- |
- |
Capex |
(108.5) |
(121.3) |
(133.1) |
(142.9) |
(151.4) |
(158.8) |
(165.7) |
(172.0) |
(178.6) |
(187.2) |
% revenue |
7.0% |
7.0% |
7.0% |
7.0% |
7.0% |
7.0% |
7.0% |
7.0% |
7.0% |
7.0% |
Unleveraged free cash flow |
349.8 |
422.3 |
472.8 |
513.1 |
544.8 |
570.9 |
593.3 |
613.9 |
635.3 |
664.4 |
Growth |
31.0% |
20.7% |
12.0% |
8.5% |
6.2% |
4.8% |
3.9% |
3.5% |
3.5% |
4.6% |
Timing |
1 |
2 |
3 |
4 |
5 |
6 |
7 |
8 |
9 |
10 |
Discount factor |
90.1% |
81.2% |
73.1% |
65.9% |
59.3% |
53.5% |
48.2% |
43.4% |
39.1% |
35.2% |
NPV of cash flows |
315.2 |
342.7 |
345.7 |
338.0 |
323.3 |
305.3 |
285.7 |
266.4 |
248.4 |
234.0 |
|
|
|
|
|
|
|
|
|
|
|
Free cash flow in 2030 |
684.4 |
|
|
|
|
|
|
|
|
|
NPV of terminal value |
3,013 |
|
|
|
|
|
|
|
|
|
Total NPV of cash flows |
3,005 |
|
|
|
|
|
|
|
|
|
Net cash (end-2019E) |
399.4 |
|
|
|
|
|
|
|
|
|
Associates (AliExpress JV) |
405.0 |
|
|
|
|
|
|
|
|
|
MktCap |
6,822 |
|
|
|
|
|
|
|
|
|
Number of GDRs, mn |
220.1 |
|
|
|
|
|
|
|
|
|
Target price/GDR, $ |
31 |
|
|
|
|
|
|
|
|
|
Source: Renaissance Capita estimates
17
vk.com/id446425943
Yandex
Yandex has gone through the market transition to mobile with no significant share loss
Over the past few years, the Russian search market has undergone a rapid transition from desktop to mobile, with mobile accounting for the majority of searches last year. The share of mobile search continues to grow and is approaching 60%. Given Yandex’s historically weak position on mobile, we were concerned that the market’s transition to mobile could negatively impact its overall search share, leading to deteriorating monetisation and softer revenue trends.
However, a favourable FAS ruling and good work getting pre-installation deals with OEMs has led to a substantial improvement in Yandex’s search share on Android. We believe
Google still has a much better presence on home screens and smartphones generally, which is a consequence of: 1) the global nature of its relationships with manufacturers; and 2) its wider offering, with Chrome, Gmail, Maps and YouTube being very popular services in Russia. However, the mandatory requirement to give users a choice of search engine for the widget and even Chrome browser, regardless of which apps are preinstalled, has been a major game changer for Yandex on Android.
As a result, Yandex’s search of share on Android has increased materially over the past
18 months. According to Yandex’s own data, it is now in line with Google’s, while on
Liveinternet data Yandex is still well below Google with c. 35%. The truth is probably somewhere in between, but either way the takeaway is that Yandex has gone through the market transition to mobile without any material market share loss and is well positioned to maintain its overall leadership longer-term.
Figure 48: Share of mobile search exceeded that of desktop in 2018 and continues to grow
|
|
|
|
Desktop share |
|
Mobile share |
|
|
|
||
80% |
|
|
|
|
|
|
|
|
|
|
|
70% |
|
|
|
|
|
|
|
|
|
|
|
60% |
|
|
|
|
|
|
|
|
|
|
|
50% |
|
|
|
|
|
|
|
|
|
|
|
40% |
|
|
|
|
|
|
|
|
|
|
|
30% |
|
|
|
|
|
|
|
|
|
|
|
20% |
|
|
|
|
|
|
|
|
|
|
|
10% |
|
|
|
|
|
|
|
|
|
|
|
0% |
|
|
|
|
|
|
|
|
|
|
|
Jan-15 |
May-15 |
Sep-15 |
Jan-16 |
May-16 |
Sep-16 |
Jan-17 |
May-17 |
Sep-17 |
Jan-18 |
May-18 |
Sep-18 |
Source: Yandex.Radar
Renaissance Capital
23 January 2019
Media
18

vk.com/id446425943
Renaissance Capital
23 January 2019
Media
Figure 49: In our view, Google still has materially more apps pre-installed on new phones, but Yandex’s search is often the default, while in other cases the user is given a choice (screenshots of a newly purchased Samsung Galaxy A9)
Yandex is the default search engine |
Yandex s search and voice assistant Alice are available |
|
by swinging the screen down |
||
|
There is a wide selection of Google apps preinstalled on home screen
|
Source: Renaissance Capital |
Figure 50: Yandex’s share on Android has improved dramatically (search share |
Figure 51: …although it remains significantly below Google’s on Liveinternet data |
on Android)… |
(search share on Android) |
|
|
|
Yandex |
|
|
|
|
|
|
Yandex |
|
||
70.0% |
|
|
|
|
|
|
80.0% |
|
|
|
|
|
|
65.0% |
|
|
|
|
|
|
70.0% |
|
|
|
|
|
|
60.0% |
|
|
|
|
|
|
60.0% |
|
|
|
|
|
|
55.0% |
|
|
|
|
|
|
50.0% |
|
|
|
|
|
|
50.0% |
|
|
|
|
|
|
40.0% |
|
|
|
|
|
|
45.0% |
|
|
|
|
|
|
30.0% |
|
|
|
|
|
|
40.0% |
|
|
|
|
|
|
20.0% |
|
Change in |
|
|
|
|
|
|
|
|
|
|
|
|
|
|
|
|
||
35.0% |
|
|
|
|
|
|
10.0% |
|
methodology |
|
|
|
|
|
|
|
|
|
|
|
|
|
|
|
|
||
30.0% |
|
|
|
|
|
|
0.0% |
|
|
|
|
|
|
Jan-15 |
Jul-15 |
Jan-16 |
Jul-16 |
Jan-17 |
Jul-17 |
Jan-18 Jul-18 |
Jan-15 |
Jul-15 |
Jan-16 |
Jul-16 |
Jan-17 |
Jul-17 |
Jan-18 Jul-18 Jan- |
|
|
|
|
|
|
Source: Yandex.Radar |
|
|
|
|
|
|
Source: Liveinternet |
19

vk.com/id446425943
Renaissance Capital
23 January 2019
Media
Figure 52: Although Yandex’s performance of iOS remains soft (search share on iOS)…
Figure 53: …its overall share in mobile search has increased considerably in the past 18 months (search share on mobile)
|
|
|
Yandex |
|
|
|
|
|
Yandex |
|
||||
65.0% |
|
|
|
|
|
|
65.0% |
|
|
|
|
|
|
|
60.0% |
|
|
|
|
|
|
60.0% |
|
|
|
|
|
|
|
55.0% |
|
|
|
|
|
|
55.0% |
|
|
|
|
|
|
|
50.0% |
|
|
|
|
|
|
50.0% |
|
|
|
|
|
|
|
45.0% |
|
|
|
|
|
|
45.0% |
|
|
|
|
|
|
|
40.0% |
|
|
|
|
|
|
40.0% |
|
|
|
|
|
|
|
35.0% |
|
|
|
|
|
|
35.0% |
|
|
|
|
|
|
|
30.0% |
|
|
|
|
|
|
30.0% |
|
|
|
|
|
|
|
Jan-15 |
Jul-15 |
Jan-16 |
Jul-16 |
Jan-17 |
Jul-17 |
Jan-18 Jul-18 |
Jan-15 |
Jun-15 |
Nov-15 |
Apr-16 |
Sep-16 |
Feb-17 |
Jul-17 |
Dec-17 May-18 |
|
|
|
|
|
|
Source: Yandex.Radar |
|
|
|
|
|
|
|
Source: Yandex.Radar |
Figure 54: As a result, Yandex’s overall search share has been intact (overall search share)…
Figure 55: …and on Liveinternet data it declined only slightly over the past 18 months (overall search share)
|
|
|
Yandex |
|
|
|||
65.0% |
|
|
|
|
|
|
|
|
60.0% |
|
|
|
|
|
|
|
|
55.0% |
|
|
|
|
|
|
|
|
50.0% |
|
|
|
|
|
|
|
|
45.0% |
|
|
|
|
|
|
|
|
40.0% |
|
|
|
|
|
|
|
|
35.0% |
|
|
|
|
|
|
|
|
30.0% |
|
|
|
|
|
|
|
|
25.0% |
|
|
|
|
|
|
|
|
Jan-15 |
Jun-15 |
Nov-15 |
Apr-16 |
Sep-16 |
Feb-17 |
Jul-17 |
Dec-17 |
May-18 |
|
|
|
Yandex |
|
|
|
|
70.0% |
|
|
|
|
|
|
|
65.0% |
|
|
|
|
|
|
|
60.0% |
|
|
|
|
|
|
|
55.0% |
|
|
|
|
|
|
|
50.0% |
|
|
Change in |
|
|
|
|
|
|
|
|
|
|
||
45.0% |
|
|
methodology |
|
|
|
|
40.0% |
|
|
|
|
|
|
|
35.0% |
|
|
|
|
|
|
|
30.0% |
|
|
|
|
|
|
|
25.0% |
|
|
|
|
|
|
|
20.0% |
|
|
|
|
|
|
|
Mar-11 |
Mar-12 |
Mar-13 |
Mar-14 |
Mar-15 |
Mar-16 |
Mar-17 |
Mar-18 |
Source: Yandex.Radar Source: Liveinternet
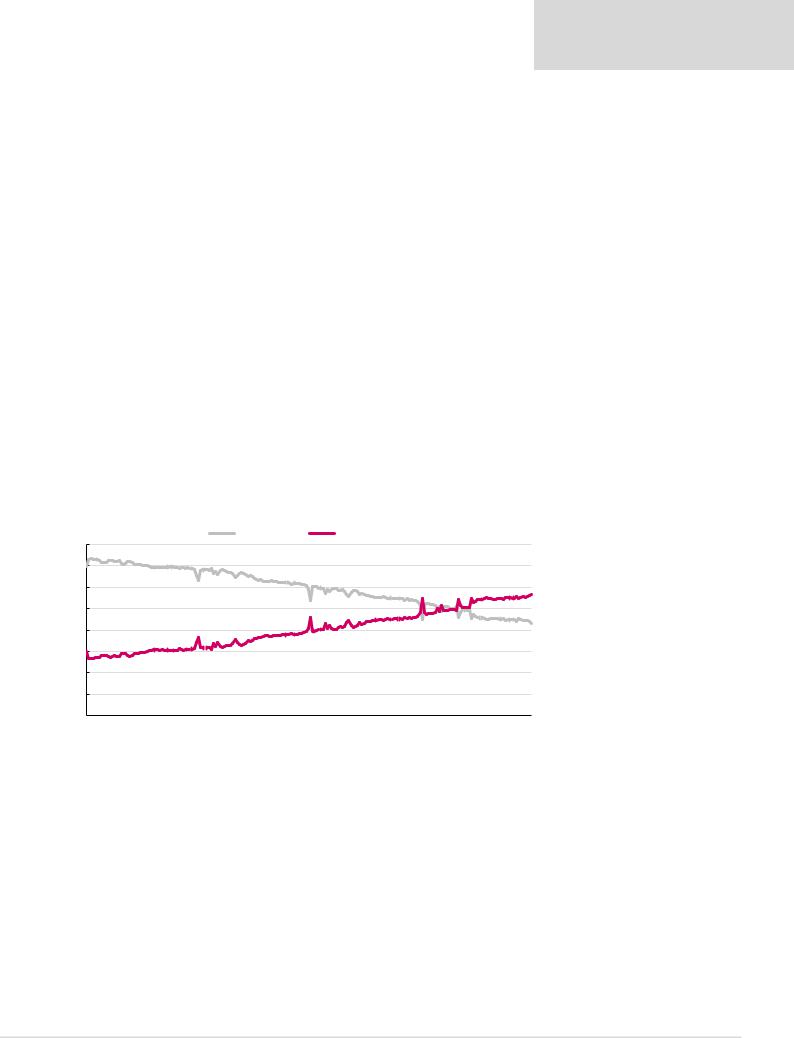
Figure 56: Yandex’s share on desktop has remained intact… |
Figure 57: …despite the ongoing growth in popularity of Google Chrome, on |
|||||||||||
|
|
|
|
|
|
which Google is the dominant search engine with a c. 60% share |
|
|||||
|
|
|
Yandex |
|
|
|
Google Chrome |
|
Yandex.Browser |
|
Opera |
|
|
|
|
|
|
|
|||||||
80.0% |
|
|
|
|
|
Firefox |
|
Internet Explorer |
|
|||
|
|
|
|
|
|
|
||||||
|
|
|
|
|
|
|
|
|
||||
|
|
|
|
|
|
|
|
|
|
|
|
|
|
|
|
|
|
|
|
65.0% |
|
|
|
|
|
70.0% |
|
|
|
|
|
|
|
|
|
|
|
|
60.0% |
|
|
|
|
|
|
55.0% |
|
|
|
|
|
|
|
|
|
|
|
|
|
|
|
|
|
|
50.0% |
|
|
|
|
|
|
45.0% |
|
|
|
|
|
40.0% |
|
|
|
|
|
|
35.0% |
|
|
|
|
|
|
|
|
|
|
|
|
|
|
|
|
|
|
30.0% |
|
|
|
|
|
|
|
|
|
|
|
|
|
|
|
|
|
|
|
25.0% |
|
|
|
|
|
20.0% |
|
|
|
|
|
|
|
|
|
|
|
|
10.0% |
|
|
|
|
|
|
15.0% |
|
|
|
|
|
|
|
|
|
|
|
|
|
|
|
|
|
|
0.0% |
|
|
|
|
|
|
5.0% |
|
|
|
|
|
Jan-15 |
Jul-15 |
Jan-16 |
Jul-16 |
Jan-17 |
Jul-17 |
Jan-18 Jul-18 |
Feb-13 |
Oct-13 |
Jun-14 |
Feb-15 |
Oct-15 |
Jun-16 Feb-17 Oct-17 |
|
|
|
|
|
|
Source: Yandex.Radar |
|
|
|
|
|
Source: Liveinternet |
20