

OR-271118_watermark
.pdfvk.com/id446425943
Obuv Rossii – Mixed 3Q18 results
Robust profitability but soft FCF
Obuv Rossii (OR) reported robust 3Q profitability, although this has not led to improved FCF dynamics. In the medium term, we remain positive on OR shares given the company’s high growth potential, significant scope to unlock value via working capital optimisation, and relatively inexpensive valuation, on our numbers. That said, the near-term outlook remains challenging given the still-tough consumer environment. Maintain BUY and RUB130 TP.
3Q results published
Results review
BUY (maintained)
TP: RUB130 (maintained)
Consumer Goods & Retail
Russia
Kirill Panarin
+7 (495) 258-7770 x4009 KPanarin@rencap.com
David Ferguson +7 (495) 641-4189
DFerguson@rencap.com
Report date: |
27 November 2018 |
Current price, RUB |
69.5 |
Upside/downside, % |
87.1 |
MktCap, $mn |
118 |
Average daily volume, $mn |
0.02 |
Free float, % |
39 |
Bloomberg |
OBUV RM |
|
|
Summary valuation and financials, RUBmn (unless otherwise stated)
Having previously published 3Q sales up 8%, today (27 November) OR reported 3Q gross profit up 28% YoY to RUB1.82bn, EBITDA up 26% to RUB929mn (27.9% margin) and net income up 58% to RUB508mn. OR confirmed its FY guidance of 150 new stores.
Key points
▪Overall revenue growth decelerated significantly to 8% in 3Q from 23% in 2Q. Retail revenue was down 2.9% (2Q: +3%) to RUB1.62bn driven by LfL deterioration to -8.8% (traffic -8.8%, ticket +0.0%) from +1.5% in 2Q. According to OR, soft dynamics were a result of: 1) a weak consumer environment; and 2) no response to the large sell-offs of summer collections by competitors.
▪Wholesale revenue continued to demonstrate strong growth (29% YoY) supported by a franchise store base expansion last year, and reached 40% of the total in 3Q18 (1H: 29%). Cash loans revenue fell by 2.9% in 3Q (vs -3.5% in 2Q).
▪Gross margin grew by 8.7ppts YoY in 3Q to 54.6% (vs a 1.1-ppt decline in 1H) despite a higher share of wholesale revenue in the mix. Strong gross margin dynamics was a result of no response to large sell-offs by competitors, while it was also helped by a higher share of related products (36.1% / +1.8 ppts YoY). 9Q gross margin was up 3.1 ppts YoY, ahead of our FY18 forecast.
▪SG&A growth (ex D&A) remained high at 31% YoY driven by new store openings, with DOS selling space up 34% YoY (2Q: 28%). Cost of risk was down 2.8 ppts YoY on instalments and 0.1 ppt on cash loans, to 3.8% and 3.8%, respectively. This compares to our full-year forecasts of 4.2% and 3.6%.
▪EBITDA margin grew 4.0 ppts YoY to 27.9% in 3Q. This is a material improvement vs the 1H trend, with 9M18 profitability down 1.6 ppts YoY; thus, our FY forecast of a 2.7-ppt margin deterioration looks relatively conservative, although a lot will depend on 4Q trading and the competitive environment.
▪Net debt increased to RUB8.5bn (vs RUB6.3bn in 2Q and RUB5.6bn in 1Q), with net debt / EBITDA at 3.1x currently. We believe negative FCF has been driven by working capital trends resulting from fast expansion and limited inventory optimisation which is difficult to achieve in the absence of solid sales growth.
OR’s 3Q profitability was robust, driven by relatively healthy mark-ups; however, it was previously flagged by management. A more important issue, in our view, is OR’s ability to turn around its LfL dynamics, which to a large extent depends on consumer environment trends, and we see little to suggest a material improvement in this regard in the short term. In the medium term, we remain positive on OR shares given its high growth potential and significant scope to unlock value via working capital optimisation. OR currently trades on 2019 EV/EBITDA and PE of 3.8x and 5.2x, equivalent to c. 36% / 43% discounts to Detsky Mir (BUY, TP RUB117, CP RUB90).
|
2017 |
2018E |
2019E |
2020E |
Revenue |
10,801 |
11,689 |
14,196 |
17,625 |
Gross profit |
5,853 |
6,477 |
7,794 |
9,696 |
EBITDA |
2,723 |
2,629 |
2,959 |
3,760 |
Net income |
1,296 |
1,318 |
1,511 |
2,113 |
Net debt |
4,732 |
5,256 |
3,526 |
3,940 |
FCF |
-3,096 |
-262 |
1,994 |
-112 |
Net trade working capital |
13,122 |
14,334 |
13,581 |
15,653 |
Net debt/EBITDA |
1.7 |
2.0 |
1.2 |
1.0 |
Revenue growth, % |
8.4 |
8.2 |
21.4 |
24.2 |
Gross margin, % |
54.2 |
55.4 |
54.9 |
55.0 |
EBITDA margin, % |
25.2 |
22.5 |
20.8 |
21.3 |
Net margin, % |
12.0 |
11.3 |
10.6 |
12.0 |
Net income growth, % |
9.6 |
1.7 |
14.7 |
39.8 |
RoIC, % |
14.8 |
10.5 |
11.1 |
13.6 |
EV/revenue, x |
1.2 |
1.1 |
0.8 |
0.7 |
EV/EBITDA, x |
4.6 |
5.0 |
3.8 |
3.1 |
P/E, x |
6.1 |
6.0 |
5.2 |
3.7 |
Current intraday prices shown at 27 November 2018
Source: Company data, Renaissance Capital estimates
Figure 1: Price performance – 52 weeks, RUB
OBUV RM
160 |
|
|
|
|
|
|
|
|
|
|
|
|
140 |
|
|
|
|
|
|
|
|
|
|
|
|
120 |
|
|
|
|
|
|
|
|
|
|
|
|
100 |
|
|
|
|
|
|
|
|
|
|
|
|
80 |
|
|
|
|
|
|
|
|
|
|
|
|
60 |
|
|
|
|
|
|
|
|
|
|
|
|
40 |
|
Jan-18 |
Feb-18 |
Mar-18 |
Apr-18 |
May-18 |
Jun-18 |
Jul-18 |
Aug-18 |
Sep-18 |
Oct-18 |
|
Nov-17 |
Dec-17 |
Nov-18 |
Source: Bloomberg
© 2018 Renaissance Securities (Cyprus) Limited. All rights reserved. Regulated by the Cyprus Securities and Exchange Commission (Licence No: KEPEY 053/04). Hyperlinks to important information accessible at www.rencap.com: Disclosures and Privacy Policy, Terms & Conditions, Disclaimer.
vk.com/id446425943
|
|
Renaissance Capital |
|
|
27 November 2018 |
|
|
Obuv Rossii |
|
|
|
Figure 2: OR’s LfL sales growth decreased to -8.8% in 3Q18… |
Figure 3: …although revenue growth is still likely to accelerate in the medium |
|
|
term, helped by an expansion acceleration |
|
|
LfL sales growth, % |
|
LfL traffic growth, % |
|
LfL ticket growth, % |
|
|
|
|||
|
|
|
15.0%
10.0%
5.0%
0.0%
-5.0%
-10.0%
-15.0%
-20.0%
4Q16 |
1Q17 |
2Q17 |
3Q17 |
4Q17 |
1Q18 |
2Q18 |
3Q18 |
|
|
Revenue, RUBbn |
|
Growth, % |
|
|
20.0 |
|
|
|
|
|
30.0% |
18.0 |
|
|
|
|
|
|
16.0 |
|
|
|
|
|
25.0% |
|
|
|
|
|
|
|
14.0 |
|
|
|
|
|
20.0% |
|
|
|
|
|
|
|
12.0 |
|
|
|
|
|
|
10.0 |
|
|
|
|
|
15.0% |
8.0 |
|
|
|
|
|
|
6.0 |
|
|
|
|
|
10.0% |
|
|
|
|
|
|
|
4.0 |
|
|
|
|
|
5.0% |
|
|
|
|
|
|
|
2.0 |
|
|
|
|
|
|
0.0 |
|
|
|
|
|
0.0% |
2014 |
2015 |
2016 |
2017 |
2018E |
2019E |
2020E |
Source: Company data Source: Company data, Renaissance Capital estimates
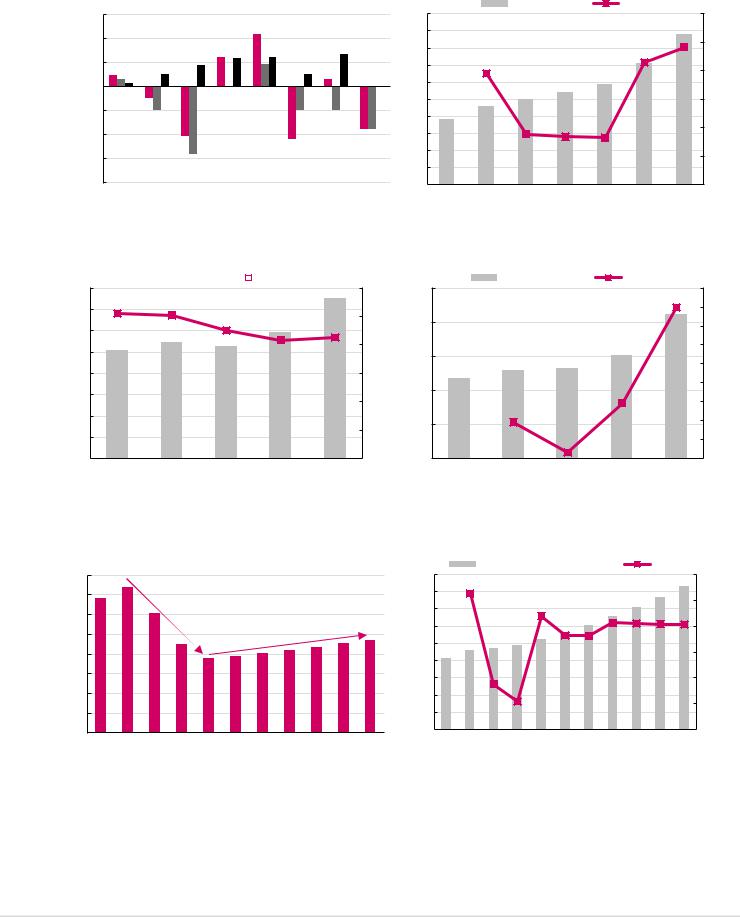
Figure 4: We forecast an 11.4% EBITDA CAGR in 2017-2020… Figure 5: …and a respective net income CAGR of 17.7%
|
EBITDA, RUBmn |
|
|
|
EBITDA margin, % |
4,000 |
|
|
|
30.0% |
2,500 |
3,500 |
|
|
|
25.0% |
|
3,000 |
|
|
|
2,000 |
|
|
|
|
|
|
|
2,500 |
|
|
|
20.0% |
|
|
|
|
|
1,500 |
|
|
|
|
|
|
|
2,000 |
|
|
|
15.0% |
|
1,500 |
|
|
|
|
1,000 |
|
|
|
10.0% |
|
|
|
|
|
|
|
|
1,000 |
|
|
|
|
500 |
|
|
|
|
5.0% |
|
500 |
|
|
|
|
|
|
|
|
|
|
|
0 |
|
|
|
0.0% |
0 |
2016 |
2017 |
2018E |
2019E |
2020E |
|
|
Net income, RUBmn |
Growth, % |
||
|
|
|
|
45% |
|
|
|
|
40% |
|
|
|
|
35% |
|
|
|
|
30% |
|
|
|
|
25% |
|
|
|
|
20% |
|
|
|
|
15% |
|
|
|
|
10% |
|
|
|
|
5% |
|
|
|
|
0% |
2016 |
2017 |
2018E |
2019E |
2020E |
Source: Company data, Renaissance Capital estimates |
Source: Company data, Renaissance Capital estimates |
Figure 6: Per-capita footwear consumption in Russia declined during the economic crisis and we expect a gradual volume recovery…
Figure 7: …which, combined with inflation, should lead to high-single-digit market CAGR between 2017 and 2022
 Per capita consumption, pairs of shoes
4.0 |
|
|
|
|
|
|
|
|
|
1.80 |
3.5 |
|
|
|
|
|
|
|
|
|
1.60 |
|
|
|
|
|
|
|
|
|
|
|
3.0 |
|
|
-49% |
|
|
|
|
|
|
1.40 |
|
|
|
|
|
|
|
|
|
||
|
|
|
|
|
|
|
|
|
|
|
2.5 |
|
|
|
|
|
+3.7% CAGR |
|
|
1.20 |
|
|
|
|
|
|
|
|
1.00 |
|||
|
|
|
|
|
|
|
|
|
|
|
2.0 |
|
|
|
|
|
|
|
|
|
0.80 |
|
|
|
|
|
|
|
|
|
|
|
1.5 |
|
|
|
|
|
|
|
|
|
0.60 |
|
|
|
|
|
|
|
|
|
|
|
1.0 |
|
|
|
|
|
|
|
|
|
0.40 |
0.5 |
|
|
|
|
|
|
|
|
|
0.20 |
0.0 |
|
|
|
|
|
|
|
|
|
0.00 |
|
|
|
|
|
|
|
|
|
|
|
2012 |
2013 |
2014 |
2015 |
2016 |
2017 |
2018E |
2019E |
2020E |
2021E |
2022E |
|
|
Russian footwear market, RUBtn |
|
|
Growth, % |
|||||
|
|
|
|
|
|
|
|
|
|
12.0% |
|
|
|
|
|
|
|
|
|
|
10.0% |
|
|
|
|
|
|
|
|
|
|
8.0% |
|
|
|
|
|
|
|
|
|
|
6.0% |
|
|
|
|
|
|
|
|
|
|
4.0% |
|
|
|
|
|
|
|
|
|
|
2.0% |
2012 |
2013 |
2014 |
2015 |
2016 |
2017 |
|
|
|
|
0.0% |
2018E |
2019E |
2020E |
2021E |
2022E |
||||||
Note: Renaissance Capital forecasts are shown. |
Note: Renaissance Capital forecasts are shown. |
Source: Discovery Research Group, Renaissance Capital estimates |
Source: Discovery Research Group, Renaissance Capital estimates |
2
vk.com/id446425943
|
|
|
|
|
|
|
|
|
|
|
|
Renaissance Capital |
|||
|
|
|
|
|
|
|
|
|
|
|
|
27 November 2018 |
|||
|
|
|
|
|
|
|
|
|
|
|
|
Obuv Rossii |
|||
|
|
|
|
|
|
|
|
|
|
|
|
|
|
||
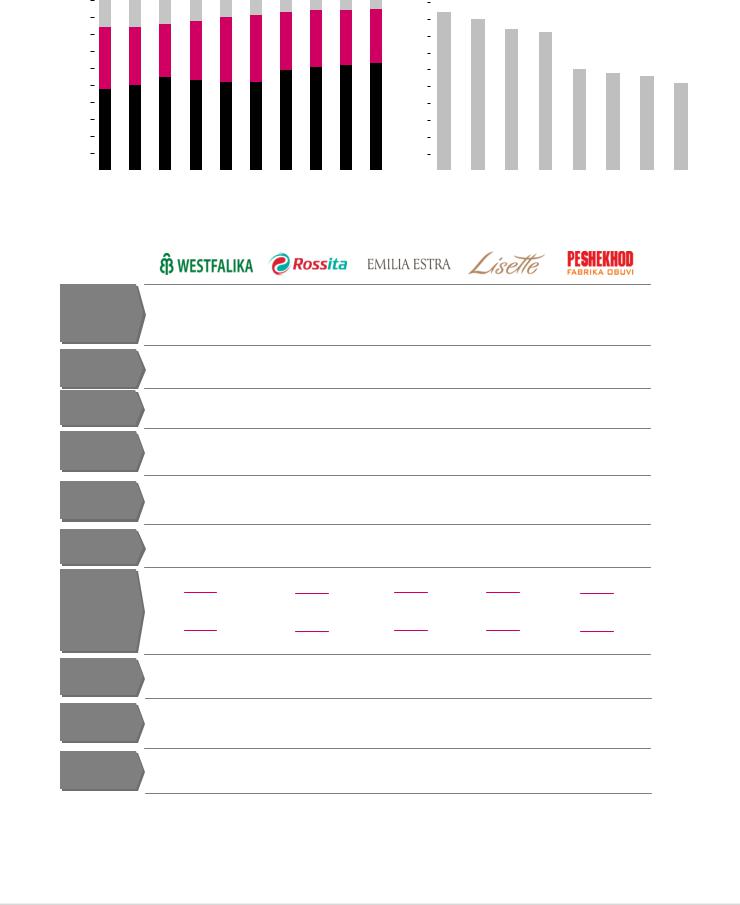
Figure 8: We see scope for the mid-price segment to take share in an improving |
Figure 9: Shoe retail in Russia is highly fragmented and could consolidate |
||||||||||||||
economy |
|
|
|
|
|
|
|
|
|
|
|
||||
100% |
|
|
Low-price |
|
Mid-price |
|
|
High-price |
50% |
Share of top 10 footwear retailers (2017), % |
|||||
|
|
|
|
||||||||||||
|
|
|
|
||||||||||||
|
|
|
|
|
|
|
|
|
|
|
|
|
|
||
90% |
|
|
|
|
|
|
|
|
|
45% |
|
|
|
|
|
|
|
|
|
|
|
|
|
|
|
|
|
|
|||
|
|
|
|
|
|
|
|
|
|
|
|
|
|
||
80% |
|
|
|
|
|
|
|
|
|
40% |
|
|
|
|
|
|
|
|
|
|
|
|
|
|
|
|
|
|
|||
|
|
|
|
|
|
|
|
|
|
|
|
|
|
||
70% |
|
|
|
|
|
|
|
|
|
35% |
|
|
|
|
|
|
|
|
|
|
|
|
|
|
|
|
|
|
|||
|
|
|
|
|
|
|
|
|
|
|
|
|
|
||
60% |
|
|
|
|
|
|
|
|
|
30% |
|
|
|
|
|
|
|
|
|
|
|
|
|
|
|
|
|
|
|||
|
|
|
|
|
|
|
|
|
|
|
|
|
|
||
50% |
|
|
|
|
|
|
|
|
|
25% |
|
|
|
|
|
|
|
|
|
|
|
|
|
|
|
|
|
|
|||
|
|
|
|
|
|
|
|
|
|
|
|
|
|
||
40% |
|
|
|
|
|
|
|
|
|
20% |
|
|
|
|
|
30% |
|
|
|
|
|
|
|
|
|
15% |
|
|
|
|
|
|
|
|
|
|
|
|
|
|
|
|
|
|
|
||
20% |
|
|
|
|
|
|
|
|
|
10% |
|
|
|
|
|
|
|
|
|
|
|
|
|
|
|
|
|
|
|
||
10% |
|
|
|
|
|
|
|
|
|
5% |
|
|
|
|
|
|
|
|
|
|
|
|
|
|
|
|
|
|
|
||
0% |
|
|
|
|
|
|
|
|
|
0% |
|
|
|
|
|
|
|
|
|
|
|
|
|
|
|
|
|
|
|
||
2008 2009 2010 2011 |
2012 2013 |
2014 2015 2016 2017 |
|
Germany USA France Japan China Turkey Canada India Russia |
|||||||||||
|
|
|
|
|
|
|
|
Source: Discovery Research Group |
|
|
Source: Euromonitor |
||||
Figure 10: A multi-brand strategy allows OR to reach a wide target audience
Description
Target age
Household income
Average selling space
SKU count
Catchment area
Price range
Blended mark-up
Annual sales per m2
Share of sales
|
|
|
|
|
|
|
|
|
|
|
|
Fashionable Italian |
Fashionable |
Affordable |
|||||||||||||
|
Traditional |
Modern footwear for |
footwear of classic |
||||||||||||||||||||||||
|
style footwear for |
footwear for |
|||||||||||||||||||||||||
|
footwear |
the entire family |
French style for |
||||||||||||||||||||||||
|
young women |
everyone |
|||||||||||||||||||||||||
|
|
|
|
|
|
|
|
|
|
|
|
young audience |
|||||||||||||||
|
|
|
|
|
|
|
|
|
|
|
|
|
|
|
|
|
|
|
|
|
|
||||||
30-50 |
25+ / children |
25-35 |
|
20-30 |
20-60 |
|
|||||||||||||||||||||
|
RUB 25-50k |
RUB 25-50k |
RUB 25-50k |
RUB 25-50k |
RUB 15-30k |
||||||||||||||||||||||
|
|
84 m2 |
|
126 m2 |
|
78 m2 |
|
60 m2 |
|
204 m2 |
|||||||||||||||||
3,000 |
2,400 |
|
1,100 |
|
1,000 |
4,800 |
|
||||||||||||||||||||
80,000 people |
150,000 people |
80,000 people |
80,000 people |
150,000 people |
|||||||||||||||||||||||
|
|
|
|
|
|
|
|
|
|
|
|
|
|
|
|
|
|
|
|
|
|
|
|
|
|
|
|
High |
|
|
|
|
RUB 7.5k |
High |
|
|
|
|
RUB 7.5k |
High |
|
|
|
|
RUB 7.5k |
High |
|
|
|
|
RUB 7.5k |
High |
|
|
RUB 7.5k |
Mid |
|
|
|
|
Mid |
|
|
|
|
Mid |
|
|
|
|
Mid |
|
|
|
|
Mid |
|
|
|||||
|
|
|
|
|
|
|
|
|
|
|
|
||||||||||||||||
|
|
|
|
RUB 3k |
|
|
|
|
RUB 3k |
|
|
|
|
RUB 3k |
|
|
|
|
RUB 3k |
|
|
RUB 3k |
|||||
|
|
|
|
|
|
|
|
|
|
|
|
|
|
||||||||||||||
Low |
|
|
|
|
Low |
|
|
|
|
Low |
|
|
|
|
Low |
|
|
|
|
Low |
|
|
|||||
|
|
|
|
|
|
|
|
|
|
|
|
|
|
|
|
|
|
||||||||||
|
|
|
|
|
|
|
|
|
|
|
|
|
|
|
|
|
|
||||||||||
|
|
|
|
|
|
|
|
|
|
|
|
|
|
|
|
|
|
|
|
|
|
|
|||||
|
|
|
|
|
|
|
|
|
|
|
|
|
|
|
|
|
|
|
|
|
|
|
|
|
|
|
|
110% |
100% |
|
110-115% |
105% |
60-75% |
||||||||||||||||||||||
|
c. 300k RUB |
c. 220k RUB |
c. 230k RUB |
c. 285k RUB |
c. 130k RUB |
||||||||||||||||||||||
65% |
6.8% |
1.6% |
|
1.1% |
12% |
|
|||||||||||||||||||||
|
|
|
|
|
|
|
|
|
|
|
|
|
|
|
|
|
|
|
|
|
|
|
|
|
Source: Company data |
||
3

vk.com/id446425943
|
|
Renaissance Capital |
|
|
27 November 2018 |
|
|
Obuv Rossii |
|
|
|
Figure 11: Share of related products in OR’s sales has grown significantly… |
Figure 12: …which has been supportive for LfL growth and profitability given |
|
|
adjacent categories’ higher sales densities and mark-ups |
|
Related products revenue, RUBbn |
Share in retail revenue, % |
2000 |
||||
4.0 |
|
|
|
|
35% |
|
|
|
|
|
|
|
1800 |
3.5 |
|
|
|
|
30% |
1600 |
|
|
|
|
|
||
3.0 |
|
|
|
|
25% |
1400 |
2.5 |
|
|
|
|
|
1200 |
|
|
|
|
20% |
|
|
2.0 |
|
|
|
|
1000 |
|
|
|
|
|
|
800 |
|
|
|
|
|
|
15% |
|
1.5 |
|
|
|
|
|
|
|
|
|
|
|
600 |
|
1.0 |
|
|
|
|
10% |
400 |
|
|
|
|
|
||
|
|
|
|
|
|
|
0.5 |
|
|
|
|
5% |
200 |
|
|
|
|
|
||
|
|
|
|
|
0 |
|
|
|
|
|
|
|
|
0.0 |
|
|
|
|
0% |
|
2012 |
2013 |
2014 |
2015 |
2016 |
2017 |
|
|
|
|
|
|
Source: Company data |
|
|
|
Sales per m2, '000s RUB |
|
Trade mark-up range, % |
250% |
|||
|
|
|
||||||
|
|
|
||||||
|
|
|
|
|
|
|
||
|
|
|
|
|
|
220% |
||
|
|
|
|
|
|
200% |
||
|
|
|
|
|
|
|
||
|
|
|
|
|
|
|
||
|
|
|
|
|
|
|
150% |
|
|
|
|
|
|
|
|
||
|
|
|
|
135% |
|
|||
|
|
|
|
|
|
|||
105% |
115% |
120% |
140% |
100% |
||||
|
|
|||||||
90% |
95% |
|
||||||
|
|
|
|
|||||
|
|
|
|
|
||||
170 |
454 |
268 |
257 |
50% |
||||
|
|
|||||||
|
|
|
|
|||||
|
|
|
|
|
||||
|
|
|
|
|
|
|
0% |
|
Footwear |
Apparel |
Bags |
Other related |
|||||
|
||||||||
|
|
|
|
|
|
products |
|
|
Source: Company data
Figure 13: Opening 100+ stores per year is possible but requires strong execution |
|
|||||||||
600 |
|
|
Stores added between Sep-13 and Dec-16 |
|
|
Anuualised store additions |
|
|||
|
|
|
|
|||||||
|
|
|
|
|||||||
|
|
|
|
|
|
|
|
|
||
480 |
|
|
|
|
|
|
|
|
||
500 |
|
|
|
|
|
|
|
|
||
|
|
|
|
|
|
|
|
|
||
400 |
|
|
|
|
|
|
|
|
|
|
|
|
|
|
|
|
|
|
|
||
300 |
|
|
|
|
|
|
|
|
|
|
|
>200 |
199 |
184 |
|
|
|
|
|||
|
|
|
|
|
|
|||||
200 |
160 |
|
|
|
|
|
|
|
||
>67 |
66 |
61 |
86 |
69 |
||||||
100 |
|
|||||||||
|
29 |
|||||||||
|
|
|
|
|
|
|
|
23 |
||
0 |
|
|
|
|
|
|
|
|
|
|
Kari |
|
Zenden |
Obuv Rossii |
Chester |
Unichel |
Belwest |
||||
|
|
|||||||||
Note: Includes store openings in CIS.
Source: Company data, Discovery Research Group, Renaissance Capital
Figure 14: We see significant scope for expansion in the Central, North-West and Volga regions
|
|
|
|
Far East region |
|
|
|
|
|
|
|
|
|
TNorth- |
|
|
|
|
|
|
|
|
|
West |
|
|
|
|
region |
Central |
|
|
|
Siberian region |
region |
|
|
|
Urals |
|
|
|
|
|
|
Volga |
|
region |
|
|
|
|
||
|
region |
|
|
|
Southern |
|
|
|
|
region |
|
|
|
|
Source: Company data
4

vk.com/id446425943
Renaissance Capital
27 November 2018
Obuv Rossii
Figure 15: Cash loan revenue accounted for 15% of total in 2016 and with a low Figure 16: Cash loans business accounted for 30% of group EBITDA in 2017 cost of risk, comfortably exceeded loan-loss provisions
Interest income, RUBmn |
Loan loss provisions, RUBmn |
Segment EBITDA, RUBmn |
|
Share of total EBITDA*, % |
|||||
Cost of risk, % |
|
|
|
|
Margin, % |
|
|
|
|
1,600 |
|
|
|
7.0% |
1,000 |
|
|
|
70% |
1,400 |
|
|
|
6.0% |
|
|
|
|
60% |
|
|
|
|
800 |
|
|
|
||
1,200 |
|
|
|
|
|
|
|
|
|
|
|
|
5.0% |
|
|
|
|
50% |
|
|
|
|
|
|
|
|
|
||
1,000 |
|
|
|
4.0% |
600 |
|
|
|
40% |
|
|
|
|
|
|
|
|||
|
|
|
|
|
|
|
|
||
800 |
|
|
|
|
|
|
|
|
|
600 |
|
|
|
3.0% |
400 |
|
|
|
30% |
|
|
|
|
|
|
|
|
||
|
|
|
|
|
|
|
|
|
|
400 |
|
|
|
2.0% |
|
|
|
|
20% |
|
|
|
|
200 |
|
|
|
|
|
|
|
|
|
1.0% |
|
|
|
10% |
|
200 |
|
|
|
|
|
|
|
||
|
|
|
|
|
|
|
|
|
|
0 |
|
|
|
0.0% |
0 |
|
|
|
0% |
2014 |
2015 |
2016 |
2017 |
|
2014 |
2015 |
2016 |
2017 |
|
|
|
|
|
|
*Total EBITDA before unallocated SG&A costs is used. |
|
|
|
|
|
|
|
|
Source: Company data |
|
|
|
|
Source: Company data |
Figure 17: OR – income statement, RUBmn (unless otherwise stated) |
|
|
|
|
|
||||
|
|
|
2014 |
2015 |
2016 |
2017 |
2018E |
2019E |
2020E |
Revenue |
|
|
7,663 |
9,156 |
9,965 |
10,801 |
11,689 |
14,196 |
17,625 |
Growth |
|
|
|
19% |
9% |
8% |
8% |
21% |
24% |
– Retail revenue |
|
|
5,874 |
6,844 |
7,663 |
7,078 |
7,652 |
9,976 |
13,245 |
– Growth |
|
|
|
16.5% |
12.0% |
-7.6% |
8.1% |
30.4% |
32.8% |
– Wholesale revenue |
|
|
987 |
948 |
825 |
2,224 |
2,493 |
2,603 |
2,715 |
– Growth |
|
|
|
-4.0% |
-13.0% |
169.7% |
12.1% |
4.4% |
4.3% |
– Cash loans revenue |
|
|
802 |
1,364 |
1,478 |
1,500 |
1,543 |
1,617 |
1,665 |
– Growth |
|
|
|
70.0% |
8.4% |
1.5% |
2.9% |
4.8% |
3.0% |
Cost of sales |
|
|
(3,676) |
(3,646) |
(4,106) |
(4,948) |
(5,212) |
(6,402) |
(7,928) |
Gross profit |
|
|
3,987 |
5,510 |
5,859 |
5,853 |
6,477 |
7,794 |
9,696 |
Gross margin |
|
|
52.0% |
60.2% |
58.8% |
54.2% |
55.4% |
54.9% |
55.0% |
SG&A (excl. D&A) |
|
|
(2,633) |
(2,963) |
(3,332) |
(3,350) |
(3,938) |
(4,966) |
(6,116) |
Other income and expenses |
|
|
(30) |
54 |
(6) |
172 |
57 |
87 |
126 |
EBITDA |
|
|
1,325 |
2,602 |
2,540 |
2,723 |
2,629 |
2,959 |
3,760 |
EBITDA margin |
|
|
17.3% |
28.4% |
25.5% |
25.2% |
22.5% |
20.8% |
21.3% |
D&A |
|
|
(87) |
(133) |
(217) |
(264) |
(336) |
(446) |
(536) |
EBIT |
|
|
1,238 |
2,469 |
2,323 |
2,458 |
2,294 |
2,513 |
3,224 |
Margin |
|
|
16.2% |
27.0% |
23.3% |
22.8% |
19.6% |
17.7% |
18.3% |
Financial income |
|
|
20 |
21 |
26 |
63 |
95 |
108 |
149 |
Financial costs |
|
|
(459) |
(815) |
(1,019) |
(1,038) |
(742) |
(732) |
(732) |
PBT |
|
|
800 |
1,676 |
1,330 |
1,483 |
1,647 |
1,889 |
2,641 |
Tax expense |
|
|
(162) |
(207) |
(147) |
(187) |
(329) |
(378) |
(528) |
Net profit |
|
|
637 |
1,469 |
1,183 |
1,296 |
1,318 |
1,511 |
2,113 |
Growth |
|
|
|
130% |
-19% |
10% |
2% |
15% |
40% |
Margin |
|
|
8.3% |
16.0% |
11.9% |
12.0% |
11.3% |
10.6% |
12.0% |
|
|
|
|
|
|
|
Source: Company data, Renaissance Capital estimates |
||
Figure 18: OR – peer multiples, x
Company |
Currency |
Share |
MktCap, |
|
EV/EBITDA, x |
|
|
P/E, x |
|
|
EV/sales, x |
|
||
price |
$mn |
2017 |
|
2018E |
2019E |
2017 |
2018E |
2019E |
2017 |
|
2018E |
2019E |
||
|
|
|
|
|||||||||||
Obuv Rossii |
RUB |
69.5 |
118 |
4.6 |
|
5.0 |
3.8 |
6.1 |
6.0 |
5.2 |
1.2 |
|
1.1 |
0.8 |
International peers |
|
|
|
|
|
|
|
|
|
|
|
|
|
|
Truworths |
ZAR |
86.7 |
2,761 |
8.5 |
|
8.9 |
9.0 |
13.3 |
13.5 |
12.9 |
2.2 |
|
2.3 |
2.1 |
CCC |
PLN |
193.5 |
2,098 |
16.8 |
16.0 |
10.8 |
26.9 |
29.8 |
18.7 |
2.0 |
1.7 |
1.3 |
||
LPP |
PLN |
7590 |
3,704 |
15.5 |
|
12.0 |
10.3 |
31.3 |
23.7 |
20.5 |
1.9 |
|
1.6 |
1.4 |
Foschini |
ZAR |
170.9 |
2,913 |
10.0 |
9.3 |
8.5 |
15.5 |
14.4 |
13.7 |
1.6 |
1.4 |
1.4 |
||
Lojas Renner |
BRL |
38.0 |
6,928 |
15.5 |
|
15.8 |
13.5 |
30.2 |
27.9 |
23.6 |
3.1 |
|
3.2 |
2.8 |
Forus |
CLP |
1,866 |
713 |
9.4 |
11.8 |
10.8 |
16.9 |
17.9 |
16.5 |
1.5 |
1.9 |
1.8 |
||
Arezzo |
BRL |
49.8 |
1,140 |
16.9 |
|
17.5 |
14.6 |
23.5 |
26.3 |
21.8 |
2.6 |
|
2.7 |
2.3 |
International average |
|
|
|
13.2 |
13.0 |
11.1 |
22.5 |
21.9 |
18.2 |
2.1 |
2.1 |
1.9 |
||
Russian small-/mid-cap retailers |
|
|
|
|
|
|
|
|
|
|
|
|
|
|
Lenta |
USD |
3.5 |
1,706 |
5.4 |
5.3 |
4.9 |
7.5 |
8.2 |
8.0 |
0.5 |
0.5 |
0.4 |
||
M.Video |
RUB |
399 |
1,077 |
4.6 |
|
4.2 |
3.7 |
10.3 |
10.2 |
9.5 |
0.3 |
|
0.2 |
0.2 |
Detsky Mir |
RUB |
90.0 |
997 |
7.2 |
6.3 |
6.0 |
12.1 |
9.6 |
9.2 |
0.8 |
0.7 |
0.7 |
||
Russian small-cap average |
|
|
|
5.7 |
|
5.3 |
4.8 |
10.0 |
9.3 |
8.9 |
0.5 |
|
0.5 |
0.4 |
Note: Renaissance Capital estimates used for Obuv Rossii, Detsky Mir and Lenta; Bloomberg consensus is used for others. Intraday pricing as of 27 November 2018.
Source: Bloomberg, Renaissance Capital estimates
5