

final_prep
.pdf372) |
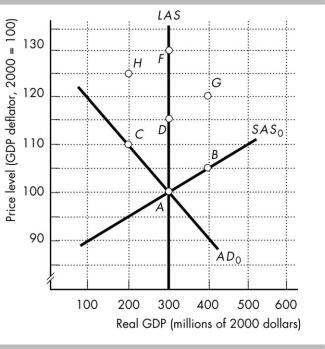
In the above figure, suppose the economy is at point D. Which of the following occurs as a result |
372) |
_____ |
|
|
of an open market purchase of government securities by the Fed? |
|
|
|
|
A) an increase in investment |
B) an increase in exports |
|
|
|
C) a decrease in the real interest rate |
D) All of the above occur. |
|
|
373) |
In the above figure, suppose the economy was initially in an equilibrium at point D. Where |
373) |
_____ |
|
|
would the economy move if the Fed makes an open market purchase of government securities? |
|
|
|
A)A
B)B
C)C
D)D, that is, the economy would not change its equilibrium.
374) In the above figure, the economy experiences a decrease in aggregate demand so that the |
374) _____ |
aggregate demand curve shifts from AD0 to AD1. If the Fed wants to offset this change, it would |
|
________. |
|
A) lower taxes
B) purchase government securities on the open market
C) sell government securities on the open market
D) increase government expenditures |
|
375) In the above figure, the economy experiences an increase in aggregate demand so that the |
375) _____ |
aggregate demand curve shifts from AD0 to AD2. If the Fed wants to offset this change, it would |
|
________. |
|
A) purchase government securities on the open market |
|
B) raise taxes |
|
C) sell government securities on the open market |
|
D) increase government expenditures |
|
376)A tariff is a
A)tax on an imported good or service.
C)subsidy on an exported good.
376) _____
B) subsidy on an imported good.
D) tax on an exported good or service.
377) |
A tariff is a tax that is imposed by the ________ country when an ________ good crosses its |
377) |
_____ |
|
|
international boundary. |
|
|
|
|
A) exporting; imported |
B) importing; exported |
|
|
|
C) importing; imported |
D) exporting; exported |
|
|
378) |
Which of the following statements concerning tariffs is NOT true? |
378) |
_____ |
|
A)A tariff leaves the price of imports unchanged.
B)A tariff creates revenue for the government.
C)A tariff decreases international trade.
D)A tariff results in a deadweight loss.
379) If a country imposes a tariff on an imported good, the tariff would ________ the price in the |
379) _____ |
|
importing country and ________ the quantity of imports. |
|
|
A) raise; decrease |
B) raise; not change |
|
C) raise; increase |
D) lower; not change |
|
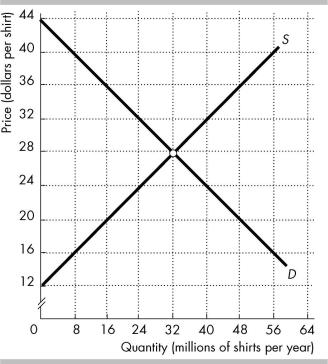
The figure shows the market for shirts in the United States, where D is the domestic demand curve and S is the domestic supply curve. The world price is $20 per shirt. The United States imposes a tariff on imported shirts, $4 per shirt.
380) |
In the figure above, with the tariff Americans buy ________ million shirts per year. |
380) |
_____ |
|||
|
A) 32 |
B) 40 |
C) 16 |
D) 48 |
|
|
381) |
In the figure above, with the tariff the United States imports ________ million shirts per year. |
381) |
_____ |
|||
|
A) 16 |
B) 32 |
C) 8 |
D) 24 |
|
|
382) |
Import quotas |
|
|
|
382) |
_____ |
A)are not used by the United States.
B)are the same as tariffs.
C)set the maximum number of units of a good that can be imported.
D)set the minimum percentage of the value of a product that must consist of imported components.
383) An import quota is a |
383) _____ |
A)market-imposed balancing factor that keeps prices of imports and exports in equilibrium.
B)law that prevents ecologically damaging goods from being imported into a country.
C)tariff imposed on goods that are dumped in the country.
D)government-imposed restriction on the quantity of a specific good that can be imported.
384) The effect of an import quota is to |
384) _____ |
A)decrease the supply of the good and raise its price.
B)increase the supply of the good and increase its price.
C)increase the supply of the good and lower its price.
D)increase the demand for the good and increase its price.
385) A difference between a quota and a tariff is that |
385) _____ |
A)a quota increases profits of domestic producers more than does a tariff.
B)the government collects revenues from a tariff but does not collect revenues from a quota.
C)a tariff generates a greater reduction in exports than does a quota.

D) a tariff generates a higher price than does a quota.
386) When does the domestic government gain the MOST revenue? |
386) _____ |
A)when it imposes a tariff
B)when it negotiates a voluntary export restraint
C)when it imposes an import quota
D)The amount of revenue it gains is the same with a tariff and a voluntary export restraint.
ESSAY. Write your answer in the space provided or on a separate sheet of paper.
|
|
2003 |
|
2004 |
|
|
Quantit |
Price |
Quantit |
Price |
|
Item |
y |
(dollars |
y |
(dollars |
|
(pound |
per |
(pound |
per |
||
|
|||||
|
s) |
pound) |
s) |
pound) |
|
Chocolate |
100 |
10 |
120 |
15 |
|
Ice cream |
500 |
5 |
520 |
6 |
387)Sweetland produces only chocolate and ice cream. The base year is 2003 and the table shows the quantities produced and prices:
a)Calculate Sweetland's nominal GDP in 2003 and 2004.
b)If 2003 is the base year, calculate Sweetland's real GDP in 2004 using the chain-weighted output index method.
c)Calculate Sweetland's price level in 2004.
d)Calculate Sweetland's economic growth rate.
|
Amount |
Item |
(millions of dollars) |
Wages paid |
100 |
Consumption expenditure |
120 |
Taxes |
40 |
Transfer payments |
15 |
Profits |
35 |
Investment |
30 |
Government expenditure |
50 |
Exports |
30 |
Imports |
40 |
388)The table above shows the transaction in Pinkland last year:
a)Calculate Pinkland's GDP.
b)What approach did you use to make this calculation?
c)What is the country's national saving?
d)How is Pinkland's investment financed?
389)A typical household in Orangeland consumes only orange juice and shorts. Last year, which was the base year, the household spent $400 on juice and $120 on shorts. In the base year, juice was $2 a bottle and shorts were $10 a pair. This year, juice is $3 a bottle, shorts are $12 a pair, and a typical household has bought 180 bottles of juice and 14 pairs of shorts.
a)What is the basket used in the CPI?
b)Calculate the CPI in the current year.
c)Calculate the inflation rate in the current year.
d) |
Is the inflation rate that you've calculated likely to be biased? Why or why not? |
390) A labor force survey in Brownland records the following data for December 2007: Employed: 189,000
Unemployed: 15,000
Not in the labor force: 84,000 During 2008, the survey recorded:
Hires and recalls: 5,000
Job losers and job leavers: 7,500 Entrants and reentrants: 21,000 Withdrawals: 18,000
The working age population increased during 2008 by 5 percent.
a)Calculate for December 2007 the unemployment rate.
b)Calculate for December 2007 the labor force participation rate.
c)Calculate for December 2008 the unemployment rate.
d)Calculate for December 2008 the labor force participation rate.
Real |
Supply of |
Demand |
|
for |
|||
interest |
loanable |
||
loanable |
|||
rate |
funds |
||
funds |
|||
(percent |
(2000 |
||
(2000 |
|||
per year) |
dollars) |
||
dollars) |
|||
|
|
||
5 |
2,000 |
5,000 |
|
7 |
3,000 |
4,000 |
|
9 |
4,000 |
3,000 |
|
11 |
5,000 |
2,000 |
391)The economy of Dream Island, which is isolated from the rest of the world, has the supply of loanable funds schedule and the demand for loanable funds schedule shown in the table above. As it happens, all of the supply of loanable funds are from households' saving and the entre demand for loanable funds is from firms' investment demand.
a)Draw the demand and supply curves.
b)What is the equilibrium real interest rate?
c)What is equilibrium investment? Equilibrium saving?
d)Describe the situation in Dream Island's loanable funds market when the real interest rate is 10 percent. Is there a shortage of loanable funds? A surplus of loanable funds?
e)Describe the situation in Dream Island's capital market when the real interest rate is 6 percent. Is there a shortage of loanable funds? A surplus of loanable funds?
Leisure |
Real |
(hours) |
GDP |
|
(2000 |
|
dollars) |
0 |
2,000 |
40 |
1,920 |
80 |
1,680 |
120 |
1,280 |
160 |
720 |
200 |
0 |

392)The people of Palm Island are willing to work 80 hours a day for a real wage rate of $4 an hour. Then each dollar increase in the real wage, they are willing to work 10 additional hours a day. Palm Island's production possibilities are in the table above.
a)Draw Palm Island's demand for labor curve.
b)Draw Palm Island's supply of labor curve.
c)What are the full-employment equilibrium real wage rate and quantity of labor in Palm Island's economy?
d)What is Palm Island's potential GDP?
393)The people of Palm Island have 200 hours every day to allocate between leisure (sitting underneath palm trees!) and work. The table above different combinations of leisure and real GDP that are available to Palm Island.
a)Draw a figure showing Palm Island's PPF for leisure and real GDP.
b)Draw a figure showing Palm Island's aggregate production function.
c)If the people of Palm Island spend half of their time on leisure, what is Palm Island's real GDP?
d)If the people of Palm Island spend half of their time on leisure, what is the marginal product of
labor?.
Capital per |
Real GDP per |
hour of labor |
hour of labor |
(2000 dollars) |
(2000 dollars) |
4 |
5.00 |
8 |
7.10 |
12 |
8.70 |
16 |
10.00 |
20 |
11.20 |
24 |
12.20 |
28 |
13.20 |
32 |
14.10 |
36 |
15.00 |
394)Prosperia is an economy that behaves according to the neoclassical growth model. The economy's target rate of return is 31 percent. The relationship between capital per hour of labor and real GDP per hour of labor are shown in the table above. Prosperia has a capital stock of $16 per hour of labor and real GDP of $10,00 per hour of labor. At this point there is no economic growth because the real interest rate equals the target rate of return. Then a technological advance increases productivity.
a)What happens to real GDP per hour of labor immediately following the technological advance?
b)What happens to Prosperia's real interest rate immediately following the technological advance?
c)What is the eventual quantity of capital per hour of labor and real GDP per hour of labor in Prosperia?
Capital per |
Real GDP per |
hour of labor |
hour of labor |
(2000 dollars) |
(2000 dollars) |
5 |
6.10 |
10 |
8.70 |
15 |
10.71 |
20 |
12.20 |
25 |
13.70 |
30 |
15.00 |
35 |
16.20 |
40 |
17.30 |
45 |
18.40 |
395)Dismalia is an economy that behaves according to the classical growth model. The country's subsistence real GDP is $15 an hour. The relationship between capital per hour of labor and real GDP per hour of labor are shown in the table above. Initially, the population of Dismalia is constant, and real GDP is at its subsistence level. Then a technological advance increases productivity.
a)What are the initial capital per hour of labor and real GDP per hour of labor?
b)What happens to real GDP per hour of labor immediately following the technological advance?
c)What happens to Dismalia's population following the technological advance?
d)What is the eventual quantity of capital per hour of labor and real GDP per hour of labor in Dismalia?
396)In the economy of Briskland, the commercial banks have deposits of $500 billion. Their reserves are $50 billion, 80 percent of which is in deposits with the Central Bank. There is $20 billion in Central Bank notes outside the banks, and there are no coins.
a)What is the monetary base?
b)If all the deposits are money, what is the total quantity of money?
c)What is the banks' reserve ratio?
d)What is the currency drain as a percentage of the quantity of deposits?
397)Fisheria is a country in which the quantity theory of money operates. The country has a constant population, capital stock, and technology. In 2006, real GDP was $300 million, the quantity of money was $60, and the velocity of circulation of money was 10. In 2007, the price level rose by 20 percent.
a)What was the price level in 2006? (The price level is measured by the GDP deflator, which is 100 in 2000. So the price level from the equation of exchange needs to be multiplied by 100 to convert it to the GDP deflator.)
b)What was real GDP in 2007?
c)What was the velocity of circulation in 2007?
d)What was the quantity of money in 2007?
398)Friedmania is a country in which the quantity theory of money operates. The country has a constant population, capital stock, and technology so real GDP does not change. In 2006, real GDP was $500 million, the price level, measured by the GDP deflator, was 150 and the velocity of circulation of money was 10. (Because the price level is measured by the GDP deflator, it must be divided by 100 before it is used in the equation of exchange.) In 2007, the quantity of money increased by 20 percent.
a)What was the quantity of money in 2006?
b)What was the velocity of circulation in 2007?
c)What was the price level in 2007?
|
Real GDP |
Real GDP |
Price |
demanded |
supplied |
level |
(billions of 2000 |
(billions of 2000 |
|
dollars) |
dollars) |
90 |
450 |
150 |
100 |
400 |
250 |
110 |
350 |
350 |
120 |
300 |
450 |
130 |
250 |
550 |

399)The table above shows Yellowland's economy aggregate demand and supply schedules. Yellowland's potential GDP is $300 billion.
a)Plot the aggregate demand curve, the short-run aggregate supply curve, and the long-run aggregate supply curve.
b)What are the short-run equilibrium real GDP and price level in Yellowland?
c)What is the long-run equilibrium real GDP?
d)Is Yellowland's short-run macroeconomic equilibrium a full-employment equilibrium, below
full-employment equilibrium, or above full-employment equilibrium? What is the recessionary gap (if any)? What is the inflationary gap (if any)?
e)Suppose aggregate supply decreases by $150 billion. Plot the new aggregate supply curve. How do real GDP and the price level change in the short run?
f)Is Yellowland's new short-run macroeconomic equilibrium a full-employment equilibrium, below full-employment equilibrium, or above full-employment equilibrium? What is the recessionary gap (if any)?
What is the inflationary gap (if any)?
400)In the economy of Jokey Island, autonomous consumption expenditure is $60 million, and the marginal propensity to consume is 0.6. Investment is $110 million, government expenditure is $70 million, and there
are no income taxes. Investment and government expenditure are constant they do not vary with income. The island does not trade with the rest of the world.
a)Draw the aggregate expenditure curve.
b)What is the island's autonomous aggregate expenditure?
c)What is the size of the multiplier in Jokey Island's economy?
d)What is the island's aggregate planned expenditure and what is happening to inventories when real GDP is $800 million?
e)What is the economy's equilibrium aggregate expenditure?
401)In the economy of St. Maynard Island, autonomous consumption expenditure is $185 million, and the
marginal propensity to consume is 0.75. Investment is $150 million, government expenditure is $100 million, and net taxes are $80 million. Investment, government expenditure, and taxes are constant they do not vary with income. The island does not trade with the rest of the world.
a)Draw the aggregate expenditure curve.
b)What is the island's autonomous aggregate expenditure?
c)What is the size of the multiplier in St. Maynard Island's economy?
d)What is the island's aggregate planned expenditure and what is happening to inventories when real GDP is $1,100 million?
e)What is the economy's equilibrium aggregate expenditure?
402)In the economy of Keynesian Island, autonomous consumption expenditure is $50 million, and the marginal
propensity to consume is 0.8. Investment is $160 million, government expenditure is $190 million, and net taxes are $250 million. Investment, government purchases, and taxes are constant they do not vary with income. The island does not trade with the rest of the world.
a)Draw the aggregate expenditure curve.
b)What is equilibrium real GDP for Keynesian Island?
c)What is the size of the multiplier in Keynesian Island's economy?
d)If the government increases its purchases by $200 million, what will be the change in the economy's equilibrium real GDP?
403)In the economy of Jokey Island, autonomous consumption expenditure is $60 million, and the marginal
propensity to consume is 0.6. Investment is $110 million, government expenditure is $70 million, and there are no income taxes. Investment and government expenditure are constant they do not vary with income. The island does not trade with the rest of the world.
a)ure curve.
b)What is the island's autonomous aggregate expenditure?
Draw the c) |
What is the size of the multiplier in Jokey Island's economy? |
|
aggregat |
d) |
What is the island's aggregate planned expenditure and what is happening to inventories when real |
e |
GDP is $800 million? |
|
expendit |
e) |
What is the economy's equilibrium aggregate expenditure? |
404)The figure above shows the initial aggregate demand curve, AD0, the initial short-run aggregate supply curve, SAS0, and the long-run aggregate supply curve, LAS. The points in the figure show possible
combinations of real GDP and the price level at which the economy of Atlantia is in macroeconomic equilibrium. The economy is initially at point A. Atlantia's Central Bank then increases the quantity of money year after year. Draw the necessary curves in the figure to show the effects of this on Atlantia's real GDP and price level.
a)What happens to Atlantia's potential GDP?
b)In the short run, what happens to aggregate supply and aggregate demand?
c)What are the new short-run equilibrium real GDP and price level?
d)In the long run, what happens to aggregate supply and aggregate demand?
e)In the long run, what process is unfolding?
405)The figure above shows the initial aggregate demand curve, AD0, the initial short-run aggregate supply curve, SAS0, and the long-run aggregate supply curve, LAS. The points in the figure show possible
combinations of real GDP and the price level at which the economy of Atlantia is in macroeconomic equilibrium. The economy is initially at point A. Then, Atlantia's oil producers form a price-fixing
organization and increase the price of oil. Suppose that potential GDP does not change and that Atlantia's Central Bank takes no action. Draw the new aggregate demand and short-run aggregate supply curves in
the figure to show the effects of this event on Atlantia's real GDP and price level.
a)What happens to aggregate supply and aggregate demand?
b)What are the new equilibrium real GDP and price level?
c)Will the rise in the price of oil lead to inflation in Atlantia? Why or why not?

406)The figure above shows the initial aggregate demand curve, AD0, the initial short-run aggregate supply curve, SAS0, and the long-run aggregate supply curve, LAS. The points in the figure show possible
combinations of real GDP and the price level at which the economy of Atlantia is in macroeconomic equilibrium. The economy is initially at point A. Then, Atlantia's oil producers form a price-fixing
organization and increase the price of oil. Suppose that potential GDP does not change and that Atlantia's Central Bank responds by increasing the quantity of money. Draw necessary curves in the figure to show the effects of this on Atlantia's real GDP and price level.
a)In the short run, what happens to aggregate supply and aggregate demand?
b)What are the new short-run equilibrium real GDP and price level?
c)In the long run, if Atlantia's continue to hike the price of oil and the Central Bank continues to increase the quantity of money, what happens to aggregate supply and aggregate demand?
d)If Atlantia's oil producers continue to hike the price of oil and Atlantia's Central Bank responds by increasing the quantity of money, what process unfolds?
407)The figure above shows the initial aggregate demand curve, AD0, the initial short-run aggregate supply curve, SAS0, and the long-run aggregate supply curve, LAS. The points in the figure show possible
combinations of real GDP and the price level at which the economy of Atlantia is in macroeconomic
equilibrium. The economy is initially at point A. Then, the government increases its expenditure on goods and services. Draw the new aggregate demand and short-run aggregate supply curves in the figure to show
the effects of this event on Atlantia's real GDP and price level.
a)What happens to Atlantia's potential GDP?
b)In the short run, what happens to aggregate supply and aggregate demand?
c)What are the new short-run equilibrium real GDP and price level?
d)In the long run, what happens to the short-run aggregate supply and aggregate demand?
e)What are the new long-run equilibrium real GDP and price level?
Labor |
Real GDP |
(millions of hours |
(millions of 2000 |
per year) |
dollars) |
200 |
6,800 |
240 |
7,680 |
280 |
8,400 |
320 |
8,960 |
360 |
9,360 |
408)The table above shows the aggregate production function in the economy of Prescottia. The people of Prescottia pay no taxes and are willing to work 248 million hours a year for a real wage rate of $8 an hour, and for each dollar increase in the real wage, they are willing to work 4 million additional hours per year.
a)Draw the economy's aggregate production function.
Wage rate |
Quantity of labor demanded |
(dollars per hour) |
(millions of hours per year) |
24 |
200 |
20 |
240 |
16 |
280 |
12 |
320 |
b)Prescottia's demand for labor schedule is in the table above. Draw Prescottia's demand for labor and supply of labor curves.
c)What are the economy's full-employment quantity of labor and real wage rate? What is the country's