


72 Data Exploration in Power Query
The recipes that will be explored in this chapter are listed here:
•Exploring Power Query Editor
•Managing columns
•Using data profiling tools
•Using Queries pane shortcuts
•Using Query Settings pane shortcuts
•Using Schema view and Diagram view
Technical requirements
For this chapter, you will require the following:
•Power BI Desktop (https://www.microsoft.com/en-us/download/ details.aspx?id=58494)
•A Power BI Pro license and access to the www.powerbi.com portal
•A Power BI workspace on the Power BI service
The minimum requirements for installation are listed here:
•.NET Framework 4.6 (Gateway release August 2019 and earlier)
•.NET Framework 4.7.2 (Gateway release September 2019 and later)
•A 64-bit version of Windows 8 or a 64-bit version of Windows Server 2012 R2 with current Transport Layer Security (TLS) 1.2 and cipher suites
•4 gigabytes (GB) disk space for performance monitoring logs
You can find the data resources referred to in this chapter at https://github.com/ PacktPublishing/Power-Query-Cookbook/tree/main/Chapter03.
Exploring Power Query Editor
The aim of this recipe is to illustrate and describe the different sections of Power Query. The tool's design is studied to offer you an intuitive experience, and it is important to understand its logic to get the biggest benefit from it.
Exploring Power Query Editor 73
Getting ready
For this recipe, you need to have Power BI Desktop running on your machine.
How to do it…
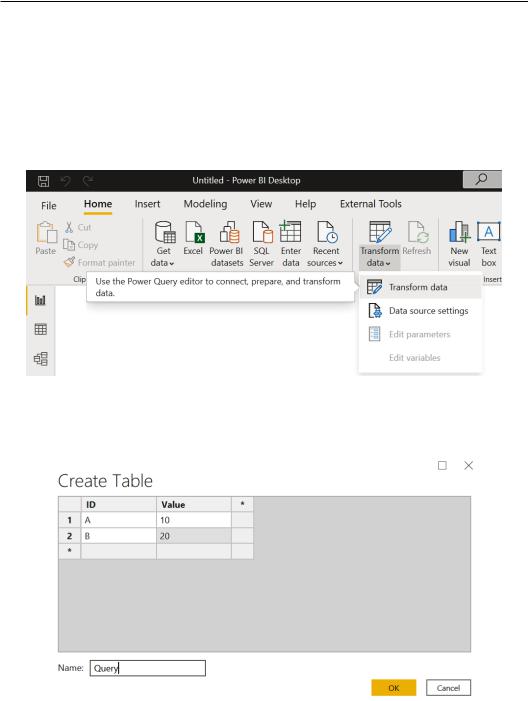
Once you have opened Power BI Desktop, perform the following steps: 1. Click on Transform data to open an empty Power Query interface:
Figure 3.1 – Opening Power Query
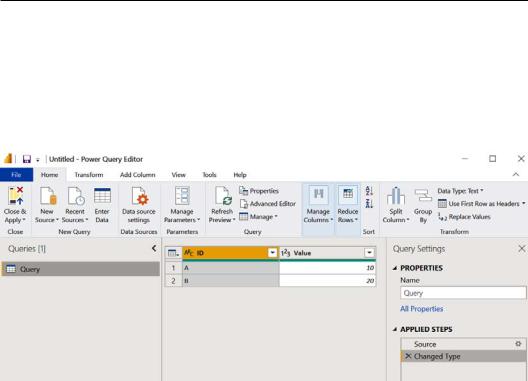
2.Click on Enter data and create a table by creating two columns, ID and Value, and by entering values, as shown in the following screenshot:
Figure 3.2 – Entering data
74Data Exploration in Power Query
3.Click on OK.
The idea is to have an example query to illustrate the different Power Query user interface (UI) sections because, in this way, you will have all the different buttons under each tab activated.
It is possible to explore the Power Query interface to discover shortcuts and sections that will help you transform and enrich your data:
Figure 3.3 – Power Query UI
Generally, the UI can be divided into the following sections:
•The query ribbon includes six tabs:
a)Home: This section consists of the most common tasks that you typically perform with Power Query. You can connect to a data source, expand data source settings, create and manage parameters, refresh queries' previews, and access the
Advanced Editor.
You can also perform some simple tasks such as selecting a subset of data (choosing columns and rows to be kept), splitting columns, replacing values, and grouping data.
You can append and merge queries and access more advanced features, such as
AI Insights.
Exploring Power Query Editor 75
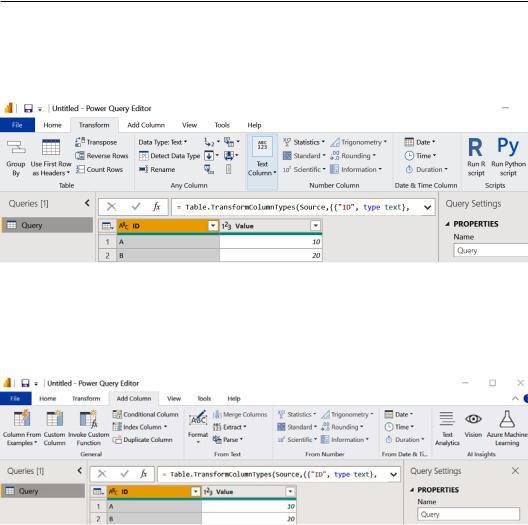
b)Transform: This section includes tasks that transform existing data. You can pivot/unpivot columns and rows, replace values, apply calculations on columns, define data type formats, and you can also run Python and R scripts on data in the selected query:
Figure 3.4 – Transform tab
c)Add Column: This tab enables you to enrich data and add new information that originates from existing data. It is possible to add conditional or custom columns, extract values, and apply numeric calculations. From this section, you can apply
AI Insights:
Figure 3.5 – Add Column tab
76Data Exploration in Power Query
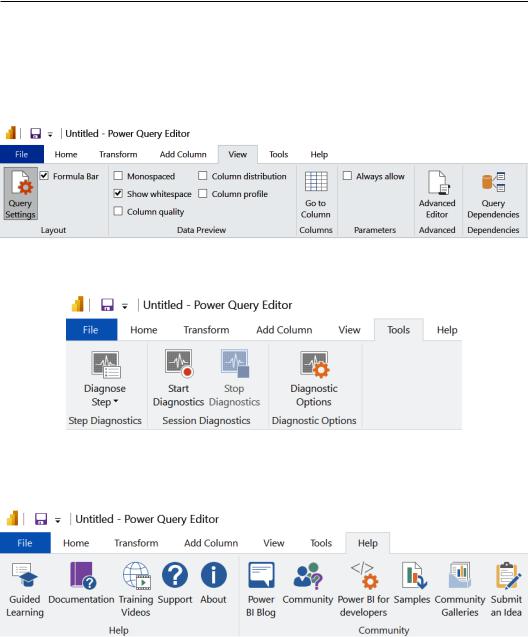
d)View: This section allows you to enable or disable the view of certain sections of the Power Query UI—for example, the Query Settings pane and the Formula Bar. Tools for data quality analysis are located under this tab, and the Advanced Editor can be accessed from here as well. Moreover, it is possible to open the
Query Dependencies window:
Figure 3.6 – View tab e) Tools: This section contains Diagnostics tools:
Figure 3.7 – Tools tab
f)Help: This tab allows you to have quick access to learning resources, Power Query documentation, and community blogs and web pages:
Figure 3.8 – Help tab
Additionally, in the Queries section in the left-hand pane, you can find a list of the current Power Query session queries.
Exploring Power Query Editor 77
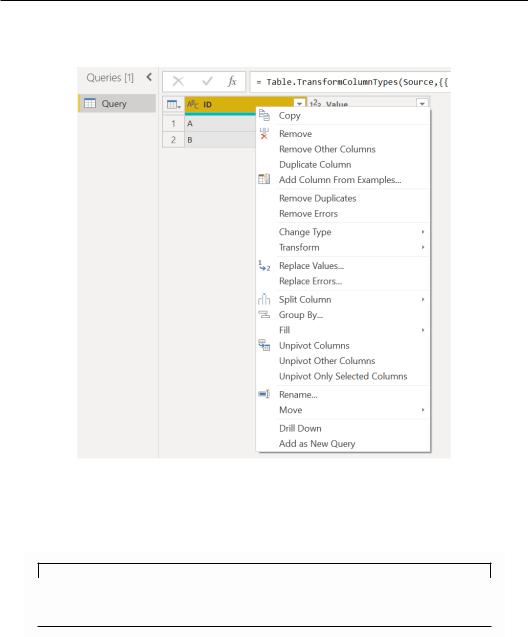
The central table view shows the data from the selected query. You can perform some steps directly from the table view by right-clicking on the column name:
Figure 3.9 – Table view shortcut
The Query Settings section on the right shows all the applied steps that you do while transforming and enriching data. In this way, every data type change, new column addition, or new calculation performed can be traced.
Note
It is important that you are aware of how the UI is organized in order to be able to quickly find and access the transformations you need.