

SPWLA-2013-RR
.pdfSPWLA 54th Annual Logging Symposium, June 22-26, 2013
EAGLE FORD SHALE LOG EXAMPLE
An example interpretation of wireline logs from an Eagle Ford Shale well is shown in Figure 12. The well, drilled with oil-based mud, is approximately located as indicated by the blue circle on the map in Figure 6. The logging suite included spectral density, neutron porosity, natural gamma-ray spectroscopy, neutron-induced gamma-ray spectroscopy, compressional and shear acoustic, array resistivity, and nuclear magnetic resonance logs.
800
900
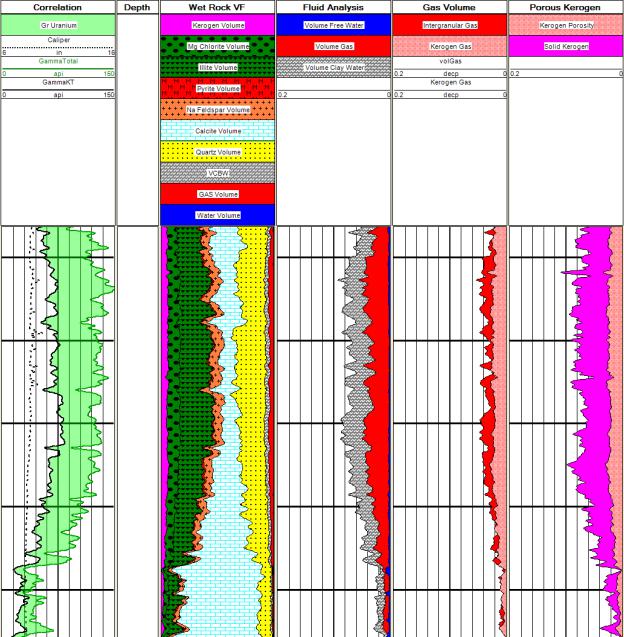
Fig. 12 Eagle Ford Shale example log showing computed formation mineral and fluid volumes and a breakout of hydrocarbon contained in kerogen porosity.
Track I of Figure 12 contains caliper, natural gamma ray from potassium and thorium decays, and total natural gamma ray logs. A probabilistic error minimization approach was used to compute the mineral and fluids evaluation displayed in Track II. An expanded breakout of the formation pore fluids is shown in Track III. The computed oil volume is split into intergranular (porous mineral) and kerogen (organic porosity) components in Track IV and Track V shows the porous kerogen volume, which consists of oil-filled kerogen porosity and solid kerogen.
11
SPWLA 54th Annual Logging Symposium, June 22-26, 2013
Theoretical log response equations are required for each sensor used to carry out the calculations in the error minimization log interpretation technique. For this study, the response equations were constructed in terms of formation mineral and fluid volumes and the response parameters for each constituent following the pattern of Equation 5. Linear mixing laws were followed for most sensors but some, such as neutron and resistivity, involved more complicated nonlinear functions. The idea was to solve the system of simultaneous theoretical tool response equations for the mineral and fluid volumes that gave the best match to the logs.
Information from core X-ray diffraction (XRD) measurements guided the selection of minerals used to interpret the logs. An initial organic matter hydrogen index of 664, obtained from immature core samples in a nearby well, was used to define a carbon lability of 0.5645 for this well. A transformation ratio of 0.4921 was found for this well by using the nomograph in Figure 5 to analyze data from core pyrolysis measurements. Working with Equation 3, the porosity associated with kerogen estimated for this interpretation was:
Φk Cc k TR TOCk 0.5645 1.118 0.4921 0.773 0.24 v/v. |
(10) |
Based on the results in Figure 12, the computed kerogen oil volume represents 51% of the total hydrocarbon volume and 25.5% of the total storage capacity of the organic-rich reservoir in this well.
HAYNESVILLE SHALE LOG EXAMPLE
Figure 13 shows an interpretation of wireline logs from a Haynesville Shale well drilled with water-based mud. A full suite of wireline logs consisting of spectral density, neutron porosity, natural gamma-ray spectroscopy, neutroninduced gamma-ray spectroscopy, compressional and shear acoustic, and array resistivity logs were used to perform the interpretation. The interpretation workflow was greatly aided by using core XRD measurements to choose the suite of minerals included in the analysis and Leco TOC measurements were used to calibrate a log-derived TOC content using the Delta Log-R technique (Passey, 1990).
Track I of Figure 13 shows natural gamma ray from thorium and potassium decays and total natural gamma ray logs acquired with a natural gamma-ray spectroscopy tool. A caliper log is also shown in Track I. Track II contains volumetric mineral and fluid results. Track III presents fluid volumes on an expanded scale and Track IV shows the partitioning of the gas volume into gas-filled kerogen porosity and gas-filled intergranular porosity. Track V displays the calculated porous kerogen volume.
The empirical value of 0.3 v/v for the porosity associated with the Haynesville Shale kerogen was used to compute the results in Figure 13. The results show approximately 63% of the calculated reservoir gas volume is present in porous kerogen and the remainder exists in conventional intergranular porous mineral pores. Kerogen porosity calculated from the logs represents 61% of the reservoir’s storage capacity.
In this example, where organic porosity comprises the majority of the hydrocarbon storage capacity, it is easy to imagine the long-term reservoir performance would be dominated by the organic porosity. Electron microscopy studies have shown that production from intragranular kerogen porosity must occur through micro fractures created during the expulsion of hydrocarbons when the reservoir’s intergranular porosity was charged. These micro fractures are small features, a few tenths of a nanometer wide, which restrict the flow of intra-kerogen hydrocarbons. This explains decline curves frequently observed in source rock reservoirs because production from the organic porosity would occur at a significantly lower rate compared to production from the conventional porous mineral porosity.
12
SPWLA 54th Annual Logging Symposium, June 22-26, 2013
700
800
Fig. 13 Interpretation results for a Haynesville Shale well showing computed intergranular and porous kerogen gas volumes.
CONCLUSIONS
Calculation of kerogen porosity from logs is well-suited to log interpretation procedures that are built around multitool, multimineral probabilistic error minimization methods. Modifications to the traditional tool response equations to support porous kerogen were proposed to represent the formation kerogen pore volume without introducing an additional unknown.
A few key parameters are required to obtain kerogen porosity estimates from logs. Various techniques were demonstrated to illustrate how these parameters can be determined for a reservoir or on a well-by-well basis as may be required. More than one technique should be investigated if possible, and the technique that leads to the smallest porosity associated with kerogen should be used. We believe this may avoid over-
13
SPWLA 54th Annual Logging Symposium, June 22-26, 2013
estimation of kerogen porosity in cases where compaction of kerogen macerals may have occurred during hydrocarbon expulsion.
As shown in the example logs, kerogen porosity accounts for a substantial fraction of the storage capacity in source rock reservoirs making it an important reservoir assessment parameter.
Using logs to determine the amount of kerogen porosity is an efficient and cost-effective way to obtain complete coverage of productive intervals compared to discreet core measurements performed on a scale that doesn’t represent the bulk rock.
Log-derived kerogen porosity values can be used to improve reservoir performance predictions from source rock reservoir simulators.
ACKNOWLEDGEMENTS
The authors would like to acknowledge BP America and EF Energy for releases of the log data and core analysis data used in this and previous studies.
REFERENCES
Braun, R. L., and Burnham, A. K., 1987, “Analysis of chemical reaction kinetics using a distribution of activation energies and simpler models,” Energy and Fuels, v. 1, p. 153–161.
Burnham, A., K, 1989, “A simple kinetic model of petroleum formation and cracking,” Lawrence Livermore
National Laboratory Report UCID-21665.
Cardneaux, A. P., 2012, “Mapping of the oil window in the Eagle Ford Shale play of Southwest Texas using thermal modeling and log overlay analysis,” MS Thesis, Louisiana State University, Baton Rouge, LA.
Condon, S. M. and Dyman, T. S., 2006, “2003 geologic assessment of undiscovered conventional oil and gas resources in the Upper Cretaceous Navarro and Taylor Groups, Western Gulf Province, Texas,” in Petroleum Systems and Geologic Assessment of Undiscovered Oil and Gas, Navarro and Taylor Groups, Western Gulf Province, Texas, US Geological Survey Digital Data Series DDS-69-H, Reston, VA.
Curtis, M. E., Ambrose, R. J., Sondergeld, C. H., and Rai, C. S., 2011, “Investigation of the relationship between organic porosity and thermal maturity in the Marcellus Shale,” SPE-144370, paper presented at the SPE North American Unconventional Gas Conference and Exhibition, The Woodlands, TX, June 14–16.
Curtis, M. E., Ambrose, R. J., Sondergeld, C. H., and Rai, C. S., 2011, “Transmission and scanning electron microscopy investigation of pore connectivity of gas shales on the nanoscale,” SPE-144391, paper presented at the SPE North American Unconventional Gas Conference and Exhibition, The Woodlands, TX, June 14–16.
Dahl, B., Bojesen-Koefoed, J., Holm, A., Justwan, H., Rasmussen, E., and Thomsen, E., 2004, “A new approach to interpreting Rock-Eval S2 and TOC data for kerogen quality assessment,” Organic Chemistry, v. 35, p. 1461–1477.
Gas Research Institute, 1996, “Development of laboratory and petrophysical techniques for evaluating shale reservoirs,” Gas Research Institute Final Report GRI-95/0496.
Jarvie, D. M., 2012, “Shale resource systems for oil and gas: Part 1 – Shale-gas resource systems, in J. A. Breyer, ed., Shale reservoirs – Giant resources for the 21st century: AAPG Memoir 97, p. 69–87.
Loucks, R. G., Reed, R. M., Ruppel, S. C., and Jarvie, D. M., 2009, “Morphology, genesis, and distribution of nanometer-scale pores in siliceous mudstones of the Mississippian Barnett Shale,” Journal of Sedimentary Research, v. 79, p. 848–861.
Modica, C. J., and Lapierre, S. G., 2012, “Estimation of kerogen porosity in source rocks as a function of thermal transformation: Example from the Mowry Shale in the Powder River Basin of Wyoming,” AAPG Bulletin, v. 96, no. 1, p. 87–108.
Passey, Q. R., Creaney, S., Kulla, J. B., Moretti, F. J., and Stroud, J. D., 1990, “A practical model for organic richness from porosity and resistivity logs,” AAPG Bulletin, v. 74, no. 12, p. 1777–1794.
14

SPWLA 54th Annual Logging Symposium, June 22-26, 2013
Sweeney, J. J., Burnham, A. K., and Braun, R. L., 1987, “A model of hydrocarbon generation from type I kerogen: Application to Uinta Basin Utah,” AAPG Bulletin, v. 71, no. 8, p. 967–985.
Sweeney, J. J., and Burnham, A. K., 1990, “Evaluation of a simple model of vitrinite reflectance based on chemical kinetics,” AAPG Bulletin, v. 74, no. 10, p. 1559–1570.
Torsch, W. C., 2012, “Thermal and pore pressure history of the Haynesville Shale in North Louisiana: A numerical study of hydrocarbon generation, overpressure, and natural hydraulic fractures,” MS Thesis, Louisiana State
University, Baton Rouge, LA.
Tissot, B. P., Pelet, R., and Ungerer, PH., 1987, “Thermal history of sedimentary basins, maturation indices, and kinetics of oil and gas generation,” AAPG Bulletin, v. 71, no. 12, p. 1445–1466.
Waples, D. W., Suizu, M., and Kamata, H., 1992, “The art of maturity modeling. Part 1: finding a satisfactory geologic model,” AAPG Bulletin, v. 76, no. 1, p. 31–46.
Waples, D. W., Suizu, M., and Kamata, H., 1992, “The art of maturity modeling. Part 2: alternative models and sensitivity analysis,” AAPG Bulletin, v. 76, no. 1, p. 47–66.
Waples, D. W., and Marzi, R. W., 1998, “The universality of the relationship between vitrinite reflectance and transformation ratio,” Organic Geochemistry, v. 28, no. 6, p. 383–388.
Yen, T. F, 1976, “Structural investigations on Green River oil shale kerogen,” in Science and Technology of Oil Shale, Yen, T. F. ed., Ann Arbor Publishers, Ann Arbor, MI, p. 193–203.
ABOUT THE AUTHORS
James Galford is a Chief Scientific Advisor in the Formation Evaluation Technology group at Halliburton. Previously, he was a member of the LWD & WL Sensor Physics group and prior to that, he worked on nuclear magnetic resonance (NMR) petrophysical applications and interpretation. He holds a BS degree in physics from West Virginia University. He has written several technical papers on various logging applications for conventional nuclear and magnetic resonance imaging logs. In addition, he has contributed to a number of patents related to conventional nuclear logging methods and NMR logging applications. He is a member of SPWLA and SPE.
John Quirein is the Petrophysics Team Leader in Formation Evaluation Technology, Halliburton, focusing in interpretation and software development with a recent emphasis on Gas Shale Petrophysics, geochemical log interpretation, and multi-mineral solvers. He received a PhD from the University of Houston, and then worked 10 years for Schlumberger, 12 years for Mobil and the last 13 years for Halliburton. He is a past SPWLA President and is a member of the SPWLA Foundation.
15

SPWLA 54th Annual Logging Symposium, June 22-26, 2013
Don Westacott is a Canadian. He graduated from the University of Alberta receiving a B.S. in Electrical Engineering. During his 33 years he has worked in the E & P industry in Canada, the U.S., Europe, the Middle East and the Far East. Don’s unconventional reservoir analysis work began in the early 1980’s when he worked for
Canadian Hunter Exploration. Don was also employed by Apache Corporation, Carigalli-Hess Malaysia, Restech Houston, and Newfield Exploration. His interest area lead to the publication of applications for NMR applied to reservoir characterization. Don recently joined Halliburton as Principal Advisor, Global Unconventional Reservoirs.
Jim Witkowsky is a Technical Advisor for Halliburton’s Petrophysics Technology Development Group working with GEM elementals and mineral analysis in shale plays. He graduated from the University of Pittsburgh with a degree in Chemical/Petroleum Engineering and began his career in 1986 as a general field engineer for Schlumberger, working primarily in the Gulf of Mexico. He joined NUMAR Corporation in 1992 to 1997 where he held various positions, including NMR field engineer for USA, Indonesia, and Australia, manager of Australia field operations, and petrophysicist. Following the merger, Jim was assigned to the Halliburton Formation and Reservoir Solutions Center as an NMR petrophysicist, responsible for client products, interpretations, and NMR training. He is a member of SPE and SPWLA.
16