

СТАТИСТИКА 1 / Международное энергетическое агентство www.IEA.org / Публикации разные / gas_trading
.pdfdrawing conclusions from this data. Higher volumes traded in the summer could be due to optimisation of flexibility in the incumbents’ contracts. A year on year increase in activity from 2005 to 2006 is likely due to unusually mild weather which caused unused flexibility in incumbents’ contracts to come to the market.
Fig.15: Volumes traded at European hubs14
BCM / year
140.0 |
|
|
|
|
|
|
|
|
|
|
+35% |
|
|
|
|
|
|
120.0 |
|
|
|
|
|
|
|
|
|
|
|
|
|
|
|
|
|
|
+44% |
|
|
|
|
|
|
|
|
|
|
|
|
|
|
|
|
100.0 |
|
|
|
|
|
|
|
|
|
|
|
|
|
|
|
|
|
80.0 |
|
|
|
|
|
|
|
|
|
|
|
|
|
|
+42% |
|
|
|
|
|
|
|
|
|||
60.0 |
|
|
|
|
|
|
|
|
|
|
|
|
+59% |
|
|
|
|
|
|
|
|
|
|
|
||
|
|
|
|
|
|
|
|
|
40.0 |
|
|
|
|
|
|
|
|
|
|
|
|
|
|
|
|
|
20.0 |
|
|
|
|
|
|
|
|
0.0 |
|
|
|
|
|
|
|
|
|
|
|
|
|
|
|
|
|
2003 |
2004 |
2005 |
2006 |
2007 |
2003 |
2004 |
2005 |
2006 |
2007 |
|||||||||||
|
|
|
|
|
Traded volume |
|
|
|
|
|
|
Physical volume |
|
|
|
|
||||
|
Zeebrugge ('00) |
|
|
TTF ('03) |
|
PSV ('03) |
|
PEG's ('04) |
|
|
BEB ('04) |
|
|
CEGH ('05) |
|
|
EGT ('06) |
|||
|
|
|
|
|
|
|
||||||||||||||
|
|
|
|
|
|
|
||||||||||||||
Source: based on TSOs published data
8. Russia’s traded market
The majority of gas used by Russian industrial customers is bought from Gazprom at regulated tariffs, the exact price depends on which of the 13 price zones the customer is located. Regulated prices net of VAT for 2008 are expected to be around 35 euros per 1000m3 for residential users and 45 euros per 1000m3 for non-residential users. As these prices would be unsustainably low in an open market, gas is rationed by only allowing each customer to buy a certain volume. The principles that Gazprom uses to allocate extra quotas are rather opaque. If a customer has a need for more gas, traditionally he has two options, either to ask Gazprom to raise his quota, or, if pipeline capacity is available, to purchase the gas from some of the independent producers at non-regulated prices. The regulated price is the lower one and acts as a floor to the non-regulated price.
In November 2006, Gazprom through its 100% owned subsidiary Mezhregiongaz (MRG), introduced an additional way for industrials to purchase excess gas: via auctions. Initially monthly auctions were held for front-month deliveries, but later the schedule was expanded so now auctions are held every 10 days. For the first year a total of 10 bcm were planned to be auctioned off, with 5 bcm supplied by Gazprom and 5 bcm by independent producers out of total Russian 2006 gas demand of 453 bcm. After this it will be assessed whether the auctions are to continue and whether the yearly volume is to be increased. Customers can bid on gas delivered at three different compressor stations in western Siberia, namely Nadym, Yuzhno Balyksky, and Vyngapurovskoye, through the “Electronic Trading Exchange” (Elektronaya Turgovaya Ploshchadka – ETP). About one day before each auction MRG publishes how much spare capacity Gazprom has in its pipelines running from the three delivery points to the exit zones in which the customers are located. This capacity is then allocated together with the gas to the successful bidders. Since its inception prices at the exchange have been around 120%-140% of the regulated prices, making the state of under pricing clear.
14 In case of PSV, CEGH and BEB only the physical volumes for only the last years were given, while for PEG’s no physical volumes were given. The missing physical volumes had to be estimated. The physical volume (often also the physical throughput) is the amount of gas delivered through the hub at then end, while the traded volume is the amount of gas that has been traded. Because gas can be traded more often before finally delivered, the traded volume is higher than the physical volume. The churn ratio represents the amount of times gas is being traded before it is delivered. Therefore the traded volume divided by the physical volume equals the churn ratio.
51
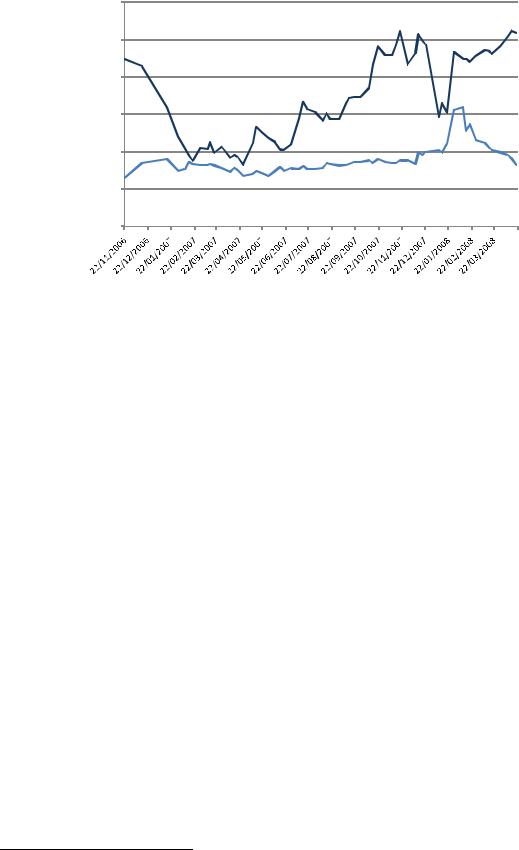
Fig.16: Evolution between TTF and ETP month-ahead prices
|
30.00 |
|
|
25.00 |
|
|
20.00 |
|
MWh |
15.00 |
|
Euro per |
||
|
||
|
10.00 |
|
|
5.00 |
|
|
0.00 |
 ETP
ETP  TTF Month ahead
Source: based on Heren and industry sources
Even though such a market consisting of weekly auctions completely dominated by one single player seems very far from the more liquid gas hubs of Western Europe in terms of market design, Gazprom’s reasons for launching the ETP are relevant for these markets as well. First and foremost it is of importance to Gazprom that the current situation where gas is priced below the market is addressed, since both overconsumption and under-investment will result. This is consistent with the current policy of removing all price regulation for the industrial sector by 2011, thus bringing prices up, on a net back basis, to the level charged for exports to the rest of Europe. Such a move will also end the current situation where domestic demand cannot be met but has to be rationed, as well as increasing the general efficiency of the industrial sector by the abolition of artificially low prices.
Whether it will be possible to remove all subsidies within the relatively short time horizon without creating unacceptable disturbances to the local economy is another matter, but it is worth noticing that the “net-back” price is exclusive both of transport out of Russia, and crucially export duties (which are currently 30% of export revenue), so even when prices are fully liberalised within Russia, gas will still be markedly cheaper domestically compared to delivered export prices. Secondly Gazprom considers a market based price important in order to give signals so as to “more accurately identify industry’s real gas needs15”. This last argument is very similar to the idea that the existence of traded hub-based markets will provide price signals as to where and when production and infrastructure investments are most needed.
The future success of the ETP as a competitive market place for gas depends on whether more volumes will be committed to the exchange in the future, as well as on which terms the independent producers will be allowed to compete against Gazprom, notably concerning pipeline access. For the exchange determined price to be robust enough to be used as the benchmark for gas contracts within Russia, Gazprom estimates that 5% – 10%16 (33 to 66 bcm per year) of the industry’s output should be traded at the ETP.
15Source: http://eng.gazpromquestions.ru/index.php?id=19 (May 2008)
16Idem
52

C. Other properties of European hubs
1. Geographical span and capacity constraints
Historically there have been two very different ways of defining the geographical span of a traded commodity market. One way is to assign delivery at a very specific physical point such as the nexus of two pipelines. This is seen in physical hubs such as Zeebrugge, which is defined as being the location within the Fluxys landing terminal of the Interconnector in Zeebrugge (IZT). While it may seem logical at first glance to limit delivery to a specific point, this will imply the necessity of having many such points within a given network. If gas trade within a region is conducted at many different geographical locations in the transportation system, then gas in fact ceases to be a fungible commodity (because the number of products that companies need to be able to trade is multiplied). The more the market is sub-divided, the more that liquidity is diluted, meaning that market zones become more susceptible to manipulation by key players at those points. In other words, defining a commodity market too narrowly reduces what is often seen as its prime benefit – a commodity should be a specific standardised product concentrating liquidity and leading to confidence in the validity of its price. Alternatively, if commodity prices are to mean anything in the real world, they must carry some locational information. Therefore, there is a balance to be made between defining a market so tightly that the locational information is perfect, but liquidity is low, and defining a market so loosely that liquidity is high, but the price gives less useful supply, demand and location signals. When the UK market was liberalised there was a debate as to whether trading should occur on beach terminals (physical points) or at a virtual point. In the end the advantages of having one single market outweighed those of “real” locations, and the NBP was created, the principal reason being to ensure liquidity.
Fig.17: Map of Zeebrugge area
Source: Fluxys
When looking at the Zeebrugge area map (figure 17), it should be obvious how some further aggregation of delivery points in the area was needed. In the limited geographical area around the Zeebrugge harbour, three different pipelines connect with the transmission system, one being the Interconnector at the IZT defining the actual hub, and the other two being the landing terminal of the Zeepipe pipeline (ZPT) and the LNG terminal, thus defining three unique but often highly correlated markets. This system means that if for instance an LNG cargo arriving at the terminal is to be flowed by pipeline to the United Kingdom, capacity has to be booked beforehand not only at the terminal and in the Interconnector, but also from the LNG terminal into the IZT. Huberator, the company running the hub (fully owned by the Belgian TSO Fluxys), has realised this difficulty and has therefore simplified this complex situation by creating the ZEE Platform Service, expanding the traded hub to the two other pipeline points. Under this new service agreement, shippers will have the right to unlimited transfer between all entry points (Interconnector terminal, Zeepipe terminal,
53
LNG terminal and the Zeebrugge hub) without needing to book capacity separately, by paying a flat monthly membership fee plus a certain usage fee for volumes effectively transferred. From February 2008, Huberator offers such unlimited capacity transfers in the Zeebrugge area. Expectations are this will further increase liquidity. The demand and supply of capacity at the three specific points, being un-transparent to the market, will be replaced by a price signal representing the Zeebrugge hub as an entity and not by physical flows
The opposite method to determine where delivery is to take place is by legally defining a “virtual point”, a non-physical point through which all gas in a particular transmission network must flow. This is the case for the British NBP that spans on the whole of the national transmission system. The NBP is the theoretical point through which the operator requires all producers to sell and all buyers to take delivery in the United Kingdom’s network of transmission pipelines. The advantage of such system is that gas becomes a completely standardised commodity having a uniform price no matter where it is delivered within the domestic transmission system. An evident obstacle of this design is if a bottleneck emerges within the transmission system, this could have the potential to force the TSO to reduce capacity in the entire system, instead of only in a specific part of the pipelines. There are several indirect ways in which National Grid can manage such bottlenecks, including its own actions to buy capacity. It is also possible to scale up and down available capacity into the system from the different points receiving domestic production or imports, or into the twelve local distribution zones. National Grid can closely monitor the degree of congestion, optimise system operation, debottleneck with smarter investments, and invest to meet growing transport demand, thus overcoming some of the weaknesses of the “postage stamp” transport pricing system.
The geographical span of the Dutch TTF is designed similar to the NBP, being however more complex with 50 separate entry points into the system and 1100 exit points, compared to the NBP 8 entry and 14 exit points. Moreover, there is only limited access to quality conversion facilities, subdividing the Dutch gas market between the historically important Groningen gas and that from other sources. This means that the design of the Dutch gas market in reality is somewhere in between the virtual NBP and the physical Zeebrugge hub, with respect to standardisation and ease with which gas can be moved to different parts of the system.
When assessing capacity constraints in traded markets, two different aspects are equally important, one is capacity into and out of the geographical area that the market spans, the other is capacity from the traded market to local consumers, usually connected to the distribution network. Also it is not enough only to look at whether unused pipeline capacity is available, but just as much whether this spare capacity is offered equally to all market participants on a fair and competitive basis.
2. Balancing regimes
As actual physical gas supply and demand can vary more rapidly than the timeframe in which commercial action can be taken, all markets may experience imbalances. These can be caused by various factors, e.g. a rapid demand variation, a pipeline disruption, an upstream problem, or a downstream interruption. As imbalances are a normal feature of markets, it is necessary for network operators to have some flexibility to ensure that the pressure of the system they manage is kept within its physical constraints.
Any balancing action by the TSO incurs costs to the system; therefore it is better for the TSO to operate in an environment where all major market participants are actively incentivised, through the market design, to have balanced portfolios. In this way, it is only in a minimum of events that the TSO should step in and take balancing actions.
In Europe two different time frames, or balancing periods, exist for dividing the balancing responsibilities between the TSO and the other actors in the market. Most TSOs require daily balancing, meaning that the each shipper’s flows into and out of the system must be balanced by the end of the gas day. Within each day, it is the responsibility of the TSO to balance the system. There are however a few countries, most notably Germany, the Netherlands, and Austria (for its domestic system), which require hourly balancing. The advantage of hourly balancing is that it makes those customers who have high intraday variability in their demand pay for it, instead of spreading the
54

costs across the whole market17. But there are major drawbacks of having hourly balancing periods: firstly, that it further subdivides liquidity on the market by splitting the commodity in time rather than in geography; and secondly, that it requires the actors on the market to hold a substantial portfolio of hourly flexibility. For new entrants without a substantial supply portfolio, the only way to achieve this is through purchase of high deliverability storage in the market zone, which represents a significant barrier to entry.
As mentioned before, imbalances are a fact of life for the gas industry. Indeed, on a small scale, it will be impossible for physical actors in the market to be fully in balance all the time even if there are no unexpected events. Recognising this, TSOs in general allow shippers to be out of balance within some small technical tolerance, which usually is defined as some percentage deviation in total flows. These imbalance tolerances are charged for the hour (where hourly balancing applies), day and month. Most often there will also be limits not only on imbalances within the different time periods but also on the cumulative imbalances. In some cases the TSO offers to sell additional tolerance services to shippers, such as Energinet (the Danish TSO) does at its GTF (Gas Transfer Facility). Most commonly, however, requirements for additional services can be met by purchasing unused tolerance services from other shippers. In some instances imbalances can also be traded amongst shippers. For example, in Belgium, this can only be done in advance, whereas other TSOs, such as National Grid in the United Kingdom, allow system users to net off imbalances with other shippers retroactively.
Box 6: Cash-out balancing mechanism in the United Kingdom
National Grid is balancing the United Kingdom gas grid through the traded market. If a shipper at the end of the day has injected too much gas in an over-pressured system, he will be penalised by receiving a relatively low price for the extra gas (below the average of the within day deals on the market), giving the shipper an incentive to balance its portfolio. The same applies when at the end of the day a shipper has injected too little gas in an under-pressured system, he will have to pay a relatively high price (higher than the average of the trades) for his shortfall.
National Grid on the other hand rewards shippers that are ‘helping’ keep the system in balance. Shippers who at the end of the day, injected gas above their obligations in an under-pressured system are rewarded as are shippers who injected gas below their obligations in an over-pressured system. To ensure that shippers can respond to this incentive, National Grid posts the pressure of the system to all shippers very frequently throughout the day, allowing shippers to undertake balancing actions, in the hope of being cashed out at a higher price than the within-day price. This arrangement means that the shipper destabilising the system will lose money because of his imbalance, but that the loss will be proportional to the cost of rebalancing the system, while the shipper rectifying the system imbalance may earn money for his actions. When during the day the system becomes too much overor under-pressured, National Grid also has the option to rectify imbalances by buying or selling on the electronic OCM market which is also open outside ordinary office hours.
The TSO can thus to some extent be seen as a form of market maker for within-day gas because it is acting in the balancing market at the end of the day to cash out shippers with imbalances, or during the day if the aggregate system imbalances become too important. This approach provides liquidity to the within-day market, and ensures shippers that in the event of unforeseen imbalances these can be rectified at near market prices.
3. Storage services
The most successful hubs offer a degree of flexibility services, most often in the form of gas storage. The hub operator can offer additional services like short-term parking and loaning of gas. The fundamental demand for storage in any gas system comes from the high variability in daily and seasonal demand for gas compared to the usually limited flexibility in gas production.
17 Power generators benefit from this aggregation as they can quickly increase gas use to respond to peak power needs, while the whole gas market pays for their hourly demand variations.
55
The amount of available storage varies greatly from hub to hub in Europe, but as markets are increasingly interconnected, the amount of flexibility available at a current point is likely to be affected by nearby storage beyond the country or regional borders. One example of such intermarket exchanges of storage has traditionally been seen between the Dutch TTF and the German BEB V.P., where in summer gas has flowed from TTF into German storage to be withdrawn again in the winter. This has historically resulted in the BEB trading at a premium to the TTF in summer and at a discount in the winter. Another example is the interaction between the CEGH and PSV, where gas stemming from excess flexibility in Russian supply contracts going through Baumgarten, where there are large storage facilities, has been bought by Italian companies for use in the PSV market area. As the Italian use of gas for electricity generation increases, it can be expected that flexibility increasingly will be exchanged not only through physical gas flows, but also through the power lines. Gas and electricity sectors may provide flexibility for each other, with important implications, if there are mismatches between the ways in which the two markets work.
When an area with prices mostly based on the traded market, such as the United Kingdom, is interconnected with an area mainly priced on long-term oil contracts, such as continental Europe, this can have particular implications for the use of storage. In times of a gas shortage with supplies from long-term contract being insufficient, the continental utility has the choice to either get more supplies or to interrupt customers. Because of existing public service obligations utilities have a strong preference for increasing supply, even when it is highly priced. This can be seen from the winters of 2004-2005 and 2005-2006, when the NBP acted as a supply of last resource for continental utilities. The volumes being relatively small, the continental utilities have been able to add the high priced gas in their portfolio with a small overall price increase averaged over their supply portfolio. However, the action of these companies on a nearby hub can have quite a dramatic upward effect on price volatility.
The introduction of seasonality and short-term volatility into prices through trade at hubs gives a clear incentive to companies to develop storage facilities which allow delivery to and from the hubs. However, it is difficult to base business decisions on these prices if a lack of transparency makes it difficult to see the fundamentals behind them. In the case of the United Kingdom winter 2005-2006, the behaviour of continental utilities was not based on fundamentals that the market could assess, due to lack of transparency. Therefore, it would be particularly risky to build storage in the United Kingdom in anticipation of the event repeating itself.
Market players’ access to storage services varies greatly from region to region, both in terms of transparency of rules and regulations, and in terms of the amount of uncommitted capacity available. Although the amount of storage is small relative to demand and in absolute terms, the United Kingdom has the most liquid market for storage services. A number of different gas storages exist, the biggest being the Rough storage owned and operated by Centrica Storage, which is under common ownership with Centrica Plc, and therefore subject to strict regulation. Under the terms of British regulations, Rough storage services are offered to the market both through periodic auctions and on the secondary market. Standardised storage packages, also known as “Standard Bundled Units” (SBUs) made up of injection and withdrawal capacity are traded freely amongst market participants. The number of users, who own capacity rights for the Rough storage (39 in 2006), is an approximate indication of its high level of accessibility for third parties to acquire flexibility at the NBP. This number is markedly higher than for access to storage in continental Europe, with the exception of Italy’s Stogit. Stogit operates a storage volume nearly five times the size of Rough on behalf of similar number of users. In the market areas where only a handful of companies have access to a given storage, naturally a secondary market for storage services will be practically nonexistent. It is particularly important in the case where few companies own the majority of storage, that storage is accessible (perhaps as an entry/exit point) from the hub itself, in order to facilitate access for new players.
One significant problem for new entrants who try to gain access to flexibility in continental Europe is the lack of harmonisation and transparency of rules and regulations to which different storage operators are subject. This is particularly important in the case where storage is used across borders. Another prevalent problem is that companies in some markets are given incentives to hoard storage,
56
in particular by the penalising balancing regimes described earlier. Hoarding of capacity is further exacerbated by the majority of storage capacity being booked by long-term contracts.
Proper congestion management can somewhat alleviate this problem by offering interruptible capacity, so that physical utilisation of the storage is maximised. In some markets the so called “rucksack principle”, well known from transport capacity allocations, has been utilised. A supply company who gains a new customer inherits storage services from the former supplier – the storage services are said to be carried with the customer like a rucksack. Such redistribution methods can be used to kick start competition in a largely closed market, but it should be realised that they are not market-based mechanisms. In a rucksack system, the amount of storage in the rucksack carried by each customer must be administratively managed.
In conclusion it seems clear that a significant problem with storage availability in Europe is that the majority of continental storage is reserved on long-term basis, exempted from third party access or unregulated. Whilst it is not a necessary condition for all storage to be regulated, it is clear that storage is essential for gas markets to function effectively. Those markets in which it is not necessary to regulate storage should be readily diagnosed by the variety of owners and operators and their fair and transparent sales methods. As the production flexibility declines with gas output, greater access to storage will become necessary. This change in production capability will make reform to storage markets even more urgent.
4. Preferred framework contracts / Master trading agreements
Commodities trading is characterised by many agents conducting a relatively large number of small block trades in standard products. Therefore a contractual framework suited for this purpose is needed in order to define the terms of the trade, and the nature of the standard product.
Where trading is conducted through an exchange, the exchange will most often require that all members sign up to a uniform contract drawn up specifically for that exchange. This is one of the main advantages of trading through an exchange, since it means a minimum of contract negotiation is required, and with a single counterparty only, namely the exchange. Having only the exchange as counterparty also greatly simplifies the task of managing credit exposure. This is because the products traded on most exchanges are futures, which are financially settled daily, as opposed to forward contracts where payments are conducted after delivery. With strict margin requirements, day to day changes in credit exposure are therefore limited. Furthermore the credit exposure that does remain will be with a single counterparty, namely the clearing house, which most often will be a top rated bank. Especially in the trade of contracts for delivery several months or years into the future, credit concerns are particularly important to address.
Most trading on gas hubs takes place OTC (over the counter), whereby two companies enter into contracts on the basis of a bilaterally negotiated framework. This means that framework contracts, also known as master trading agreements, have to be negotiated with all counterparties with whom a company wants to trade. As these contracts have to govern all legal aspects of gas trading (gas quality, payment terms, credit provisions, force majeure clauses, etc.) their negotiation can be a rather cumbersome process. A number of standard contracts exist, enabling trading arrangements to be drawn up from a menu of standard clauses. As companies are increasingly being active on more than one market, there is a gradual shift towards contracts that, by adding standardised appendices, can be used on multiple markets.
The standard contract of the International Swaps and Derivatives Association (ISDA) has been long favoured especially by banks and other financial institutions. The ISDA initially focused purely on financial derivatives now has appendices for physical gas trading at the NBP and ZBT, as well as for a number of other commodities on different markets. Since many established companies already have ISDAs in place with several banks for other purposes, when they enter into hub-based gas trading they can just add the relevant annex. When entering into master trading agreements with other energy companies, most will however prefer the standard contracts drawn up by the European Federation of Energy Traders (EFET). As the name suggests these are tailored specifically to the trading of energy commodities, primarily natural gas and electricity. As the EFET has published
57
appendices for the most developed gas hubs in Europe (NBP, TTF, ZBT, PEG and PSV), these will suit the legal needs of most short-term trading between energy companies.
5. Trading platforms
A number of different trading platforms exist for the different gas hubs of Europe. These can be divided into exchanges and brokered markets or bilateral without a broker. As will be described in the following each method has its own characteristics and therefore own usage (see table 1).
All exchanges in Europe offer an electronic trading platform where traders can post bids and offers. For example, in the United Kingdom physical futures trading takes place for month ahead and forward on the Intercontinental Exchange (ICE), while within-day and day-ahead trading is conducted on the APX Gas UK (APX). A similar setup exists for the TTF where the ENDEX exchange offers curve trading, while day-ahead trading can be done at the APX Gas NL.
Most trading within the brokered market is conducted as OTC forward trading. Brokers offer electronic platforms similar to those of the exchanges, they also complement this with voice brokering (over a telephone line). One major difference between the exchanges and the brokered market is that at the exchange it is possible (in principal) to accept any deals, while in the brokered market, the only deals allowed are with a counterparty with whom a master trading agreement exists. This means that the situation can arise where a company cannot trade at the best price in the brokered market, simply because it does not have a contract with the counterparty. As it is in the interest of all market participants to have as much liquidity (and speed and low transaction costs) as possible, in the most liquid markets (NBP, TTF and ZBT) it is possible to get some other party to “sleeve” the deal. This means that a third party, with which both companies have a master trading agreement, acts as middleman. This is done on an entirely voluntary basis, and has the potential to increase the credit exposure of the third party. Another possibility is to “give up” the trade to an exchange if one offering this service is active at the current market. The disadvantage of this approach is however that the transaction cost of conducting the trade increases, as it will now include fees to the broker, the exchange and the clearing house.
Another substantial difference between OTC trading and on an exchange is that an exchange-based market guarantees anonymity of buyer and seller. The bilateral nature of the contracts employed in the brokered (OTC) market means that the buyer or seller will have to reveal his identity to the counterparty when a trade has been conducted. While this is a disadvantage for some individual players who want to hide their actions, it also creates increases the transparency in the market.
While exchanges are popular for standardisation, the brokered market is popular because it makes it possible to gauge the market for interest in rarely-traded products. This is particularly valuable for new markets, in which there is lower liquidity and perhaps less confidence in where the over all price level should be (an example might be hourly within-day gas at the TTF).
Finally there is of course the opportunity for a trader to call directly to another company with which a master trading agreement is in place. While this method is only used in a minority of the trading on the most liquid hubs, it is more prevalent at the less liquid ones. It is also something that can be necessary if a change in position occurs outside normal office hours, for instance as a result of interruptions.
6. Transparency
The concept of market transparency covers a wide area of subjects, from information about how the industry decision making process functions, to accessibility to rules and regulations covering the different market areas. Here the focus however will be on two important basic aspects, namely price and physical flow information. Observing prices and physical flows not only gives a snapshot of the immediate state of the market, but also an important overview on storage levels, congestion points in the network, flexibility of supply/demand, and potentially signals as to where future investments are needed.
58
a.Price transparency
A number of daily publications provide price assessments for the European gas hubs (ex. Argus, Heren, Platts). The published assessments are an attempt to describe the price levels at a specific point in time, most often 16:30 GMT. This cut-off time is often referred to as “the close” even though there is no formal closing time of the OTC markets. Many supply contracts exist in which the gas price is indexed to these published price assessments, so some actors will have an interest in where the price stands exactly at the close. At the most liquid hubs, such as the NBP and the TTF, there can therefore be a flurry of trading conducted in the minutes leading up to this point in time.
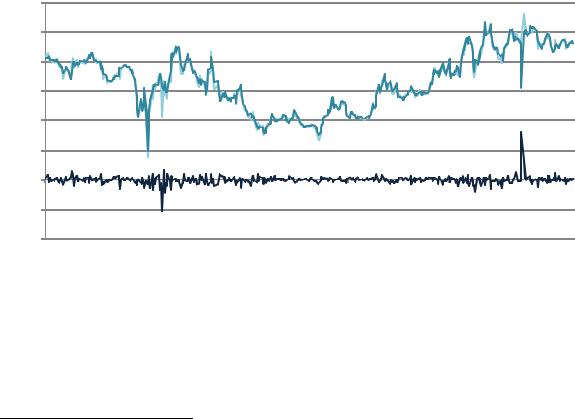
It is argued that certain market players, either buyers or sellers of an index, might have an interest in manipulating the published prices by misreporting trading to the daily price publications. However, the most popular publications have become more or less industry standards, implying a general interest in having reliable published prices. Potential monitoring between traders on reported prices, as well as auditing of the prices used to value the trading portfolios, particularly at important times in the year (end of the month and of the year), provide good reasons to be confident that the published prices in general are a good representation of the market.
For the day-ahead market at the TTF, another source of information on OTC trades exists, namely the price indices published by the London Energy Broker’s Association (LEBA). The “day-ahead index” is the weighted average of all trades brokered, between 08:00 and 17:00 GMT by ICAP, Spectron and Prebon, who between them account for nearly all brokering at the TTF. LEBA also publishes a “dayahead window index”, being the volume weighted average of all day-ahead trades conducted in the time between 16:20 and 16:30 GMT.
Fig.18: Difference between the close day-ahead TTF and the LEBA day-ahead index
|
30 |
|
|
|
|
|
|
|
|
|
|
|
25 |
|
|
|
|
|
|
|
|
|
|
|
20 |
|
|
|
|
|
|
|
|
|
|
|
15 |
|
|
|
|
|
|
|
|
|
|
EUR/MWh |
10 |
|
|
|
|
|
|
|
|
|
|
5 |
|
|
|
|
|
|
|
|
|
|
|
|
|
|
|
|
|
|
|
|
|
|
|
|
0 |
|
|
|
|
|
|
|
|
|
|
|
01-Jun-06 |
01-Aug-06 |
01-Oct-06 |
01-Dec-06 |
01-Feb-07 |
01-Apr-07 |
01-Jun-07 |
01-Aug-07 |
01-Oct-07 |
01-Dec-07 |
01-Feb-08 |
|
-5 |
|
|
|
|
|
|
|
|
|
|
|
-10 |
|
|
|
|
|
|
|
|
|
|
 Heren
Heren LEBA
LEBA Delta (Heren - LEBA)
Source: Heren, Leba
In general there is better transparency on price levels for those trades done on exchanges, since all participants can see all prices that are published and all trades that happen. The exchange will also publish settlement prices for all tradable contracts, often complementing this with information about the volumes traded.
In general therefore, there is abundant information on the level of prices and to some degree on the dynamics of price formation in both exchange and OTC markets, which are of course related18. There
18Exchange prices for a future period will be similar to, but not necessarily the same as, forwards prices for the same period. The difference is due to the nature of the contracts. With the OTC market, profits or losses on trading are realised at a time in the future which corresponds with the period traded, while exchange traded profits are paid out once the deal is closed. The difference in valuation of a future period should therefore be calculated factoring in the cost of financing. This difference is clearly small for month-ahead contracts, but can be substantial for several years in the future.
59

is however an extra layer of information available to the most active players on the OTC markets about the trading patterns of the different companies in the market. This is quite exclusive in that it can only be learned through being present in the market continuously and actively with a large number of counterparties.
b. Physical flow transparency
The level of information on physical flows differs widely from market to market despite the fact that EC regulation (No. 1775/2005) sets out some minimum standards on the publication of flow and capacity information. Notably, TSOs are required to publish capacity information such as: maximum technical capacity, total contracted and interruptible capacity, and available capacity on a regular basis. Often TSO limit themselves to the publication of “historical maximum and minimum monthly capacity utilisation rates and annual average flows at all relevant points”. Furthermore pipelines with less than three capacity holders can have exemption from the transparency requirements, under the so called “three shipper rule” issued from the EC regulation mentioned above.
The lack of firm unified regulation means that the amount of information on physical flows differs widely across the traded markets. The most advanced TSO with regards to publication of flows is the National grid, that every 12 minutes publishes physical flows on the Internet for all entry points into the NBP with a two minute resolution. Also available to shippers daily is detailed information on the flows out of the NBP at the exit points. On the opposite end of the spectrum is a large part of the markets in Germany, where for instance information on physical flows from Poland into Germany is only available to the few capacity holders; it is unavailable to all others, including governmental agencies. The available information on the other traded hubs in Europe in general tends to be at best monthly information again most often only for points with more than two shippers, thus excluding important transit and import pipelines.
Table 1: Comparing trading platforms
|
|
|
|
OTC |
|
EXCHANGE |
BILATERAL WITHOUT BROKER |
|
|
|
|
|
|
|
|
|
CONTRACTS |
|
|
An agreement between the |
|
One agreement with |
An agreement between the |
|
|
|
companies is needed (or use a sleeve) |
|
the exchange |
companies is needed |
|
|
|
|
|
|
|||
|
TRADING |
|
|
Through broker – either Electronic |
|
Electronic platform |
Personal contact |
|
METHOD |
|
|
platform or voice brokering |
|
||
|
|
|
|
|
|
||
|
COUNTERPARTY |
|
|
Other company |
Exchange |
Other company |
|
|
|
|
|
|
|
|
|
|
TRANSACTION |
|
|
Medium |
High |
Low |
|
|
COSTS |
|
|
||||
|
|
|
|
|
|
|
|
|
TRANSPARENCY |
|
|
Good, different publications on end |
|
High, information |
None |
|
|
|
of day prices |
|
given by the exchange |
||
|
|
|
|
|
|
||
|
|
|
|
Company has to reveal it self to other |
|
|
Before deal companies |
|
ANONYMITY |
|
|
|
Anonymous |
already know others’ |
|
|
|
|
company after deal |
|
|||
|
|
|
|
|
|
identity |
|
|
|
|
|
|
|
|
|
|
MAIN USAGE |
|
|
All products |
|
Most liquid products |
Illiquid products and large |
|
|
|
|
volumes |
|||
|
|
|
|
|
|
|
|
|
TYPE OF |
|
|
Framework contract |
|
One agreement with |
Bilateral contract |
|
AGREEMENT |
|
|
|
exchange |
||
|
|
|
|
|
|
||
Source: IEA analysis
60