

СТАТИСТИКА 1 / Международное энергетическое агентство www.IEA.org / Публикации разные / gas_trading
.pdfChapter III – The Crystal Ball – What could the European gas market look like?
I. The North American example of a competitive gas market
Liberalisation in the North American gas market started in 1979. A highly competitive market has evolved along the whole value chain. The first part of this chapter will examine how the North American market is structured, policed and operated, with particular focus on the drivers for new investment. This study is relevant because the future of the European gas market is often described in terms of the current North American gas market. We have to emphasise, however, that the European gas history fundamentals are vastly different from those found in North America. In the second part of this chapter – workable EU competition – we will address how competition can actually develop in the EU, taking into account these differences.
A. The process of deregulation in the IEA North American markets
1. Overview of the IEA North American gas market
The North American market (US and Canada) consumes annually 770 bcm compared to 540 bcm per year in IEA Europe. As a whole, North America is almost self-sufficient, but there is considerable trade between its component parts – overall, the US imports around 14% of total consumption from Canada, although the trade is not unidirectional as the north-eastern US exports gas to Canada.
Before the market was opened to competition, the gas delivery chain had a linear structure which was not dissimilar to the one which has evolved in Europe. E&P companies produced gas, sold it to inter-state pipeline companies, who in turn delivered it to the city gate and sold it to the LDC (Local Distribution Company), who then sold it to the end-user.
The deregulation of the market meant that the roles of the market participants were changed, most significantly the role of the pipeline company. Their role changed from marketing and transportation of gas as a single service, to gas transportation alone. Nevertheless, it was recognized that the expertise of pipeline companies in managing gas transactions as well as in balancing supply and demand would somehow have to be carried over into a structured marketplace. The principal of market centres was proposed. These centres were to be places where services could be provided to customers so that they might manage their own portfolios of supply, transportation, and storage. The federal regulators promoted the concept of the market centres, but left it up to the actors whether to make use of it. Largely due to the key pieces of regulation, which are discussed in the next section, the concept caught on. The North American gas market is now traded as a system of “hubs and spokes”, in which balancing is done at market centres, with pipelines connecting them.
In this new market structure, the market centres manage information flows, producing real-time prices of gas. These prices act as the mechanism of coordination in the market, allowing many specialist companies (including new participants) to emerge. Information which had traditionally been kept inside several vertically integrated companies was available to all players on equal terms, allowing maximum opportunity for the use of resources. This part will describe the North American market by looking at each actor and their interaction with market hubs.
2. The deregulation of the North American gas market
US wellhead price regulations were put in place in 1954 with the Supreme Court’s Philips Decision, meaning that gas destined for inter-state consumption would be produced at government determined prices. Intra-state regulation remained the prerogative of the individual states. At nonmarket based prices, gas did not respond to the realities of the changing US energy market. In the early 1970s, oil prices rose dramatically, but gas prices remained low, driving gas demand. As
61
demand increased, the gas supply was unable to keep up. At the same time unregulated intra-state gas buyers in production regions of Texas and Louisiana were able to outbid regulated tariffs for the scarce gas, intensifying the shortages on the inter-state market to the north.
At the moment that oil prices started to rise, in the early 1970s, Canadian prices were still unregulated. As a result of the gas shortage in the price-controlled US market, more gas was bought in Canada. The export price of Canadian gas increased, leading to higher prices in Canada than in the regulated US market. To avert this, Canada decided to regulate its gas prices in 1975 and have a single border price for exports to the US (Petroleum Administration Act). The regulated gas prices were tied to crude oil prices, export prices were permitted to exceed domestic prices, and the export price premium had to be distributed to all Canadian producers, even the ones that did not have export contracts.
From 1980 the Canadian government became the sole exporter of gas. The government ‘bought’ the gas from the producers, exported it and divided the rents pro-rata to each seller according to his production. After the deregulation of the gas prices in the US in 1979, with the Natural Gas Policy Act of 1978, gas prices increased and gas demand fell. As a result it became difficult for Canada to maintain the regulated tariff and it was decided to deregulate gas prices in 1985 with the Halloween Agreement.
It would take different Federal Energy Regulatory Commission (FERC) and National Energy Board (NEB) orders before the gas prices in North America were finally deregulated in 1993. The most important orders are:
o(US) 1979 – Natural Gas Policy Act of 1978: wellhead price controls were removed through a ‘partial de-regulation’ of wellhead prices. Because of a gas shortage at the time, this act was meant to give incentives for new production, but also to reduce the intra-state purchasing advantage by placing it under pricing regulation. The old contracts would stay under regulated tariffs (in 1993 `The Natural Gas Wellhead Decontrol Act of 1989’ repealed the remaining price regulation), but new contracts were partially or completely deregulated.
o(US) 1984 – FERC order 380: removed contractual minimum bill obligation. The pipeline companies had long-term sales contracts with a minimum bill obligation (referred to in Europe as a Take or Pay commitment). This order was put in place against a background of rapidly falling gas prices, but consumers not being able to make use of it because of the minimum bill obligations in their existing contracts. The removal of this obligation allowed buyers to buy the cheapest gas and escape their commitments for the more expensive gas.
o(Canada) 1985 - Agreement on Natural Gas Markets and Prices (often called the `Halloween Agreement’): deregulation of gas prices. The system of a price regulated Canadian market and a deregulated US market became difficult to manage and Canada decided to deregulate the gas price (while keeping gas transportation regulated). Before the US market was deregulated, Canadian gas exports were higher priced than the regulated US tariffs. Hence, Canada fulfilled the role of swing supplier: when supply was short, the US pipeline companies had to buy Canadian gas. The final blow to this system was FERC order 380, which also applied to US companies purchasing Canadian gas: utilities had no minimum bill obligation anymore. Because imports from Canada were one of the more expensive sources, Canadian exports dropped.
o(US) 1985 - FERC Order 436: allowed pipeline companies, on a voluntary basis, to offer transportation services to customers. With prices (partially) deregulated, a spot market for natural gas arose. However the ability of end-use markets to access spot gas was severely restricted because most inter-state pipeline capacity was controlled by the pipeline companies themselves, which moved only the gas they owned. Transportation rate minimums and maximums were set, but within those boundaries the pipeline companies were free to offer competitive rates to their customers. Although the framework established was voluntary, all of the major pipeline systems eventually took part. As a result the transportation function became the primary function of pipelines, as opposed to offering bundled merchant services.
62

o(US) 1992 – FERC Order 636: required pipelines to separate their sales service from their transportation service and provide all transportation on an equal basis for all gas suppliers. Transportation remained a regulated monopoly but sales were opened to competition. Arguably it was this instrument which was the most significant single instrument in the market opening process, but as set out above, it was one event in a long process of improving market functioning in a period of rapid and marked energy price changes. Storage was also placed on an open access basis.
3. The present regulation authorities
In North America there are two levels of regulation: a federal and a state/province19 level. The FERC and NEB are the federal regulators for respectively the US and Canada. Both are independent government agencies and have mandates for inter-state issues. An overview of the mandates of the federal regulators is given in box 7.
Since 2003 the federal regulators of the US, Canada and Mexico have worked closely and meet regularly to share perspectives on regulatory approaches and to work on eliminating inconsistencies. An example is the agreement signed in 2004 between NEB and FERC which reinforces the existing cooperative relationship and further commits each agency to work together to harmonise the regulatory approaches to cross-border projects.
State regulators, often called public service commissions or public utilities boards, have mandates on an intra-state level, not only for gas, but for all types of energy and often also for water, telecommunications, transportation and sometimes even automobile insurance. Opening up the intra-State market to competition is a decision made by state regulators, as a result, some states have opened the residential market for competition and some have not.
The NARUC (National Association of Regulatory Utility Commissioners) and CAMPUT (Canadian Association of Members of Public Utility Tribunals) are overarching bodies providing a forum for the exchange of information and views among its state regulator members (NEB is also a member of CAMPUT).
Box 7: North American federal regulators
The FERC and NEB have the following mandates involving gas:
o Monitoring and investigating energy markets
oApproving the construction of inter-state and international natural gas pipelines and Liquefied Natural Gas (LNG) terminals.
o Approving the construction of storage facilities (FERC only).
o Inter-state pipeline tariffs (in some cases also intra-state pipelines). o Gas production activities not covered by state regulator.
o Approving long-term contracts (NEB only, in the US this is done by state regulators).
4. The role of hubs
Natural gas can be traded or priced at almost any location in North America. Over time, some pricing points have evolved into trading hubs. This has occurred when multiple buyers and sellers have expressed a wish to transact at the location, and when an infrastructure owner decided to facilitate the trade by providing transaction services. These pricing points then become physical exchanges where gas can be easily bought or sold. Trading hubs have tended to develop at the junction of multiple pipeline interconnections, and usually have access to natural gas storage facilities, allowing the hub operator to offer balancing services, enhancing the trading options for
19 For simplicity reasons, in the following, when referring to a State, we also refer to a Canadian province.
63

buyers and sellers. In North America there are 38 different hubs (29 in US and 9 in Canada). Trading hubs, whether a producing area hub located near a gas supply basin or a market area hub located near a market centre, are characterised by numerous market participants and access to services, such as balancing and title transfer, organised by the hub operator.
Gas transportation and ownership transfer are the most important hub services for the customer. For example, when a shipper with firm capacity on one pipeline wants to deliver gas to an end-user located on another pipeline connected to it via a hub, the shipper can make arrangements to transfer the gas through the hub administrator. The administrator will arrange for compression-adjustment services if the pipelines operate at different pressures. Needed capacity on the receiving pipeline may be acquired at the hub if trading services (or traders) are available. Similarly, the shipper can use the hub's services to revise its nominations on either pipeline, with the centre handling the administrative requirements such as the confirmations process required to effect the transaction. To cover any imbalances that might occur when the receipt/delivery volume exceeds nominated capacity on either pipeline, the shipper can execute an operational balancing agreement with the hub.
If sufficient capacity is available to transport gas between hubs, price differentials between these hubs will represent the marginal transportation costs between the different locations (see map 2). This is because any increase in the differential beyond the costs of transportation will lead to more gas physically flowing – countering the increase. However, if there is no incremental capacity available, price differentials can increase above the transportation costs. Congestion can be caused by many events - temporary congestion due to a disruptive event such as a fire – or systematic congestion in which case it is a signal that supply/demand fundamentals have changed. As we will see later in the discussion on the Rocky Express Pipeline case, systematic price differentials give pipeline companies a clear timely signal and an incentive to build new gas infrastructure between hubs.
Map 2: US natural gas spot prices at major trading hubs, 2006 ($/MBtu)
The boundaries and names shown and the designations used on maps included in this publication do not imply official endorsement or acceptance by the IEA.
Source: FERC - State of the Market Report 2006
64

Changing market conditions impact prices and influence North American gas flows. For example, suppose that the price of natural gas in the U.S. Midwest rose relative to California. In such a situation, Canadian and U.S. natural gas sellers would prefer to sell in the U.S. Midwest because the returns would be higher. More supplies would be offered in the U.S. Midwest and sellers would divert their volumes from California. As more supplies were offered in the U.S. Midwest, the price there would tend to fall; conversely, as less natural gas was offered in California, the price would tend to rise. This process would continue until sellers were indifferent between selling in either market.
Henry Hub and NIT are the most liquid producing hubs in North America (see box 8 for an overview of these hubs). Both are located close to producing regions enabling producers to sell their gas and from here gas flows to consuming regions mostly to consuming hubs.
An example of a consuming hub is the Chicago Citygate hub. It is strategically located at a point where different major inter-state pipelines from the Gulf of Mexico and Canada converge, together with different storage sites (aquifer and depleted gas fields). This enables consumers to trade between the different producing areas. With the construction of the Rocky Express Pipeline, the Chicago Citygate will indirectly also be linked to the Rocky Mountains producing area (see below), giving more trade opportunities.
Box 8: North American hubs: Henry Hub and NIT
The most liquid hubs in North America are Henry Hub, located at the Gulf of Mexico in Louisiana, and NIT hub (NOVA Inventory Transfer – NIT is often also referred to as Alberta hub or AECO hub) located in the western Canadian Sedimentary Basin in Alberta. Both hubs are located in the largest producing areas of their country and serve different markets. Prices at other hubs typically will be referenced as a differential between Henry Hub or NIT. From Henry Hub, most gas flows to eastern markets and gas from NIT is either used in western Canada or exported to the US. The following elements have made these hubs a success:
o Connected to many large pipelines serving different markets (Henry Hub: 14 and NIT hub: 6).
oLarge volume of gas flows (Gulf of Mexico: 20% of US production, western Canadian Sedimentary Basin: 80% of Canadian production). Henry Hub is also connected to the country's largest grouping of LNG regasification terminals.
o Connected to high deliverability storage facilities.
oPrices and other relevant information available. Delivery point of exchanges (Henry Hub: Nymex, NIT: NGX).
o Many different types of buyers and sellers. o Large daily volume of transactions
Timely, transparent, accurate and affordable price information for market players is vital when making market decisions. There are different sources to get information. Firstly there are the independent energy trading platforms (such as ICE, NYMEX, NGX or TradeSpark, among others). They publish subscription-based spot price information for multiple locations in North America.
Secondly there are previous-day gas prices which are available for various gas trading points in the United States and Canada. These are available through several trade press publications also on a subscription basis. The information of the underlying trades are based on a network of individual market traders, the details on the transaction and prices are provided by the parties involved in the trades, rather than by the centres. This price information has been used extensively as a source for price indexing of gas-purchase contracts. Following the collapse of Enron’s on-line energy trading platform in 2001, such price indexing came under close scrutiny. Investigation discovered that some traders reported daily trade erroneously at times, perhaps in an attempt to influence market behaviour. In 2003 FERC and the Securities Exchange Commission developed voluntary guidelines for gas price reporting that are intended to eliminate similar abuses in the future.
65
In addition the Energy Information Administration (EIA) of the US Department of Energy reports various historical monthly prices (wellhead, import, city gate, residential, commercial, industrial and power generator prices) split by state. Besides prices, the EIA also publishes historical data on production, exploration and reserves, imports/exports, storage and consumption again all split up per state. This data give much transparency to the North American market.
B. The physical market / the value chain
1. Upstream: role of producers
The upstream gas sector is highly competitive, with literally thousands of producers in the US and hundreds of producers in Canada (in stark contrast to Europe). The market share of each individual producer is small. In the US for instance there are around 20 to 30 major gas producers, often (but not always) also major oil companies, but the market share of the largest producer is approximately 3 to 4%.
The upstream players sell the gas they produce on the hub against a daily index price which represents for them the “fair price of gas”. Because the daily index price is set by supply and demand of gas, these companies get a direct financial incentive to increase production when gas prices are increasing. Therefore a normal reaction for them would be to increase production if possible – in the short term through surge production, in the longer term through increased production drilling and exploration. This can be demonstrated by the high correlation between drilling rates and gas prices, usually with a time lag of 6 months.
The majority of the gas consumed in the US is produced domestically (84%), with most of it coming from the Gulf of Mexico, Texas and Louisiana. However, as mature areas have declined, so have gas prices been rising. This has led to higher cost reserves becoming attractive, including tight gas and shales as well as coalbed methane. However, there have also been more conventional gas discoveries in the Rocky Mountains area. The Rockies production and associated pipelines provides a good recent example as to how the North American market delivers new supplies.
The remaining gas used in the US is imported. Most of the imported gas comes from Canada (86%), flowing to the north-east, Midwest and western area. The remaining 14% imports come from LNG, with Trinidad & Tobago being the biggest LNG supplier, followed by Egypt, Nigeria and Algeria. Most of the LNG regasification capacity is located in the Gulf of Mexico area, which despite being distant from consuming areas is relatively well connected to other market zones. The US is also an exporter of relatively small volumes of gas to both Mexico and Canada (and Alaska exports a small quantity of LNG to Japan).
2. New midstream players
After deregulation, inter-state pipeline companies changed their focus to gas infrastructure services. The midstream gap that opened was filled by different actors, most prominently the unregulated marketers (in addition to brokers and retail agents) and energy traders. Both these actors make extensive use of hubs.
Independent gas marketers act as middlemen and, in addition to marketing gas supply can arrange for a “package” of sales and transportation services or even arrange demand management services. The difference between marketers and brokers/retail agents, is that marketers actually own the gas, while brokers/retail agents usually do not. Successful marketers add value by saving producers and end-users the trouble of finding each other, by arranging transportation and storage, and sometimes even by arranging financing or assuming price risk. Partly as a consequence, there are now about 250 independent natural gas marketers.
Energy traders, who optimise the system by taking risks, such as basis (or location) risk, timing risk or commodity risk, can be divided into two groups. First are the physical traders; these are players with an actual need for a surplus of gas (a physical position on the market) which they try to
66
optimise. These players are often active on the short-term (spot) and long-term (futures and forwards) market. The other players are financial players, mostly banks, which are most active on the forward/future market.
Many market participants do not wish or cannot tolerate the risk of price fluctuations that occur in the commodity market, e.g. manufacturers offering fixed price products such as ammonia, or even plate glass. Often these risks can be covered through the use of futures contracts with e.g. the NYMEX, or through direct contracts with other counter parties for delivery at a hub. However in some cases a financial services company, trader or bank may be used to offer a fixed price in exchange for a particularly complex trade. For some buyers or sellers, the fee charged by financial service companies is a small price to pay for the services offered, such as price stability.
3. A varying transport structure
Inter-state pipeline tariffs are regulated by the federal regulators, while, apart from a few exceptions, intra-state pipelines are regulated by the state regulator. There is a general framework for setting the cost of transportation. Most often these rates are cost-of-service based, that is, they are set at a level that is expected to generate enough revenues to allow the company to recover its expenses plus an allowed rate of return on assets used in producing the service.
Pipeline tariffs can be divided into a reservation charge and a usage charge. The reservation charge covers all the fixed costs related to the transportation. For companies to reserve pipeline capacity – most often done via long-term contracts – they have to pay the reservation charge. As we will see later on in the case study on the Rockies Express Pipeline, the long-term capacity contracts, sold in an open-season, underpin new investment in pipelines. The usage charge is the price which shippers have to pay when making use of the capacity. Interruptible capacity users generally only pay a usage charge (often higher than for a shipper with firm capacity), because another shipper has already paid for the reservation charge.
4. Storage as a flexibility tool
The role of storage has changed fundamentally since FERC order 636 required pipeline companies to operate storage facilities on an open-access basis. Beside the inter-state/intra-state pipeline companies and Local Distribution Companies, independent storage service providers became owners of gas storage. Storage services have more and more developed as financial instruments; on the NYMEX exchange, a liquid market has emerged for futures and options for natural gas storages.
Access to storage is vital for the proper functioning of gas markets and, in particular, gas hubs. Hub prices and particularly their volatility are directly influenced by available storage levels. A good example of the interaction between price levels on hubs and storage levels was the shortage following the hurricanes Katrina and Rita, as is described in box 9.
Underground storages can be divided into three categories: depleted gas fields, aquifers and salt domes. Each type of storage has its own characteristics such as the working gas capacity, injection and withdrawal rates. Generally, however, only salt domes have high injection and withdrawal rates needed for intra-day balancing, whereas depleted fields and aquifers are more useful for seasonal injection and withdrawal. Gas can also be stored above-ground in LNG facilities and gas tanks, these facilities having a low working gas capacity and a high withdrawal rate.
Most existing gas storage in North America is in depleted natural gas or oil fields. Depleted gas fields have large working gas capacity, and a relatively lower injection and withdrawal rate. They are normally filled in periods of low prices, between April and November and emptied when demand and prices rise, between December and March. In some areas, most notably the U.S. Midwest, natural aquifers have been converted to gas storage reservoirs. The large majority of salt dome storage facilities have been developed in salt dome formations located in the Gulf Coast states.
Since 2000 inter-state pipeline companies have to provide short-term storage services on a hub (FERC Order 637), such as parking (short-term transaction in which the market centre holds the shipper's
67
gas for redelivery at a later date) and lending (short-term advance of gas to a shipper by a market centre that is repaid in kind by the shipper a short time later). While most hubs are connected to storage, some lack access to storage and instead have to use the line-pack (or production flexibility) available to offer short-term storage services.
Box 9: Aftermath of hurricanes Katrina & Rita: dealing with a crisis
In 2005, after hurricanes Katrina and Rita, gas production in the US was heavily affected. With no possibility of increased production or gas imports making up for this shortfall, the US was in a situation in which demand response was needed to overcome a gas shortage. Hurricane Katrina, after striking the south of Florida on 25 August 2005, continued into the Gulf of Mexico, where it did much damage to the region’s oil and gas production before it hit the coast on August 29. Rita, a second large hurricane, struck on September 24. The latter particularly hit much of the region’s natural gas processing capacity. Total shut-in capacity amounted to about 80% of production in the Gulf and 25% of total national production. The few parts of the production chain which were left in operational status, or could be quickly brought back online, often did not correspond to the necessary next or previous step – meaning that where processing plants were available, they often had no gas to process. Conversely, even if platforms and pipelines were either unaffected or readily restored to service, the gas often couldn’t flow to market without treatment.
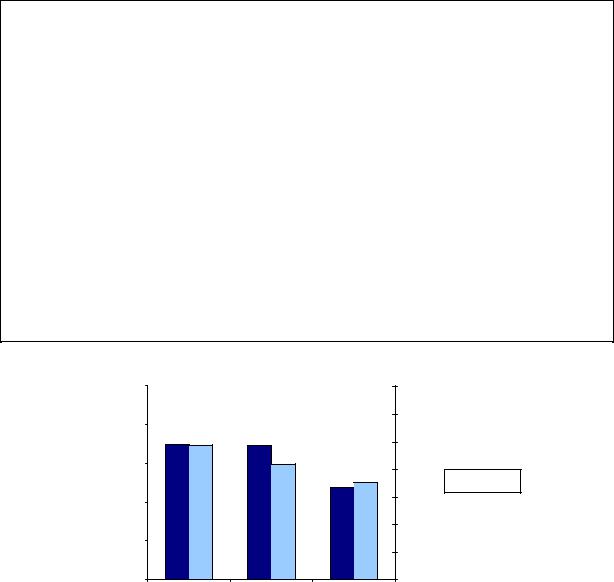
As a result of the loss of gas supply, prices rose and volatility increased. Although spot trading on Henry Hub was not possible for two weeks due to flooding, the price was $16/MBtu when the centre re-opened up from an average of $6.7/MBtu in July. This resulted in demand reduction, particularly in the industrial sector, so that large scale shortages in other sectors were averted. The demand response from the different sectors is represented in figure 19 (originally published in the IEA Natural Gas Market Review 2006).
The market reacted in a logical manner. Draining all storage facilities after Katrina struck could have led to large shortages in winter. However futures prices further increased as the hurricanes struck, which formed an incentive to retain and expand storage levels. Save a short period in which gas was withdrawn from storages in the producing region, this meant that gas continued to be injected into storage facilities – especially in the eastern region.
Fig.19: High prices cause demand reduction in US industry
in September-December |
(bcm) |
Total consumption |
|
100.0
80.0
60.0
40.0
20.0
0.0
captive |
demand |
pass on |
consumers |
reduction |
high gas |
|
|
prices to |
|
|
consumers |
residential & |
industrial |
power |
commercial |
|
|
Source: IEA Natural Gas Market review 2006
3.5 |
(tcf) |
|
2.5 |
||
December- |
||
3.0 |
|
|
1.5 |
Septemberin |
|
2.0 |
|
|
0.5 |
consumption |
|
1.0 |
|
|
0.0 |
Total |
|
|
 average 2001-04
 2005
2005
5. Impacts on the downstream segment
The deregulation of the market and the arrival of hubs represented a major change to consumers. The price of gas is related to supply and demand fundamentals, and consumers (especially larger ones) were directly exposed to changing price signals. Hence gas procurement became an active process, rather than a passive one – when gas prices are high enough, consumers are now able to make a profit by switching fuels or just by reducing gas consumption, through for example industrial users reducing their output by drawing on inventories. As will be shown in this section some end-users are better equipped to make use of these opportunities than others.
68

In a non-liberalised market, demand side response is almost never available, and if so, only on an administered basis; imbalances are solved primarily by increasing supplies (withdrawing more from storages, increasing imports or if possible increasing production). Only in cases of physical gas shortages, will the gas company enforce demand response through interruptible contracts which it has with some of its customers. Interruptible contracts give the supplier the right to interrupt a customer in case of gas shortages. As compensation the customer receives a discount on its gas contract.
In a liberalised market, the price is based on the balance between supply and demand, and thus demand response is used continuously. In cases of gas shortage price signals are perceived quickly by larger users. As the price each consumer is willing to pay is best known by the consumer itself, this results in a more efficient allocation of supplies than when the supplier decides who to interrupt.
a.Residential and commercial users
While Europe opened the residential and commercial markets rapidly to competition, in North America only a part of this consumers group is able to purchase natural gas from another supplier than their incumbent utility company – the decision whether to open the residential market to competition is up to the individual states.
Within the US, twenty-one states and the District of Columbia allow residential users to switch supplier. Seven states and the District of Columbia allow all residential consumers to choose their natural gas suppliers, but a lack of marketer participation has precluded the development of competitive retail markets in three of these states. Six states are in the process of implementing consumer choice state-wide, with programs available to more than half of their residential customers, and another eight states have pilot or partial opening to competition programs in place or awaiting development. The remaining states are not considering residential consumer choice programs. From the 35 million customers who are theoretically allowed to choose their gas supplier, only 12% actually switched to another company.
b. Industrial users
Industrial users are the gas consumers most responsive to prices in the North American market. The group is heterogeneous, with a wide variety of uses and therefore also with different responsiveness to prices, including over time and seasons. It is impossible to evaluate the demand developments from all these different sectors. Box 10 provides the example of the fertiliser industry, which is particularly responsive to price signals.
Box 10: Fertiliser producers in the competitive gas market
The fertiliser industry is a good example of an industry on which the liberalisation of the gas market has had a large impact. Natural gas is the main ingredient of fertiliser manufacture as it is a relatively cheap hydrocarbon and is easily converted to ammonia. Fertilisers are well equipped to actively manage their input costs: they are in general large firms and gas prices are a major part of marginal production costs. Together with ammonia production, fertilisers consume 4% of North American gas (and a similar proportion in Europe).
However, as there are no easy substitutes, the only way for a fertiliser to reduce demand is to reduce production. Fertiliser producers have to make a produce or no-produce decision at high gas prices to prevent it being a loss-making operation. As a result of this price-sensitivity, fertiliser production is one of the gasconsuming industries which are able to provide a large demand response and thereby reduce volatility on the gas market.
During the high gas prices in winter 2005/2006, many fertiliser producers in both North America and Europe had to shut down production. In continental Europe this happened mainly because suppliers interrupted the (interruptible) gas deliveries, while in North America and the British markets fertiliser producers reacted themselves to the increased gas prices. Both in North America and Europe this resulted in a – much needed – reduction of demand.
In general all industrial customers have a “make or buy” decision. This theoretically means that if marginal costs exceed marginal revenue, they will decide not to operate their plants. However in real
69

life this decision is more complicated. First of all, many industrials have a back-up fuel. The decision then becomes a three-way optimisation involving the marginal cost of production from each fuel and the marginal revenue of the product.
Secondly, most industrial users have made a commitment to supply customers. When gas prices are high the producer can try to arrange a settlement with the end-user instead of delivering the product, or buy its product on the market and deliver it to the customer. In the longer run, it can be commercially attractive for an industrial user to hold stocks of either raw material or finished product (quite contrary to the theory of ``just-in-time-management”). Production may be therefore increased in periods of lower gas prices, and decreased when prices are high. The industry will progressively start to take these risks into account when contracting with its own customers.
Not every industrial user will be pro-active in the market, because it requires significant investment (IT, back-up fuel, knowledge, etc). Energy costs must constitute a significant part of total costs; otherwise the costs of actively participating in the market will outweigh the benefits.
c.Power generation
Gas is responsible for one fifth of power generation in North America. The main alternatives – coal, nuclear and renewables – have relatively high up-front investment costs but relatively low marginal costs. In the case of coal, the marginal costs have increased considerably in some areas with the increases in coal prices. Because a power plant will only produce electricity if the marginal costs are covered by the market price of electricity, sources with the lowest marginal cost will be used first, and sources with the highest marginal cost last. Renewables and nuclear are the first to be used, followed by coal and then gas, depending on coal and gas prices. So, often, gas is last in the merit order. In that case gas will then determine the price of electricity. Gas tends to be the fuel meeting expensive peak electricity demands in both winter and summer (air-conditioning load). On a price weighted basis, it contributes to the average cost of electricity much more than its 20% contribution to total electricity production suggest.
Fig.20: US and Canadian electricity generation mix (2006)
US |
Canada |
Source: IEA
As a result gas-fired power generators are relatively less responsive to gas prices’ variations. When electricity demand is too low, they will not produce. And when electricity demand is high enough, producers are able to pass on increases in gas prices into electricity prices. Even when gas prices may be very high, gas-fired power producers will generally not have an incentive to reduce gas consumption, since they are among the only generators who can respond to peaks, and hence set the power price20.
20 However, coal and gas have been competing, and coal prices have increased substantially. Often the final plants in the merit order are open cycle gas turbines, but after that old coal and oil plants may enter the merit order.
70