

Kluwer - Handbook of Biomedical Image Analysis Vol
.3.pdf168 |
Zhu, Lu, and Zhu |
(c)
(d)
Figure 4.2: (Cont.)
scene itself, the pixel values for the same point at registration would not be identical. It is safe to expect that the majority of them will follow some simple and most likely linear relation. When the images are not registered, it is difficult to justify the existence of a simple structure in the joint histogram.
For two images of different modality, one would expect the pixel values at registration to still be related since they are the images of the same scene.

Stereo and Temporal Retinal Image Registration |
169 |
(a)
(b)
Figure 4.3: Joint histogram of images (c) and (d) in Fig. 4.2. (a) Before registration; (b) after registration by mutual information maximization (registration parameters: x and y translations are −4.62 and −2.21 pixels, rotation angle is 0.50◦, and scaling factor is 0.9979).
However, the relationship becomes convoluted. Again, the joint histogram at registration is more structured than at misregistration.
As a demonstration of this joint histogram aggregation concept, we display some joint histograms at registration and at misregistration in the following figures. Figure 4.3 depicts the joint histograms of images (c) and (d) (stereo registration) in Fig. 4.2 before and after registration. The registration parameters are shown in the figure caption. The horizontal direction corresponds to the pixel

170 |
Zhu, Lu, and Zhu |
values in image (c) and the vertical direction corresponds to the pixel values in image (d). The histogram size is 256 × 256. Since the minimum pixel value is not 0 and the maximum pixel value is not 255, the low end and the high end are virtually black, i.e., there are no pixel value pair aggregations there. Along the diagonal, Fig. 4.3b is brighter than Fig. 4.3a, indicating the histogram in (b) is more aggregated.
Figure 4.4 shows the joint histograms of images (b) and (d) (temporal registration) in Fig. 4.2 before and after registration. Again we put the registration
(a)
(b)
Figure 4.4: Joint histogram of images (b) and (d) in Fig. 4.2. (a) Before registration; (b) after registration by mutual information maximization (registration parameters: x and y translations are 65.00 and −4.56 pixels, rotation angle is 0.31◦, and scaling factor is 0.9858).
Stereo and Temporal Retinal Image Registration |
171 |
parameters in the figure caption. The histogram after registration (Fig. 4.4b) is more aggregated than that before registration.
Those joint histograms were normalized before being displayed. The maximum histogram value may be larger or smaller than 255, depending on the image contents and the image size. The maximum histogram value is always normalized to 255 with a nonlinear transformation. The nonlinear transformation is relatively simple. First a linear transformation (x/max) is used to normalize the histogram such that the maximum histogram value is 1.0. A nonlinear transform x0.25 is used to change the histogram such that the small values are enhanced. The resultant histogram values are multiplied by 255 afterwards. Alternatively one can use a logarithmic operation to rescale the dynamic range of the histogram, as employed to display the Fourier transform of an image.
The joint histogram aggregation at registration can be studied and characterized by entropy. Entropy is a measure of randomness. A higher disordered system has larger entropy. If the histogram is well structured, then the entropy of the joint pdf of the pixel values has smaller entropy. In fact, entropy minimization was exploited as a measure for image registration. However, it is too sensitive to the overlapping size of two images. To overcome that mutual information is now used instead. In practice, mutual information maximization proves to be a robust measure for image registration.
For retinal image registration there are four registration parameters. It is difficult to visualize how the mutual information as a registration measure behaves. We use mutual information maximization to register images (b) and (d) (temporal registration) and calculate the mutual information in the vicinity of the optimized solution. For this particular image pair the registration parameters are: x translation of 65.00 pixels, y translation of −4.56 pixels, rotation angle of 0.31◦ and scaling factor of 0.9858. To visualize the mutual information surface in the hyperspace, we fix three registration parameters and change the other one in the neighborhood of the optimal.
Figure 4.5 shows the mutual information values in the vicinity of the optimal x translation while other three registration parameters are fixed. Figure 4.6 shows the results when the y translation is varied around the optimal value. The rotation angle dependent behavior is illustrated in Fig. 4.7. Figure 4.8 displays how the mutual information changes when the scaling factor varies. It can be seen that the mutual information indeed has a maximum value around a good registration. Note that the mutual information is very sensitive

172 |
Zhu, Lu, and Zhu |
− |
− |
− |
Figure 4.5: Mutual information as a function of x-translation offset from a good
registration.
− |
− |
− |
Figure 4.6: Mutual information as a function of y-translation offset from a good
registration.

Stereo and Temporal Retinal Image Registration |
173 |
−
Figure 4.7: Mutual information as a function of rotation angle offset from a
good registration.
− |
− |
− |
Figure 4.8: Mutual information as a function of scaling offset from a good
registration.
174 |
Zhu, Lu, and Zhu |
to the change in the rotation angle as revealed by the sharp peak in Fig. 4.7. This is expected since a slight change in rotation angle can amount to a very large offset in pixel positions if the distance from the rotation center is large. It is very important to have an accurate estimation of the rotation angle in registration.
4.3.3 Success Rate, Speed, and Accuracy
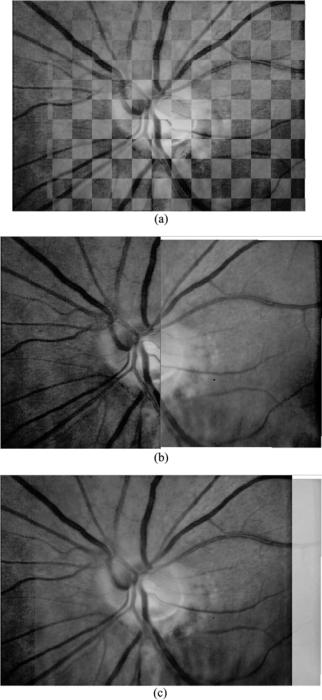
Our implementation of mutual information maximization for retinal image registration works relatively well. Figure 4.9 shows the registration results of Figs. 4.2a and 4.2b (temporal registration). The registration images can be displayed side by side (not shown here). Figure 4.9a shows the two registered images in a checkerboard format, where the size of each checkerboard can be adjusted. Figure 4.9b shows these two images in a moving curtain format, where the vertical line can be moved left or right to check the continuity of the image features (vessels) across the dividing lines. The lines can also be horizontal. To the left of the line is the reference image. The part of the reference image to the right of the line is clipped out by the line and not displayed. To the right of the line is the registered floating image. The left side of the matched floating image is also clipped out by the line and is not displayed. Figure 4.9c shows these two images in an overlay format, where the alpha is 0.5 so one can see one image through the other image. The maximum, minimum, average, absolute difference, color composition, and other fusion methods are also implemented in our software. The color composition selectively extracts the color channels and assigns them to the composite image which is very useful when one inspects the registration and presents the fusion results of color images (for example, red-free and angiograph).
In this section we compare our results against Ritter et al. [5] in terms of success rate, registration speed, and registration accuracy. They used the simulated annealing as the optimization routine. Their program was written in C and their results were obtained on a Pentium Pro 200 running Linux. Our program was written in Java (JDK 1.4.0) and the results were obtained on a Pentium IV running Windows XP. We also ran the program on a Pentium 233 running Windows 95. Their success rate is 100%. On average it takes 1240 seconds. In their implementation they used the nearest neighbor interpolation first and then bilinear interpolation in the last layer of iteration. As one would expect, if
Stereo and Temporal Retinal Image Registration |
175 |
Figure 4.9: Two registered retinal images displayed in (a) checkerboard,
(b) moving curtain, and (c) overlay formats.

176 |
Zhu, Lu, and Zhu |
Table 4.1: Comparison of Ritten et al. and our implementations of mutual information maximization for retinal image registration
|
Ritter et al. |
Our implementations |
|
|
|
Operating system |
Linux |
Windows XP |
CPU |
Pentium Pro 200 |
Pentium IV, 2.4 GHz |
Language |
C |
Java (JDK 1.4.0) |
Interpolation |
Nearest neighbor + bilinear |
Bilinear only |
Optimization |
Simulated annealing |
Simplex |
Multiresolution |
Yes |
Yes |
Subsampling |
No |
Yes |
|
|
|
bilinear interpolation were used in all iterations, it would take longer. Table 4.1 summarizes the differences.
Ritten et al. reported the root mean square error (RMSE) of the registration parameters. For the stereo registration, they are 0.59, 0.52, 0.31, 0.0058 for x and y translations, rotation angle, and the scaling factor, respectively; for the temporal registration, they are 0.29, 0.29, 0.15, 0.0038, respectively.
For this kind of registration the ground truth is unknown. Therefore, it is hard to evaluate its accuracy. Ritter et al. compared their results against the results obtained from the exhaustive search in a limited area [5]. What they assessed is not the mutual information maximization as a registration method, but the simulated annealing as a global optimization scheme. It is well known that the simulated annealing has a large chance to find the global optimal solution. Rather than comparing the results against those of an exhaustive search, we compare our results against the point matching results. In CT/MR/PET/SPECT image registration, point matching is regarded as the gold standard [15], as long as one can identify the corresponding points correctly.
It is possible to identify the corresponding points in retinal images if there are enough vessel trees. Our images are about 5% of the total surface of the retina centered on the optic nerve head. Some retinas have severe degradation. Some images are blurred. The vessels are usually very thick. Thus the corresponding points are not always easy to identify.
The point matching results of temporal image pairs and stereo image pairs were obtained as the average of 4 or 5 independent registrations performed by

Stereo and Temporal Retinal Image Registration |
177 |
two operators. As we mentioned earlier, it is difficult to pair the corresponding points in some image pairs. Thus we have less confidence in their results. For example, in temporal registration, it is difficult to register the images in Set 1. In general, the stereo images are difficult to register by point matching. Nevertheless, the average registrations seem reasonable.
4.3.3.1 Registration of Temporal Images
Visual inspection of the registration results reveals that mutual information maximization succeeded 9 times out of 10 and it failed on lr6/lr7 of set 3. Thus the success rate is 90%. The average registration time was 12.5 seconds with a standard deviation of 3.3.
We can compute the speedup of our implementation against Ritter et al. [5]. Considering the CPU difference and ignoring all other differences, we define the speedup as
speedup = RittersTime · T heirCPUClockRate − 1 O urTime · O urCPUClockRate
Substituting all numbers in, our speedup is 7.27. It is worth pointing out that Pentium Pro and Pentium IV processors have different architectures, thus, this comparison only has indicative meaning.
Define the misregistration as mutual information registration—“true” registration. The mean and standard deviation of these temporal misregistration parameters are (−0.18 ± 1.17, 0.33 ± 0.56, 0.01 ± 0.15, 0.0000 ± 0.0040). Overall, the estimation of the rotation angle and the scaling factors are very accurate. The large errors in the translation offsets are primarily due to those errors related to the first image set.
We also compute the RMSE and they are (1.17, 0.65, 0.15, 0.0040). Those RMSE numbers shall be very much close to the standard deviation reported above for a large dataset. The translation RMSE numbers are larger than what Ritter et al. reported, but the rotation and scaling are better than their results. As we mentioned earlier, it is difficult to register image set 1. Excluding set 1, the RMSE numbers are (0.34, 0.40, 0.06, 0.0020). The RMSE numbers of the translations are comparable to those of Ritter et al., while the rotation and the scaling factor are much better than theirs.