

Neutron Scattering in Biology - Fitter Gutberlet and Katsaras
.pdf


 58
58

 56
56


 38
38


 36
36


 16
16 15
15


510 T. Salditt, M.C. Rheinst¨adter
through the water phases and there is almost no contrast between membrane and water (for X-rays), so no refraction takes place at the water–membrane interface, (ii) due to a decreasing coverage with N the water–membrane interface is much broader and less well defined, again leading to vanishing reflectivity and refraction e ects at this interface. We assume a monotonously decreasing coverage function c(N ) with c(1) = 1 and c(N ) = 0. More details of this approach are discussed in [17].
The thermal fluctuations for a solid-supported stack of lipid bilayers have been calculated in [18] and can be easily included in the structure factor, as well as a decreasing coverage function, or defect densities [19]. In practice, the range of the reflectivity determines the number No of orders, which should be included in the model. The parametrization of n Fourier coe cients can be easily changed by a linear transformation into a parametrization of n (independent) structural parameters of the bilayer, such as bilayer thickness (headgroup peak-to-peak), density maximum in the headgroup maximum, density in the bilayer center plane, density of the water layer, etc.
22.4 Nonspecular Neutron Reflectivity
Thermal fluctuations of lipid membranes on molecular to mesoscopic scales reflect fundamental physical properties of the lipid bilayer, related to thermodynamic stability, elasticity, interaction potentials, and phase transitions [1]. Reciprocally, fluctuations may strongly influence these phenomena, as well as di erent self-assembly properties of lipid membranes. If this interplay is quantitatively understood in simple model systems, more complex biomimetic membrane systems with membrane-active peptides and membrane proteins can be addressed. Thermal fluctuations in lipid bilayer phases have been probed by X-ray and neutron scattering with lineshape analysis, carried out on aqueous bulk suspensions [20, 21]. Multilamellar phases of stacked lipid bilayers exhibiting smectic liquid–crystalline symmetry have received particular attention [20–23]. They allow for a tremendous increase in scattering volume over single bilayer or more dispersed phases. Interaction potentials between neighboring membranes can also be inferred from such studies [20, 21, 24].
However, the full information on the characteristic displacement correlation functions is lost due to powder averaging over the isotropic distribution function of domains in solution. Correspondingly, model assumptions have to be introduced in the data analysis, such as the Caill´e or modified Caill´e models derived from linear smectic elasticity theory. In this model two elastic constants B and K govern the compressional and bending modes of the
smectic phase, respectively. For large bilayer bending rigidity κ kT typical
√
for phospholipid systems, only the combination KB of the two Caill´e moduli B and K = κ/d can be inferred from the measured lineshape exponent
η = πkT /2d2√KB. The second fundamental parameter, the smectic penetra-
tion length Λ = K/B is usually not accessible, unless the bending rigidity becomes small κ kT [20, 21].

512 T. Salditt, M.C. Rheinst¨adter
range of wavelengths λ 2, ··· , 20 ˚A becomes possible, significantly reducing accumulation time. Thus time-dependent white-beam measurements can be carried out without the risk of radiation damage, as is often the case in X-ray scattering. For specular reflectometry, the advantages of TOF, in particular the small accumulation times, have already been well established, e.g., see [27] and references therein. The contrast variation, which is widely used in specular neutron reflectometry [28, 29], allows to label specific molecular groups.
Up to now, only a few studies have presented quantitative analysis of nonspecular (di use) scattering in TOF mode, see e.g., [10, 30–32], and some technical aspects related to resolution and data treatment have to be discussed in more detail or are presently still a matter of debate.
22.4.1 Models of Bilayer Undulations
Multilamellar membrane fluctuations can be described by the linearized free energy density of a 3D smectic liquid crystal [20, 21, 33–36]. On large length scales the finite size e ects and the presence of film boundaries (e.g., at the substrate) become apparent and limit the fluctuation amplitudes σn of the bilayers [18, 37]. On short length scales the bilayer undulations (bending and compressional modes) can be described by the bulk smectic elasticity theory using a discrete displacement field un(r, z) for each bilayer [34–38],
|
N −1 |
|
1 |
|
B |
1 |
|
|
|
2 |
||
A |
|
|
|
|
|
|
|
|
|
|
|
, (22.3) |
2 |
|
d (un+1 − un)2 |
+ 2 |
xy2 un |
||||||||
H = d2r |
n=1 |
|
κ |
|
||||||||
where κ denotes the bilayer bending rigidity, A the area in the xy-plane, N the number of bilayers, and un the deviation from the mean average position nd of the nth bilayer. B and K = κ/d are elastic coe cients, governing the compressional and bending modes of the smectic phase, respectively. Equation 22.3 is called the discrete smectic Hamiltonian, in contrast to the continuum (Caill´e) model, where the sum over n is replaced by an integral. Film boundaries can be accounted for by surface tension terms, which are not included above.
From Eq. 22.3 or similar Hamiltonians that additionally include surface terms, the characteristic height–height (displacement) correlation functions gij (r) = [ui(r ) − uj (r + r)]2 can be calculated [18, 34, 35], describing the self and the cross-correlations of the bilayers labeled by i and j [9, 39].
The height–height self-correlation functions g(r) = g(r, j = i) are a special case of particular interest. The correlation functions are characterized by several length scales: (i) the maximum lateral wavelength of fluctuations ξmax (finite only in thin films, infinite in bulk systems), (ii) the rms fluctuation amplitude of the nth bilayer σn, measured on the lateral length scale ξmax, and (iii) the vertical length scale ξz over which the fluctuations of wavelength

22 Structure and Dynamics of Model Membrane Systems |
513 |
ξmax are correlated, defining the conformality (Fig. 22.5a). The conformality or cross-correlations of the bilayer undulations leads to the presence of di use Bragg sheets in reciprocal space, as can be directly verified from Eq. (22.4).
On length scales r > ξmax the bilayers are essential flat, since the asso-
ciated smectic damping length ξz ξmax2 /Λ, with Λ = |
|
K/B |
excludes a |
|
corresponding relaxation of the profile within the film |
thickness D. The pres- |
|||
|
|
|||
ence of a sharp specular Bragg peak on top of the di use Bragg sheet reflects the flatness of the bilayers on the macroscopic length scale. On length scales r ξmax the fluctuations are not a ected by the the film boundaries and should be described by bulk smectic theory. While ξmax and ξ√z depend on Λ, σ scales with d2 and the dimensionless constant η = πkT /2d2 KB. The diffuse scattering measured in the plane of reflection can be written as a unique transformation of the gij (r) = 2σiσj − 2cij (r), by [9, 39]
|
|
N |
|
|
|
|
LxLy |
|
|
|
|
S(qx, qz ) = |
q2 |
|
∆ρ2 e−qz2σi σj e−iqz (hi −hj ) ij (q) |
(22.4) |
|
|
z |
i,j |
|
|
|
|
|
|
|
|
|
with |
|
|
|
|
|
ij (q) = |
|
||||
drr |
eqz2cij (r) − 1 cos(qxr) , |
(22.5) |
|||
where ∆ρ is the e ective scattering length contrast between the bilayer and D2O, LxLy the illuminated area. The di use scattering is integrated over the direction perpendicular to the plane of incidence (hence over qy ), as in the present experiments. For a point-like detector slit setting, the term cos(qxr) has to be replaced by Jo(q r) with q2 = qx2 + qy2. By insertion of modeled or derived functions for gij (r) in Eq. 22.4, the scattering distribution can be calculated.
In the following, we mainly consider two characteristic quantities: (i) the cross-correlation length ξz (q ) defining the length scale over which a thermal mode is correlated as a function of the corresponding wave vector q , and (ii) the decay of the qz -integrated di use scattering with q , i.e., the structure factor of the fluctuations. The cross-correlation function and the parameter ξz can be deduced from the peak lineshape and width (HWHM) along qz . A Lorentzian lineshape indicates an exponential decrease of the cross-correlations along z with a characteristic length scale ξz = 1/HWHM. Since the HWHM increases with q , ξz depends on the wave vector of the height fluctuations, or conversely, the lateral length scale of the fluctuation. The linear smectic elasticity predicts ξz = 1/(q2Λ).
22.4.2 Monochromatic NSNR Experiments
Using monochromatic neutrons the di use scattering from thermal fluctuations in phospholipid model systems has been investigated in a series of experiments as described in [4, 40]. A typical mapping of the reciprocal space in
514 T. Salditt, M.C. Rheinst¨adter
the region of the di use Bragg sheet is shown in Fig. 22.5d for fully hydrated DMPC in the fluid Lα phase at T = 45◦. The modulations at values of qx, which correspond to the transition from reflection to transmission geometry, is illustrated in Fig. 22.5c and discussed in detail in [4, 40]. With the beam near the sample horizon, the scattering is modified by refraction e ects and evanescent waves. The mapping can be evaluated with respect to the self-correlation and the cross-correlation functions. Most important is the analysis of the de-
˜ |
BZ dqz S(qz , q ), BZ |
cay of the qz -integrated Bragg sheet intensity S(q ) = |
|
denotes one Brillouin zone 2π/d ± π/d. It can be shown |
for stationary fluctu- |
|
ation amplitudes σn = const. that the contributions of the cross-correlation terms in Eq. 22.4 vanish, and that one is left with a curve, which corresponds to the transform of an average height–height self-correlation function or the ef-
˜
fective single-bilayer structure factor S(q ) [41,42]. In many cases, a power law behavior is observed at high q , indicating a corresponding algebraic regime of the real space correlation function at small r.
In Fig. 22.5b the integrated Bragg sheet intensity for DMPC is plotted in double logarithmic scale, illustrating the large range in intensity and parallel momentum transfer, which can be achieved in these measurements. The curve is related to the power spectral density (PSD) of the average fluctuations. In the limit of small qz σ the curves are strictly proportional to the SPD of the average bilayer. At finite qz σ, the intensity decay still contains the information on the PSD, but in addition to the di use component there is a specular peak observed at small qx with a Gaussian lineshape. The specular beam is clearly separated from the di use Bragg sheet. The systematic deviations of the observed lineshape (in particular the asymptotic power law slope) at high q from the predictions of the Caill´e model have independently been found in di use X-ray studies of oriented bilayers, measured at full hydration, and points to the limits of the smectic model. Physical reasons for this e ect are unclear. It is speculated that protrusion modes governing the fluctuations at small distances in the plane of the bilayer could explain this observation.
22.4.3 White-Beam NSNR Experiments
Neutrons in a broad range of wavelengths λ are recorded simultaneously in TOF-NSNR, and registered as a function of their respective TOF, as well as scattering angle on a two-dimensional multiwire detector. Intensity distributions can be obtained without moving any motors as a function of qz and qx. The TOF-NSNR data analysis includes the corrections of the raw data for detector sensitivity, wavelength distribution of the primary beam, resolution, the nontrivial transformation of the detector counts to the intensity matrix I(θ,λ), and/or to the reciprocal space mapping to I(qx,qz ) [25, 43].
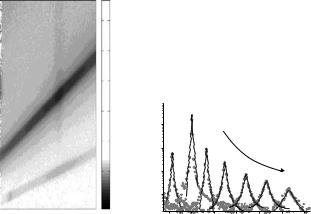
Figure 22.6 shows a representative 2D data set I(2θ, λ) of a multilamellar stack of DMPC in the fluid Lα phase at T = 40◦C. The di erent columns of the multiwire detector matrix correspond to di erent scattering angles 2θ, with
516 T. Salditt, M.C. Rheinst¨adter |
|
||
inferred from the analysis of the |
Bragg sheet width in qz as a function |
||
of q = |
|
, i.e., from the |
|
qx2 + qy2 |
half-width at half-maximum (HWHM) |
||
HWHMqz (q ). The conversion between HWHMλ and HWHMqz is straightforward according to dqz /qz = −dλ/λ. The prediction of the the smectic Hamiltonian in Eq. 22.3 is HWHMqz = Λq2.
Cuts along λ for di erent constant values 2θ (Fig. 22.6) along with leastsquare fits to the predicted Lorentzian lineshape yield the peak width for each angle 2θ. The results can then be plotted and analyzed as a function of
θ= 2θ/2 or correspondingly q . The characteristic broadening with increasing
θaway from the specular peak at θ = 2αi is clearly observed. The curves of HWHM(qx) never go to 0 for qx → 0, due to the intrinsic resolution limited width (instrument, finite size of the sample). Within the limits of resolution and experimental errors, the results of such analysis were shown to agree between monochromatic and TOF-NSNR.
Recently, the propagation of layer perturbation induced by lithographic surface gratings has been mapped by TOF-NSNR to compare thermal to static perturbations, and to have a direct control of the corresponding lateral length scales. In this case characteristic satellites occur in the di use Bragg sheets at the Fourier components of the surface grating [46].
22.4.4 Change of Fluctuations by Added Antimicrobial Peptides
The di use scattering in multilamellar systems changes upon the insertion of membrane-active molecules, such as the antibiotic peptide Magainin 2. In the system DMPC/Magainin 2 we have observed significant changes with changing the peptide-to-lipid ratio P/L, indicating corresponding changes in the fluctuation and elasticity parameters, or perhaps also the defect structure of the lamellar phase. Reciprocal space mappings I(qx, qz ) of the first Bragg sheet were measured in monochromatic mode [11] at partial hydration in the fluid Lα phase for samples of di erent molar ratios P/L = 0, 0.02, 0.01, 0.033, 0.05. Figure. 22.7 shows the reciprocal space mappings for P/L = 0.02, 0.01, and 0.033, from top to bottom (logarithmically scaled). The intensity of the Bragg sheet decreases with increasing P/L and the width (HWHMqz ) of the Bragg sheet increases with P/L. The decay of the intensities is also evident in the reflectivity curves. A corresponding disordering of the lamellar structure, possibly due to both thermal fluctuations and static defects, is observed at high
P/L.
The decay of the specular Bragg peaks and the di use (nonspecular) Bragg sheets is accompanied by an increase in d of the lamellar stack with increasing P/L. This is probably due to electrostatic repulsion of the lamellae stemming from the increasing surface charge density, since each peptide carries about 4–5 net charges at neutral pH. It is interesting to quantify the decrease of lamellar ordering. The obvious approach would be to evaluate the parameters

518 T. Salditt, M.C. Rheinst¨adter
of the smectic model, B and Λ, as a function of P/L. However, the analysis shows that the smectic model can no longer be used to describe the data of the peptide–lipid systems. Only for P/L = 0, we can observe the characteristic parabolic increase in the HWHM values. For higher P/L, the width of the Bragg sheet becomes larger, but approximately constant as a function of qx, apart from the refraction e ects observed at the transition zone where αi changes sign. An appropriate theoretic model is lacking to account for the changes in the di use scattering with increasing P/L, which reflect the lamellar disorder induced by the peptide, including both static defects and thermal fluctuations.
22.5 Elastic and Inelastic Studies
of the Acyl Chain Correlation Peak
While the molecular structure of phospholipid model membranes has been the object of many investigations in the last three decades and is relatively well studied (see, e.g., [1]), the knowledge of membrane dynamics and in particular collective membrane dynamics, even in simple model systems as DMPC, is still scarce. Nevertheless it is now widely acknowledged that several key functions of a membrane cannot be understood without consideration of collective membrane dynamics [50]. The short wavelength dynamics is attributed to play a key role in the transport of small molecules through the membrane [51]. Molecular vibrations, conformational dynamics and “one particle” di usion in the plane of the bilayer can be studied by a number of di erent spectroscopic techniques covering a range of di erent time scales such as incoherent inelastic and quasieleastic neutron scattering [52–54] or nuclear magnetic resonance [55]. The short-range collective motions mentioned earlier can be elucidated only by a few experimental techniques, namely coherent INS and inelastic X-ray scattering.
Figure 22.8 shows examples of some of the motions that can be probed by coherent neutron scattering, as there are bilayer undulation modes with typical length scales of several hundred ˚Angstr¨oms and short wavelength density fluctuations on nearest neighbor distances of the hydrocarbon acyl chains in the plane of the bilayer, which we discuss in the following. Recently Chen et al. made a seminal inelastic measurements in phosphocholine model membranes using IXS techniques [56]. They could determine the dispersion relation in the gel and the fluid phase of DLPC bilayers, finding a minimum at Q0, the maximum of the static structure factor S(Q).
22.5.1 Inelastic Neutron Scattering
We applied INS for the study of the collective dynamics of the hydrocarbon acyl chains in lipid bilayers [57]. The main di erences with respect to inelastic