

- •VOLUME 5
- •CONTRIBUTOR LIST
- •PREFACE
- •LIST OF ARTICLES
- •ABBREVIATIONS AND ACRONYMS
- •CONVERSION FACTORS AND UNIT SYMBOLS
- •NANOPARTICLES
- •NEONATAL MONITORING
- •NERVE CONDUCTION STUDIES.
- •NEUROLOGICAL MONITORS
- •NEUROMUSCULAR STIMULATION.
- •NEUTRON ACTIVATION ANALYSIS
- •NEUTRON BEAM THERAPY
- •NEUROSTIMULATION.
- •NONIONIZING RADIATION, BIOLOGICAL EFFECTS OF
- •NUCLEAR MAGNETIC RESONANCE SPECTROSCOPY
- •NUCLEAR MEDICINE INSTRUMENTATION
- •NUCLEAR MEDICINE, COMPUTERS IN
- •NUTRITION, PARENTERAL
- •NYSTAGMOGRAPHY.
- •OCULAR FUNDUS REFLECTOMETRY
- •OCULAR MOTILITY RECORDING AND NYSTAGMUS
- •OCULOGRAPHY.
- •OFFICE AUTOMATION SYSTEMS
- •OPTICAL FIBERS IN MEDICINE.
- •OPTICAL SENSORS
- •OPTICAL TWEEZERS
- •ORAL CONTRACEPTIVES.
- •ORTHOPEDIC DEVICES MATERIALS AND DESIGN OF
- •ORTHOPEDICS PROSTHESIS FIXATION FOR
- •ORTHOTICS.
- •OSTEOPOROSIS.
- •OVULATION, DETECTION OF.
- •OXYGEN ANALYZERS
- •OXYGEN SENSORS
- •OXYGEN TOXICITY.
- •PACEMAKERS
- •PAIN SYNDROMES.
- •PANCREAS, ARTIFICIAL
- •PARENTERAL NUTRITION.
- •PERINATAL MONITORING.
- •PERIPHERAL VASCULAR NONINVASIVE MEASUREMENTS
- •PET SCAN.
- •PHANTOM MATERIALS IN RADIOLOGY
- •PHARMACOKINETICS AND PHARMACODYNAMICS
- •PHONOCARDIOGRAPHY
- •PHOTOTHERAPY.
- •PHOTOGRAPHY, MEDICAL
- •PHYSIOLOGICAL SYSTEMS MODELING
- •PICTURE ARCHIVING AND COMMUNICATION SYSTEMS
- •PIEZOELECTRIC SENSORS
- •PLETHYSMOGRAPHY.
- •PNEUMATIC ANTISHOCK GARMENT.
- •PNEUMOTACHOMETERS
- •POLYMERASE CHAIN REACTION
- •POLYMERIC MATERIALS
- •POLYMERS.
- •PRODUCT LIABILITY.
- •PROSTHESES, VISUAL.
- •PROSTHESIS FIXATION, ORTHOPEDIC.
- •POROUS MATERIALS FOR BIOLOGICAL APPLICATIONS
- •POSITRON EMISSION TOMOGRAPHY
- •PROSTATE SEED IMPLANTS
- •PTCA.
- •PULMONARY MECHANICS.
- •PULMONARY PHYSIOLOGY
- •PUMPS, INFUSION.
- •QUALITY CONTROL, X-RAY.
- •QUALITY-OF-LIFE MEASURES, CLINICAL SIGNIFICANCE OF
- •RADIATION DETECTORS.
- •RADIATION DOSIMETRY FOR ONCOLOGY
- •RADIATION DOSIMETRY, THREE-DIMENSIONAL
- •RADIATION, EFFECTS OF.
- •RADIATION PROTECTION INSTRUMENTATION
- •RADIATION THERAPY, INTENSITY MODULATED
- •RADIATION THERAPY SIMULATOR
- •RADIATION THERAPY TREATMENT PLANNING, MONTE CARLO CALCULATIONS IN
- •RADIATION THERAPY, QUALITY ASSURANCE IN
- •RADIATION, ULTRAVIOLET.
- •RADIOACTIVE DECAY.
- •RADIOACTIVE SEED IMPLANTATION.
- •RADIOIMMUNODETECTION.
- •RADIOISOTOPE IMAGING EQUIPMENT.
- •RADIOLOGY INFORMATION SYSTEMS
- •RADIOLOGY, PHANTOM MATERIALS.
- •RADIOMETRY.
- •RADIONUCLIDE PRODUCTION AND RADIOACTIVE DECAY
- •RADIOPHARMACEUTICAL DOSIMETRY
- •RADIOSURGERY, STEREOTACTIC
- •RADIOTHERAPY ACCESSORIES
278 PHONOCARDIOGRAPHY
82.United States Food and Drug Administration, Department of Health and Human Services. Guidance for Industry: Population Pharmacokinetics. Availabel at http://www.fda.gov/cder/ guidance/1852fnl.pdf, 1999.
83.Kirkpatrick M, Lofsvold D. The evolution of growth trajectories and other complex quantitative characters. Genome 1989;31(2):778–783.
84.Pletcher SD, Geyer CJ. The genetic analysis of age-dependent traits: modeling the character process. Genetics 1999; 153(2):825–835.
85.(a) Ma CX, Casella G, Wu R. Functional mapping of quantitative trait loci underlying the character process: a theoretical framework. Genetics 2002;161(4):1751–1762. (b) Sheiner LB, Beal S, Rosenberg B, Marathe VV. Forecasting individual pharmacokinetics. Clin Pharmacol Ther 1979;26(3): 294– 305.
86.Rolan P. The contribution of clinical pharmacology surrogates and models to drug development—a critical appraisal. Br J Clin Pharmacol 1997;44(3):219–225.
87.Sheiner LB, Steimer JL. Pharmacokinetic/pharmacodynamic modeling in drug development. Annu Rev Pharmacol Toxicol 2000;40:67–95.
88.Aarons L, et al. COST B15 Experts. Role of modelling and simulation in Phase I drug development. Eur J Pharm Sci 2001;13(2):115–122.
89.Blesch KS, et al. Clinical pharmacokinetic/pharmacodynamic and physiologically based pharmacokinetic modeling in new drug development: the capecitabine experience. Invest New Drugs 2003;21(2):195–223.
90.Piscitelli SC, Peck CC. Pharmacokinetic and pharmacodynamic methods in biomarker development and application. In: Downing GJ, editor. Biomarkers and Surrogate Endpoints: Clinical Research and Applications. New York: Elsevier; 2000.
pp.27–35.
91.Lesko LJ, Rowland M, Peck CC, Blaschke TF. Optimizing the science of drug development: opportunities for better candidate selection and accelerated evaluation in humans. Pharm Res 2000;17(11):1335–1344.
92.Holford NH, et al. Simulation in Drug Development: Good Practices. Draft Publication of the Center for Drug Development Science (CDDS) Draft version 1.0, July 23, 1999, Available at http://cdds.georgetown.edu/research/sddgp723.html
93.Sun H, et al. Population pharmacokinetics. A regulatory perspective. Clin Pharmacokinet 1999;37(1):41–58.
94.Krecic-Shepard ME et al. Race and sex influence clearance of nifedipine: results of a population study. Clin Pharmacol Ther 2000;68(2):130–142.
95.United States Food and Drug Administration, Department of Health and Human Services. Innovation/Stagnation: Challenge and Opportunity on the Critical Path to New Medical Products. Available at http://www.fda.gov/oc/initiatives/criticalpath/, 2004.
96.Mamiya K, et al. The effects of genetic polymorphisms of CYP2C9 and CYP2C19 on phenytoin metabolism in Japanese adult patients with epilepsy: studies in stereoselective hydroxylation and population pharmacokinetics. Epilepsia 1998; 39(12):1317–1323.
97.Bassingthwaighte JB. Strategies for the physiome project. Ann Biomed Eng 2000;28(8):1043–1058.
98.Davidson EH, et al. A genomic regulatory network for development. Science 2002;295(5560):1669–1678.
99.von Dassow G, Meir E, Munro EM, Odell GM. The segment polarity network is a robust developmental module. Nature (London) 2000;406(6792):188–192.
100.Kimko HC, Reele SS, Holford NH, Peck CC. Prediction of the outcome of a phase 3 clinical trial of an antischizophrenic agent (quetiapine fumarate) by simulation with a population
pharmacokinetic and pharmacodynamic model. Clin Pharmacol Ther 2000;68(5):568–577.
101.Nestorov I, et al. Modeling and stimulation for clinical trial design involving a categorical response: a phase II case study with naratriptan. Pharm Res 2001;18(8):1210–1219.
102.Hauber AB, et al. Potential savings in the cost of caring for Alzheimer’s disease. Treatment with rivastigmine. Pharmacoeconomics 2000;17(4):351–360.
103.(a) Jang GR, Harris RZ, Lau DT. Pharmacokinetics and its role in small molecule drug discovery research. Med Res Rev 2001;21(5):382–396. (b) Roberts SA. High-throughput screening approaches for investigating drug metabolism and pharmacokinetics. Xenobiotica 2001;31(8–9):557–589.
104.Roberts SA. High-throughput screening approaches for investigating drug metabolism and pharmacokinetics. Xenobiotica 2001;31(8–9):557–589.
105.Rudy Y. From genome to physiome: integrative models of cardiac excitation. Ann Biomed Eng 2000;28(8):945–950.
106.De Gruttola VG, et al. Considerations in the evaluation of surrogate endpoints in clinical trials. Summary of a National Institutes of Health workshop. Control Clin Trials 2001; 22(5):485–502.
107.Charles BG, Duffull SB. Pharmacokinetic software for the health sciences: choosing the right package for teaching purposes. Clin Pharmacokinet 2001;40(6):395–403.
See also DRUG DELIVERY SYSTEMS; DRUG INFUSION SYSTEMS; RADIOPHARMACEUTICAL DOSIMETRY; TRACER KINETICS.
PHONOCARDIOGRAPHY
HERMAN VERMARIEN
Vrije Universiteit Brussel
Brussel, Belgium
INTRODUCTION
Mechanical heart action is accompanied by audible noise phenomena, which are easy to perceive when the ear is placed next to a person’s chest wall. These cardiovascular sounds can be designated as being weak in comparison with other physiological sounds, such as speech, stomach and intestine rumbling, and even respiration noises. In fact, the latter can be heard at a certain distance from the subject, which is not true for heart noises (provided one overlooks cases of artificial heart valves). The frequency content of heart sounds is situated between 20 and 1000 Hz, the lower limit being set by the ability of human hearing; Mechanical valve prostheses may largely exceed the upper limit. Examination of cardiovascular sounds for diagnostic purposes through the human hearing sense, that is, auscultation, has been commonly practiced for a long time (1–5). The only technology involved is the stethoscope, establishing a closed air compartment between a part of the person’s chest surface and the physician’s ear orifice. This investigation method, however, being completely psychophysical and thus subjective, has proved its benefit and continues to be an important tool in cardiovascular diagnosis.
Phonocardiography (PCG) may simply be defined as the method for obtaining recordings of cardiovascular sound, that is, the phenomena perceivable by auscultation. The origins of the method are strongly anchored in auscultation. The recordings of sounds are evaluated, on paper
or computer screen, possibly in the presence of other synchronous signals (e.g., the electrocardiogram) (ECG), partly psychophysically with another human sense, the eye, in examining waveform patterns and their relation with the other signals. Phonocardiographic signals are examined with respect to the occurrence of pathological patterns, relative intensities and intensity variations, timing and duration of events. Evidently more objective evaluation can be performed ranging from simple accurate timing of phenomena to advanced waveform analysis and comparing recorded results with waveforms from data banks. The importance of auscultation can be explained by the simplicity of the technique and by the strong abilities of the ear with respect to pattern recognition in acoustic phenomena. For obtaining equivalent information with phonocardiography, a single recording fails to be sufficient: A set of frequency filtered signals, each of them emphasizing gradually higher frequency components (by using high pass or band-pass filters), is needed. In this way, visual inspection of sound phenomena in different frequency ranges, adapted by a compensating amplification for the intensity falloff of heart sounds toward higher frequencies, is made possible, thus rendering the method equivalent with hearing performance: pattern recognition abilities and increasing sensitivity toward higher frequencies (within the above mentioned frequency range).
Laennec (1781–1826) was the first to listen to the sounds of the heart, not only directly with his ear to the chest, he also invented the stethoscope and provided the basis of contemporary auscultation. As physiological knowledge increased through the following decades, faulty interpretations of heart sounds were progressively eliminated. The first transduction of heart sounds was made by Hu¨ rthle (1895), who connected a microphone to a frog nerve-muscle preparation. Einthoven (1907) was the first to record phonocardiograms with the aid of a carbon microphone and a string galvanometer (6). Different investigators were involved in the development of filters to achieve a separation of frequency phenomena, as the vacuum tube, and thus electronic amplification became available. The evolution of PCG is strongly coupled with auscultatory findings and the development was predominantly driven by clinicians. A result of this situation is that a large variety of apparatus has been designed, mostly according to the specific needs of a clinic or the scientific interests of a medical researcher. During the 1960s, the necessity for standardization was strongly felt. Standardization committees made valuable proposals (7–9) but the impact on clinical phonocardiographic apparatus design was limited.
During the 1970s and the beginning of the 1980s, fundamental research on physical aspects of recording, genesis, and transmission of heart sound was performed (10– 12) which, together with clinical investigations, improved the understanding of the heart sound phenomena. At the same time, ultrasonic methods for heart investigation became available and gradually improved. Doppler and echocardiography provided information closer related to heart action in terms of heart valve and wall movement, and blood velocity. Moreover, obtaining high quality recordings of heart sound with a high signal-to-noise ratio is difficult. Hampering elements are the inevitable pre-
PHONOCARDIOGRAPHY 279
sence of noise (background noise, respiration noise, muscle tremors, stomach rumbling), nonoptimal recording sites, weak sounds (obese patients), and so on. Thus interest in PCG gradually decreased.
In describing the state of the art, PCG is usually compared with ECG, the electrical counterpart, also a noninvasive method. The ECG, being a simple recording of electrical potential differences, was easily standardized, thus independent of apparatus design and completely quantitative with the millivolt scale on its ordinate axis. Phonocardiography has not reached the same level of standardization, remains apparatus dependent, and thus semiquantitative. Nowadays Doppler echocardiography and cardiac imaging techniques largely exceed the possibilities of PCG and make it redundant for clinical diagnosis. Whereas auscultation of cardiac sounds continues to be of use in clinical diagnosis, PCG is now primarily used for teaching and training purposes and for research. As a diagnostic method, conventional PCG has historical value. Nevertheless, the electronic stethoscope (combined with PC and software), as a modern concept for PCG, may gain importance for clinical purposes.
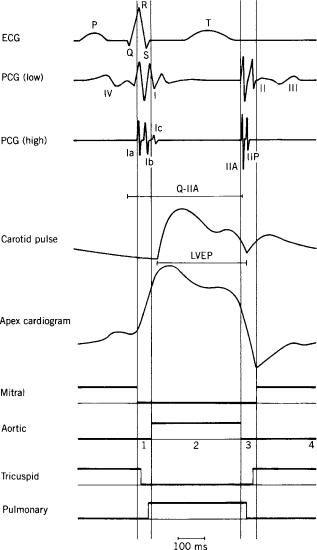
The generation of sounds is one of the many observable mechanical effects caused by heart action: contraction and relaxation of cardiac muscle, pressure rising and falling in the heart cavities, valve opening and closure, blood flowing and discontinuation of flow. Figure 1 shows a schematic representation of typical cardiac variables: the ECG, the logic states of the heart valves, low and high frequency phonocardiograms, a recording of a vessel pulse (carotid artery), and of the heart apex pulse (apexcardiogram). The heart cycle is divided into specific intervals according to the valve states of the left heart. The left ventricular systole is composed of the isovolumic contraction and the ejection period; The left ventricular diastole covers the isovolumic relaxation and the left ventricular filling (successively, the rapid filling, the slow filling, and the atrial contraction). A similar figure could be given for the right heart; Valve phenomena are approximately synchronous with those of the left heart. Small time shifts are typical: Mitral valve closure precedes tricuspid closure and aortic valve closure precedes pulmonary closure. The low frequency PCG shows the four normal heart sounds (I, II, III, and IV); In the high frequency, trace III and IV have disappeared and splitting is visible in I and in II. In the next sections details are given on the physiological significance, the physical aspects and recording methods, processing and physical modeling of heart sounds. Special attention is given to the electronic stethoscope.
HEART SOUNDS AND MURMURS
The sounds of the normal heart can be represented by a simple onomatopoeic simulation: ‘‘. . .lubb-dup. . .’’ (1–5). Two sounds can clearly be identified, the first being more dull than the second. A heart sound or a heart sound component is defined as a single audible event preceded and followed by a pause. As such, ‘‘splitting of a sound’’ occurs as one can clearly distinguish two components separated by a small pause. The closest splitting that
280 PHONOCARDIOGRAPHY
Figure 1. The ECG, PCG (low and high filtered), carotid pulse, apexcardiogram, and logic states (high ¼ open) of left heart valves, mitral and aortic valve, and right heart valves, tricuspid and pulmonary valve. Left heart mechanical intervals are indicated by vertical lines: isovolumic contraction (1), ejection (2), isovolumic relaxation (3), and filling (4) (rapid filling, slow filling, atrial contraction). The low frequency PCG shows the four normal heart sounds (I, II, III, and IV); In the high frequency trace III and IV have disappeared and splitting is visible in I [Ia and Ib (and even a small Ic due to ejection)] and in II [IIA (aortic valve) and IIP (pulmonary valve)]. Systolic intervals LVEP (on carotid curve) and Q-IIA (on ECG and PCG) are indicated.
can be appreciated is 20–30 ms. Similar guidelines are followed for the identification of phonocardiographic recordings: A sound is a complex of succeeding positive and negative deflections alternating with respect to the baseline, preceded and followed by a pause. A sound is said to be split if a small pause between the components can be perceived. At this point, the effect of frequency filtering may be important: Splitting, being invisible on a low frequency recording, may become recognizable on a high frequency recording (Fig. 1). Summarizing, we can state
that in clinical PCG primarily the envelope of the recorded signal is regarded, not the actual waveform as, for example, in ECG, blood pressure, and velocity recordings. As spectral performance of phonocardiography may exceed the possibilities of human hearing inaudible low frequency phenomena can be recorded; They are also indicated as ‘‘(inaudible) sounds’’.
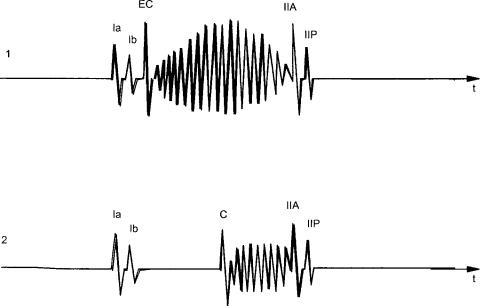
Acoustic phenomena originated by the heart are classified into two categories: heart sounds and heart murmurs (1–5,10–12). Although the distinction between them is not strict, one can state that heart sounds have a more transient, musical character (cf. the touching of a string) and a short duration (Fig. 1), whereas most murmurs have a predominantly noisy character and generally (but not always) a longer duration (e.g., a ‘‘blowing’’ murmur, a ‘‘rumbling’’ murmur) (Fig. 2). It is also believed that the genesis of both types is different: Heart sounds are indicated as types of resonant phenomena of cardiac structures and blood as a consequence of one or more sudden events in the cardiohemic system (such as valve closure), and most heart murmurs are said to be originated by blood flow turbulence. Many aspects of the problem of the genesis of these phenomena are still being discussed, including the relative importance of the valves and of the cardiohemic system in the generation of heart sounds (valvular theory versus cardiohemic theory).
Four normal heart sounds can be described (Fig. 1): I, II, III, and IV (also indicated as S1, S2, S3, S4). The two having the largest intensity, that is, the first (I, S1) and the second (II, S2) sound, are initially related to valve closure. The third (III, S3) and the fourth (IV, S4) sound, appearing extremely weak and dull and observable only in a restricted group of people, are not related to valve effects. The so-called closing sounds (I and II) are not originated by the coaptation of the valve leaflets (as the slamming of a door). On the contrary, it is most probably a matter of resonant-like interaction between two cardiohemic compartments suddenly separated by an elastic interface (the closed valve leaflets) interrupting blood flow: Vibration is generated at the site of the valve with a main direction perpendicular to the valve orifice plane and dependent on the rapid development of a pressure difference over the closed valve. In the case of the first sound, this phenomenon is combined with the effect of a sudden contraction of cardiac ventricular muscle. Pathologies of the cardiohemic system can affect the normal sounds with respect to intensity, frequency content, timing of components (splitting) (1).
The first heart sound (I) occurs following the closing of the mitral valve and of the tricuspid valve, during the isovolumic contraction period, and, furthermore, during the opening of the aortic valve and the beginning of ejection. In a medium or high frequency recording, a splitting of the first sound may be observed. Components related to the closing of the mitral valve (Ia, M1), the closing of the tricuspid valve (Ib, T1) and the opening of the aortic valve may be observed. There is a direct relation between the intensity of I and the heart contractility, expressed in the slope of ventricular pressure rising; with high cardiac output (exercise, emotional stress, etc.) sound I is enhanced. The duration of the PR-interval (electrical conduction time from the physiological pacemaker in the right
PHONOCARDIOGRAPHY 281
atrium to the ventricles) is a determining factor: The shorter the time between the atrial and ventricular contraction and, consequently, the larger the distance between the mitral valve leaflets, the larger the intensity of the first sound appears. With a long PR-interval mitral valve leaflets have evolved from wide open during atrial contraction to a state of partially open to almost closed when ventricular contraction starts; the result is a weak first sound. Cardiovascular pathologies can have an effect on timing and intensities of the first heart sound components. Wide splitting is observed in right bundle branch block, tricuspid stenosis, and atrial septal defect due to a delayed tricuspid component (Ib). In left bundle branch block Ia and Ib can coincide resulting in a single sound I. A diminished sound I is found in cases of diminished contractility (myocardial infarction, cardiomyopathy, heart failure), in left bundle branch block, mitral regurgitation and aortic stenosis; An intensified sound I is found in mitral stenosis with mobile valve leaflets and in atrial septal defect.
The second sound (II) is associated with the closure of the aortic valve and, following, the closure of the pulmonary valve. Splitting of the sound in an aortic (IIA, A2) and a pulmonary (IIP, P2) component is often observed. Splitting increases during inspiration as a consequence of increased difference in duration of left and right ventricular systole caused by increased right and decreased left ventricular filling; both components may fuse together at the end of expiration. Paradoxical splitting (the pulmonary component preceding the aortic one) is pathological. The pulmonary component normally has a lower intensity; an increased intensity with respect to the aortic component is generally abnormal. There is a direct relation between the intensity and the frequency of II and the slope of ventricular pressure falling during isovolumic relaxation. Stiffening of the valve leaflets results in a reduction of II. A higher valve radius or a lowered blood viscosity gives rise to an increased second sound. Cardiovascular pathologies can have an effect on timing and intensities of the second heart
Figure 2. Examples of pathological sounds and murmurs. (1). A systolic murmur (ejection murmur, crescendo, decrescendo) as a consequence of aortic valve stenosis preceded by a clear aortic ejection click (EC). (2). Midsystolic click (C) as a consequence of mitral valve prolapse followed by a systolic murmur due to mitral valve regurgitation.
sound components. Wide splitting of sound II can be due to delayed pulmonary valve closure or advanced aortic valve closure. Delayed pulmonary valve closure can be caused by right bundle branch block, pulmonary stenosis, pulmonary hypertension, atrial septal defect; advanced aortic valve closure can result from mitral regurgitation and ventricular septal defect. Paradoxical splitting of sound II can be due to delayed aortic valve closure or advanced pulmonary valve closure. Delayed aortic valve closure can be caused by left bundle branch block, aortic stenosis and arteriosclerotic heart disease. Advanced pulmonary valve closure can be caused by tricuspid regurgitation and advanced right ventricular activation. IIA, respectively, IIP, can be absent in severe aortic, respectively, pulmonary, valve stenosis. IIA is decreased in aortic regurgitation and in pathologically diminished left ventricular performance.
The third sound (III) occurs during the rapid passive filling period of the ventricle. It is believed that III is initiated by the sudden deceleration of blood flow when the ventricle reaches its limit of distensability, causing vibrations of the ventricular wall. It can often be heard in normal children and adolescents, but can also be registered in adults (although not heard) in the low frequency channel. It is a weak and low pitched (low frequency) sound. Disappearance of III is a result of aging as a consequence of increasing myocardial mass having a damping effect on vibrations. High filling rate or altered physical properties of the ventricle may cause an increased third sound. If III reappears with aging (beyond the age of 40 years) it is pathological in most cases. A pathological sound III is found in mitral regurgitation, aortic stenosis, ischemic heart disease.
The fourth sound (IV) coincides with the atrial contraction and thus the originated increased blood flow through the mitral valve with consequences as mentioned for the third sound. It is seldom heard in normal cases, sometimes in older people, but is registered more often in the low frequency channel. The sound is increased in cases of
282 PHONOCARDIOGRAPHY
augmented ventricular filling or reduced ventricular distensability. A pathological sound IV is found in mitral regurgitation, aortic stenosis, hypertensive cardiovascular disease, and ischemic heart disease.
Besides these four sounds, some pathological heart sounds may be present (Fig. 2). Among the systolic sounds there is the ejection sound and the nonejection systolic click. The ejection sound can be found in different pathological conditions such as congenital aortic or pulmonary valvular stenosis where opening of the cusps is restricted. A nonejection systolic click may be associated with a sudden mitral valve prolapse into the left atrium. An opening snap, a diastolic sound, may occur at the time of the opening of the mitral valve, for example, in cases with valve stenosis.
Heart murmurs are assumed to be caused by different mechanisms as compared to heart sounds. In fact, most murmurs result from turbulence in blood flow and occur as random signals. In normal blood vessels at normal velocity values blood flow is laminar, that is, in layers, and no turbulence is observed. In a normal resting human, there may be turbulent flow only in the vicinity of the aortic and pulmonary valves. As flow turbulence, a phenomenon that is generally irregular and random, is associated with pressure turbulence and, consequently, vessel wall vibration, acoustic phenomena may be observed. For flow in a smooth straight tube, the value of the Reynolds number, a dimensionless hydrodynamic parameter, determines the occurrence of turbulence. This number is proportional to the flow velocity and the tube diameter, and inversely proportional to the viscosity of the fluid. If this number exceeds a threshold value, laminar flow becomes turbulent. According to this theory, so-called innocent murmurs can be explained: They are produced if cardiac output is raised or when blood viscosity is lowered; they are generally early or midsystolic, have a short duration, and coincide with maximum ventricular outflow. Turbulence and thus intensity of the murmur increase with flow velocity. Pathological murmurs may be originated at normal flow rate through a restricted or irregular valve opening (e.g., in cases of valve stenosis) or by an abnormal flow direction caused by an insufficient (leaking) valve or a communication between the left and the right heart. As such systolic, diastolic, or even continuous murmurs may be observed. Systolic ejection murmurs occur in aortic and in pulmonary stenosis (valvular or non-valvular), diastolic filling murmurs in mitral and tricuspid stenosis. Aortic and pulmonary regurgitation cause diastolic murmurs; mitral and tricuspid regurgitation cause systolic murmurs. A systolic murmur and a diastolic murmur can be observed in ventricular septal defect. Continuous murmurs occur in patent ductus arteriosus (a connection between pulmonary artery and aorta). Musical murmurs occur as deterministic signals and are caused by harmonic vibration of structures (such as a valve leaflet, ruptured chordae tendinae, malfunctioning prosthetic valve) in the absence of flow turbulence; these are seldom observed.
The location of the chest wall where a specific sound or murmur is best observed (in comparison with the other phenomena) may help in discriminating the source of the sound or the murmur (1). These locations are dependent, not only on the distance to the source, but also on the
vibration direction. Sounds or murmurs with an aortic valve origin are preferably investigated at the second intercostal space right of the sternum and those of pulmonary origin left of the sternum. The right ventricular area corresponds with the lower part of the sternum at the fourth intercostal space level, the left ventricular area between the sternum and the apex point of the heart (at the fifth intercostal space level). Furthermore, specific physiological maneuvers influencing cardiac hemodynamics may be used for obtaining better evaluation of heart sounds and murmurs.
In conclusion, the existence, timing, location at the chest wall, duration, relative intensity and intensity pattern, and frequency content of murmurs and/or pathological sound complexes form the basis of auscultatory, and/or phonocardiographic diagnosis of cardiac disease.
FUNDAMENTAL ASPECTS OF HEART VIBRATIONS
Mechanical heart action can be indicated by a set of time signals, which can be measured by invasive means: Most important variables are blood pressure in heart cavities and in blood vessels, myocardial and vessel wall tension, ventricular volume, blood flow velocity, heart wall deformation, and movement. At the chest surface only kinematic information is available: the movement of the chest surface as a result of mechanical heart action. As, in general, the movement of a material point can be indicated by a vector and as this vector appears to differ at various chest wall sites, one can state that mechanical information available at the chest wall is described by a spatiotemporal vector function. As far as the effect of the heart is concerned the movement is defined with respect to an equilibrium position; thus one can speak of a vibratory phenomenon. This movement of the chest surface, surrounded with air, gives rise to acoustic pressure in air; the latter is generally so weak that nothing can be perceived by hearing at a distance from the chest wall (except for artificial valve cases). Only if closed air cavities are used is a sound effect observable by the ear: The closed cavity (such as the stethoscope) prevents dispersion of acoustic energy and thus attenuation of acoustic pressure. It is out of the spatiotemporal kinematic vector function that phonocardiography takes a sample in order to evaluate cardiac activity.
As there is a vector function involved, three components should be taken into account. In practice, only the component perpendicular to the chest surface is measured and the two tangential components are disregarded. A kinematic function may be represented by different time representations, for example, displacement (m), velocity (m/s), acceleration (m/s2), or even higher time derivatives (m/sn, n representing the order of time derivative). Fundamentally, each representation contains identical information as they are all connected by a simple mathematical operation, that is, time derivation, but for visual inspection or time signal processing they reveal different vibratory patterns. Speaking in terms of the frequency domain, time derivation implies multiplication of the amplitude of an harmonic with its frequency: Time derivation is thus an operation of emphasizing higher frequencies in the signal with respect
to the lower ones. According to linear system theory, a similar effect is obtained with high pass filtering, the effect of filtering being described by the Nth time derivative of the signal in the attenuation band (i.e., for frequencies well below the cutoff frequency). The number N represents the order of the filter and determines the slope in the attenuation band of the amplitude characteristic (N 20 dB/decade). High pass filtering, order N, is theoretically identical with the corresponding low pass filtering of the Nth time derivative of the signal.
In biomedical signal processing, it is relatively uncommon to consider different time representations. From auscultation, we learned that in case of PCG it is rather beneficial. In a chest wall displacement curve, no sounds can be perceived, for example, at the site of the apex of the heart one can measure the apexcardiogram (Fig. 1), which is essentially a recording of the displacement of the skin surface and the ordinate axis could have a millimeter scale. Nevertheless, at the site of the apex sounds can be recorded if time derivation or high pass filtering is applied. In practice, transients corresponding to heart sounds become clearly visible in the acceleration recording. The ear cannot sense displacements such as the apexcardiogram; this can simply be explained if one regards the ear’s sensitivity curve. In the range below < 1000 Hz, the sensitivity increases with increasing frequency, equivalent with the effect of high pass filtering.
The kinematic effect of heart action at the chest surface is not completely covered by phonocardiography. Historically, the frequency spectrum is divided into two parts: the low frequency part (up to 20 Hz) is handled under the title mechanocardiography and the second part beyond 20 Hz under PCG. The reason of separation lies in the nature of auscultation (frequencies beyond 20 Hz, according to hearing performance) and, additionally, palpation (frequencies < 20 Hz, according to tactile sensitivity). According to this, displacement recording belong to the domain of mechanocardiography, which studies arterial and venous pulse tracings, and the apexcardiogram. The carotid pulse (Fig. 1) is a recording of skin surface displacement at the site of the neck where the carotid artery pulsation is best palpated. The curve reflects local volume changes, and consequently pressure changes in the artery at the measurement site. It thus reflects changes in aortic pressure after a time delay determined by the propagation time of the blood pressure wave (10–50 ms). The beginning of the upstroke of the graph corresponds to the opening of the aortic valve and the dicrotic notch corresponds to its closing. As such, the left ventricular ejection period (LVEP) can be derived. The apexcardiogram (Fig. 1) is a recording of skin surface displacement of the chest wall at the site of the heart apex; in this case there is no propagation delay. The abrupt rise of the graph corresponds to the isovolumic contraction, the fall with the isovolumic relaxation. The minimum point occurs at the time of opening of the mitral valve. These displacement curves have been used for identifying heart sounds.
Chest wall kinematics are not exclusively caused by heart action. The most important movement in a resting human is originated by the respiration act. Two phenomena should be mentioned: a low frequency event corresponding
PHONOCARDIOGRAPHY 283
with the breathing movement itself, and having its fundamental frequency at the breathing rhythm ( 0.2–0.4 Hz), and a high frequency phenomenon corresponding to breathing noises, ‘‘lung sounds’’, due to the turbulent air stream in airways and lungs. The latter may cause great disturbances in high frequency heart sound recording. To these effects one can add the result of stomach and intestine motility and, moreover, environment noise picked up by the chest wall. From the standpoint of PCG, these effects are merely disturbing and thus to be minimized.
In PCG, one discriminates between heart sounds and murmurs (based on auscultation). It has already been indicated that the source types are different as well as the acoustic impressions they provoke. From the standpoint of signal analysis heart sounds correspond better with transients originated by a sudden impact, whereas murmurs, except for the musical types, have a random character. In fact, if one considers a set of subsequent heart cycles, one may find that heart sounds are more coherent compared to murmurs. For example, averaging of sounds of subsequent heart cycles with respect to an appropriate time reference gives a meaningful result, but the same fails for murmurs as a consequence of their random character.
Conventional heart sound recording is executed at the chest wall. Some exceptions are worth mentioning. Intracardiac phono signals are obtained from cardiac blood pressure curves during catheterization. If a catheter-tip pressure transducer with sufficient bandwidth is used, intracardiac sound recordings can be obtained by submitting the pressure signal to high pass filtering or time derivation. It is also possible to get closer to the heart in a noninvasive way by measuring pressure or kinematics in the esophagus. In this way, the posterior part of the heart, lying close to the esophagus, is better investigated.
RECORDING OF HEART SOUNDS
In auscultation, the physician uses a stethoscope as a more practical alternative for putting the ear in close contact to the chest wall. Recording of heart sounds is a problem of vibration measurement (13), more specifically on soft tissue. It implies the need of a sensor, appropriate amplification and filtering, storage and visualization on paper (14,15), or by using information technology. The useful bandwidth is 20–1000 Hz. The sensor needs to be a vibration transducer (vibration pickup), in this case also called a heart sound microphone; an alternative is a stethoscope provided with a microphone: the electronic stethoscope. Except for the sensor, virtual instrumentation technology can be used in the measuring chain: This implies a PC with a data acquisition card and signal processing software (such as Labview).
The Transducer
In a normal situation the chest wall vibrates only surrounded with air, which exerts an extremely low loading effect. Consequently, force at the surface may be neglected and only the kinematic variable is important. This ceases to be true when a transducer is connected to the chest wall,

284 PHONOCARDIOGRAPHY
exerting a significant loading effect. This loading influence is described by the mechanical impedance of the pickup (force/velocity) or by the dynamic mass (force/acceleration). The loading effect is also dependent on the chest wall tissue properties; chest wall mechanical impedance is determined by tissue elasticity, damping, and mass. In general, heart sound microphones provoke a large and difficult to quantify loading effect on the chest wall, so that in no case the standard unloaded vibration is recorded. The same is not true in electrocardiography, for example, where the apparatus is designed with a sufficiently high input impedance to record the unaffected electrical potential at the electrode site. The latter is hard to achieve in phonocardiography (16).
Heart sound transducers can be divided into two types: the absolute pickup and the relative pickup. The absolute pickup measures the vibration at the site of application, averaged over the area of application. In general, these are contact pickups that are rigidly connected to the chest wall; the measuring area is thus identical to the contact area. These types are similar to the ones used for industrial measurements on mechanical structures or in seismography. The relative pickup measures the vibration averaged over a certain area with respect to a reference area; it is thus a kind of differential pickup. Air-coupled pickups are differential pickups. Essentially they consist of an air-filled cavity, generally with a circular shape, the edge of the cavity rigidly and air-tight-connected to the chest wall. It is thus the difference of the displacement under the cavity (the measuring area) and the displacement under the edge of the cavity (the reference area) giving rise to an acoustic air pressure within the cavity that is measured. The electronic stethoscope can be considered as a relative pickup. Figure 3 shows the principles.
With the contact vibration pickup the average kinematics of the measuring area in the loaded situation is recorded. The most generally applied transducing principle is the seismic type: A seismic mass is connected via a
Figure 4. The seismic system, the mechanical model for a contact pickup (i.e., an accelerometer). The system is attached to the vibrating surface (F, x) with its contact mass M2; The seismic mass M1 is coupled to the contact mass via a stiffness S and a damping D. The displacement y between the contact and the seismic mass represents the measuring value.
spring-damping system to the contact mass coupled with the vibrating surface (Fig. 4). The relative displacement between the seismic mass and the contact mass is measured with the aid of a mechanoelectric transducing device. The latter can be a piezoelectric crystal that generates an electrical charge proportional to its deformation (Fig. 5); The complete device behaves as an accelerometer for frequencies (f) below its acceleration resonance frequency (f1); it measures displacement above f1. Measuring acceleration is generally the normal function. The acceleration charge sensitivity sQ (charge per acceleration unit, pC/m s 2) is thus
sQ ¼ B=ð2pf1Þ2 |
ð1Þ |
for f < f1. The parameter B stands for a mechanoelectric transducing efficiency and depends on the crystal type and
Figure 3. A schematical representation of heart vibration pickups: left, the relative type; right, the absolute type; above, the pickup positioned at the vibrating chest wall; below, the corresponding areas relating the pickup with the chest wall. The absolute pickup measures the kinematics xt at its contact area At. The relative pickup, presented as an air cavity with a pressure-sensing device at the top of the cavity (black part), measures the difference between the kinematics under the cavity xtM, that is, of the measuring area AtM, and the one under the edge of the cavity xtR, that is, the reference area AtR.
Figure 5. A schematic representation of two types of phonocardiographic contact pickups: at left, the heavy, and at right, the low weight type. The mechanoelectric transducing device (here presented as a bilaminar bending crystal) is built in to measure the displacement between the seismic mass and the material in contact with the vibrating surface. The black parts indicate elastic material. The heavy type (possibly held by hand at the massive case, representing the seismic mass) makes contact with the chest wall via a coin-shaped disk connected to the crystal by an extension rod. For the low weight type, the case makes contact with the vibrating surface and all remaining parts (including the seismic mass attached to the crystal) are at the inside. Note: The heavy type is mentioned because of its historical value.
PHONOCARDIOGRAPHY 285
Figure 6. The acceleration amplitude frequency characteristic of a seismic pickup (double logarithmic scale). Curves presented can be obtained using the same mechanoelectric transducing device, but with a different mechanical layout of the seismic system. The oblique broken line represents a sensitivity limit for the specific mechanoelectric transducing device. The characteristic of a seismic system corresponds with a second-order low pass filter. The resonant frequency f1 determines the bandwidth (flat part), but also the sensitivity (Eq. 1). Two different types are shown; the low resonant frequency f11 can be found in heavy phonocardiographic pickups; the high one, f12, in low weight types. For the latter, the effect of damping is shown: Curve 2b corresponds to a higher damping in the system, as can be seen by the decreased height of the resonance peak.
on its mounting; f1 is a construction parameter determined by the seismic mass and the stiffness incorporated between the seismic and the contact mass. The complete amplitude frequency characteristic corresponds with a low pass second-order filter, with f1 also representing the cutoff frequency (Fig. 6), thus determining the measuring bandwidth and the sensitivity. Evidently other then piezoelectric elements can be used for measuring displacement: piezoresistance, variable capacitance (both of them needing a polarization voltage), electret elements, and so on.
The loading influence of the pickup can be presented by its dynamic mass. In comparing contact pickups with different masses with an ultralow weight type (Fig. 7) it was found that distortion and attenuation is caused by the mass (16): Beyond 100 Hz, the amplitude ratio (loaded compared to unloaded) approximates a value (AL):
AL ¼ Mt=ðMt þ M1Þ |
ð2Þ |
Figure 7. Amplitude frequency characteristic of the loading effect caused by the coupling of a rigid element to the soft tissue of the chest wall (as e.g., a contact pickup) (drawing for a 10 g, 20 mm diameter element). Attenuation is about constant beyond 100 Hz (Eq. 2).
with Mt ¼ a d3t , a ¼ 280 kg/m3 (typical); M1 is the loading mass (of the pickup), Mt is the thorax wall output mass, and dt is the contact diameter. According to this formula, a 10-g pickup with a 20 mm diameter would result in an attenuation to 18% of the original unloaded amplitude. For quantitative purposes, ultralow weight pickups can thus be recommended. It must also be emphasized that not the weight per se, but the weight divided by the third power of the contact diameter is the parameter to be minimized (according to Eq. 2).
In the case of the air-coupled vibration pickup (17), the average kinematics of the measuring area (under the cavity) with respect to the reference area (under the edge of the cavity) in the loaded situation is recorded (Fig. 3). Air pressure in the cavity as a result of the relative displacement of the chest wall is registered with a built-in sensor measuring acoustic pressure (a microphone). The movement of the membrane of this microphone is transformed into an electrical signal, for example, by the moving coil principle (dynamic type) and variable capacitance (condenser type with a polarizing voltage, electret type). As such, the measuring characteristics of the air-coupled pickup are determined by the dimensions of the air cavity and by the features of the included microphone. If the microphone membrane is rather stiff as compared with air and the height (l) of the cavity small as compared with the wavelength of heart vibrations in air, the pressure (p) generated at the site of the membrane is simply proportional to the relative displacement of the chest wall
(xtMR ¼ xtM xtR):
p ¼ ð c2=lÞ xtMR |
ð3Þ |
286 PHONOCARDIOGRAPHY
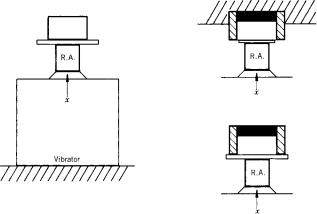
Figure 8. Calibration of heart vibration pickups. The pickup to be tested is compared with a reference accelerometer (RA): left, the contact pickup; right, the relative pickup. The contact pickup is rigidly connected with the reference accelerometer, mounted on a vibrator (left). For the relative pickup two measurements can be performed (right, vibrator not displayed). In a first test, the differential characteristic is determined (right, above): With the housing fixed, a movement is generated at the orifice of the cavity, which is closed airtight with (e.g., an elastic membrane). In a second test the common mode sensitivity is determined, the pickup fixed at a stiff plate. An ideal relative pickup features zero common mode sensitivity.
where r is the air density (kg/m3) and c is the wave propagation velocity in air (m/s). The loading effect under the cavity is given by a stiffness term (StM, N/m) and
StM ¼ dtM2 rc2=ð4lÞ |
ð4Þ |
where dtM is the diameter of the measuring area. At the reference area, the pickup exerts a mass loading; the combined loading effect is hard to describe.
For calibration of a phonocardiographic pickup one can use a vibrator, a reference accelerometer having an ideal frequency response, and two amplifiers (Fig. 8). The contact pickup to be tested should be rigidly attached to the reference pickup. In case of an air-coupled pickup, one has to investigate the differential and the common mode characteristics, the first one with the housing fixed, a displacement being generated at the input of the cavity (e.g., airtight sealed with an elastic membrane), and the second one with the complete microphone fixed at the rigid vibration table (the relative displacement between inner and edge of the cavity being zero). For an ideal relative pickup, the common mode term should be zero; In practice, it is to be small with respect to the differential sensitivity. Mechanical impedance of a pickup can similarly be measured by applying a force transducer combined with the reference accelerometer (an impedance head). It should be emphasized that in this way only the properties of the pickup can be obtained, but no information is acquired on the ultimate distortion effect due to the loading of the chest wall, as this is also dependent on the tissue parameters. This effect can only be measured in situ, that is, on the patient themself; the procedure is rather complicated.
In conclusion, accurate quantitative recording of the unloaded chest wall vibration is extremely difficult. Industrial accelerometers (equivalent to the described contact types) show the same disadvantages with respect to loading on the soft tissue of the chest wall. Moreover, as a rule they are less sensitive and have an unnecessary broad bandwidth. Some noncontact methods have been reported, but only for infraphonocardiographic frequencies.
Preamplification and Signal Preprocessing
Without going into details regarding electronics, we must emphasize the importance of the preamplifier, as this part of the recording unit, in combination with the pickup, determines the electronic noise level of the apparatus. It is adequate to resume possible disturbing influences at this point. First, there are the physiological vibrations generated by organs other than the heart. Respiration sounds may be the most inconvenient disturbances, especially with patients suffering from lung disease. Recording in an expired resting state can thus be advised. Furthermore there are environmental vibrations; Air-transmitted noises, especially the higher frequencies at which cardiac vibration intensity is weak, can be very inconvenient. Therefore, the air-coupled pickup should be attached in an airtight manner to the chest wall. This does not solve the problem completely, as environmental noises seem to be picked up by the chest wall and, in this way, transmitted to the pickup (air-coupled as well as contact type). Theoretically, these disturbing vibrations can be minimized, but for a given apparatus electronic noise cannot be affected and thus sets a limit to noise diminishing and determines a threshold under which no heart sound or murmur can be recognized.
Besides the noise level, the frequency characteristic of the preamplifier connected to the pickup should be regarded. For example, in the case of a piezoelectric pickup, its electrical output property is capacitive and one must bear in mind that the combination of this capacitance with the input resistance of a voltage preamplifier gives rise to a first-order high pass effect. To avoid this problem, charge or current amplifiers can be used. Whereas the charge amplifier measures acceleration, the current amplifier measures its time derivative.
Whether or not signals are digitized after preamplification, a high pass filtering (or band-pass filtering) process is necessary (18,19). High pass filtering and appropriate amplification (analogue or digital) of the filter channels compensate for the fact that visual inspection of a single recorded phonocardiogram (even when optimally chosen) does not reveal the same amount of information as gained from the acoustical impression during auscultation. Furthermore, the amplification has to compensate for the decreasing amplitude of heart vibrations at increasing frequencies. Conventionally, a set of about four high pass filters are used, each characterized by a gradually increasing cutoff frequency and/or increasing slope in the attenuation band. For example, Maass Weber high pass filters are used with a common cutoff frequency of 1 kHz and slopes of 20, 30, 40, and 60 dB/octave (EEC, see the section Hardware and Software). Generally, filter sets have been
determined qualitatively by applying a range of subsequent filters and recording a set of normal subjects and patients with different heart diseases: A filter providing information also perceivable in another one was eliminated from the set. Furthermore, filtering must permit discrimination between phenomena having a different physiological or pathological origin. Clear splitting between slightly asynchronous phenomena (or minimal overlapping) is thus desired for vibrations having similar frequency content. Now discrimination between phenomena having a different frequency content in adjacent filter channels is expected. The chosen set is not uniquely optimal: It depends on the preceding elements in the measuring chain (the vibration pickup, including its loading effect, and the preamplifier). As such, a filter set chosen for a contact pickup is not evidently optimal for an air-coupled type.
Different transducers, the mostly unknown distortion effect due to loading and different filter sets, might seem remarkable to physicists and engineers from the viewpoint of measuring quality. Nevertheless, for (semiquantitative) phonocardiography the use of filtering with adaptable amplification compensates in some degree for microphone, loading, and preamplification characteristics. For example, attenuation due to loading in a specific frequency band may be partly compensated by increased amplification of the corresponding channel.
Storage and Visualization
In older apparatus intended for recording of ECG, PCG, and pulses, a paper recorder (strip chart recorder) was included. The first was an analog type [as the galvanometric pen writer, having a limited bandwidth ( 100 Hz), but equipped with special techniques for recording high frequency sounds], and later it was a digital type as the thermal array recorder. The latter, also available as a general purpose paper recorder, functions completely digitally: It sets a dot at the point corresponding to the instantaneous value of the signal to be recorded: No moving mechanical parts are present except for the paper drive. The recording technique is characterized by a sampling and a writing frequency. The latter may be lower than the first: During the writing interval all points between the maximum and the minimum value of the signal samples are dotted. As such, the recording is a subsequence of vertical lines: For visual inspection of the overall vibration pattern no information is lost.
Furthermore, data can be handled by common information technology: a (portable) personal computer with appropriate data-acquisition possibilities, virtual instrument software for signal conditioning and processing, visualization, archiving, and hard copy generation.
PROCESSING OF HEART SOUNDS AND PHYSICAL MODELING
Physical modeling aims at the localization of a specific sound source in the heart and, by analyzing the externally recorded vibration signals, at the quantification of the constitutive properties of the cardiac structures involved (e.g., stiffness of a valve leaflet, myocardial contractility)
PHONOCARDIOGRAPHY 287
and of the driving forces, which set these structures into vibration. The physical situation is extremely complicated. The vibration source is situated within the cardiac structures (having viscoelastic properties) containing and driving blood (a viscous fluid). The transmission medium, the tissues between the heart and the chest wall, is viscoelastic and inhomogeneous.
Transmission in such a viscoelastic medium implies compression and shear waves, which both contribute to the vibrations at the chest wall (20). It is not simply a problem of acoustic pressure as in a perfect fluid. Distortion due to transmission seems obvious. In order to study transmission and to relate chest wall vibrations to properties of cardiac structures and hemodynamic variables, advanced signal processing techniques are used. A broad review is given by Durand et al. (21).
As the chest wall vibratory phenomenon is represented by a spatiotemporal kinematic function, it can principally be approached in two ways: by sampling in time, as a set of images of chest wall movement, or by sampling in space by a set of time signals obtained with multisite recording. Multisite heart sound recording implies a large set of pickups (preferably light weight, thus inducing minimal loading). In this way, spatial distribution of vibration waveforms on the chest wall can be derived. Based on the results of such a method a physical model for heart sound genesis has been presented that can analytically be solved in a viscoelastic medium: a sphere vibrating along the axis of the valve orifice (20). This mechanical dipole model agrees to the idea of sound generation as a resonantlike vibration of the closed elastic valve leaflets and the surrounding blood mass. With this model a typical inversion of vibration waveforms on the chest wall could be explained: The phase reversal is expressed most for the second sound, according to the anatomical position and direction of the aortic orifice. The model has been used to calculate source functions (the inverse problem). Spatial parameters on vibration waveforms have been formulated (22–25).
Physical modeling aims at the quantification of the constitutive properties of cardiac structures (e.g., of the valve leaflets) and the driving forces (e.g., blood pressure). For example, with respect to the second sound, the aortic valve was modeled as a circular elastic membrane, it was allowed to vibrate in interaction with the surrounding blood mass, with as a driving force the slope of the development of the transvalvular pressure difference during isovolumic relaxation (11,26). Typical characteristics of IIA and IIP could thus be explained. For example, the reduction of amplitude and frequency shift (toward higher frequencies) as a consequence of valve stiffening, the diminishing of amplitude in patients with poor ventricular performance (characterized by a slow pressure drop in the ventricle during the isovolumic relaxation), and the augmentation of amplitude in cases of anemia (implying reduced blood viscosity and thus reduced damping in the resonant system). In another model, the ventricle is modeled as a finite thick-walled cylinder and the amplitude spectra of computed vibration waveforms contain information concerning the active elastic state of muscular fibers that is dependent on cardiac contractility (27).
288 PHONOCARDIOGRAPHY
Transmission of vibrations by comparing vibrations at the epicardial surface and at the chest wall has been studied (21). Esophageal PCG proved to be beneficial for recording vibrations originated at the mitral valve (28). The disappearance of the third sound with aging was explained with the ventricle modeled as a viscoelastic oscillating system with increasing mass during growth (29). Spectral analysis of the pulmonary component of the second sound reveals information on the pressure in the pulmonary artery (30).
Frequency content and timing of heart vibrations is of major importance; Time–frequency analysis of signals is thus performed. Classical Fourier analysis uses harmonic signals (sine and cosine waves) as basic signals. The frequencies of the harmonics are multiples of the fundamental frequency and the signal can be composed by summing the sine and cosine waves multiplied with the Fourier coefficients. Sine waves have an infinite duration and the method is thus beneficial for periodic functions. A phonocardiogram can be considered as a periodic function, but it is composed of a number of phenomena shifted in time with specific frequency content (heart sound components and murmurs). When applying classical Fourier analysis, information on timing is lost. Thus Fourier analysis has to be performed on shorter time intervals (by dividing the heart cycle into subsequent small intervals) resulting in time and frequency information. To minimize errors resulting from calculating in these small intervals, mathematical techniques have to be applied. Wavelet analysis calculates wavelet coefficients based on transient-like irregular signals with limited duration, called wavelets. Wavelets are derived from a mother wavelet and obtained by scaling in time (subsequently with a factor 2) and by shifting in time. As in Fourier analysis, the signal can be composed by summing shifted and scaled wavelets multiplied with their wavelet coefficients. The waveform of the mother wavelet can be chosen. As scaling in time corresponds to frequency, this method also gives time and frequency information, but it performs better for analyzing signals of a nonstationary nature, such as heart sounds and murmurs. Sudden changes or discontinuities in the signal can better be identified and located in time. A large number of studies has been executed with respect to time–frequency analysis of heart sounds and murmurs and different calculation methods have been compared (21). Spectral analysis of heart murmurs appeared to be useful to estimate transvalvular pressure difference in patients with aortic valve stenosis (31,32). Spectral analysis was used to monitor the condition of bioprosthetic valves and mechanical valve prostheses (33,34). Wavelet transform (35) and a nonlinear transient chirp signal modeling approach (36) were used to detect the aortic and the pulmonary component of the second sound. The matching pursuit method was used to identify the mitral and the tricuspid component in the first sound (37). A tailored wavelet analysis has been used to automatically detect the third heart sound (38). Time– frequency analysis was applied for classification of heart murmurs produced by bioprosthetic valves (39), for studying the first heart sound (40), and for automated detection of heart sounds (41).
THE ELECTRONIC STETHOSCOPE
Clinical interest in PCG in its classical form has been decreasing during the last decade, but there seems to be an increasing interest in heart sound recording with the aid of electronic stethoscopes (1), combined with information technology allowing easy data-acquisition, visualization, data handling and parameter extraction, playback, telemedicine applications, waveform recognition, and diagnosis with the aid of databanks. Also, virtual instrumentation technology (such as Labview) is used for heart sound acquisition and processing.
The modern acoustic stethoscope comprises a binaural headset and a chest piece connected by elastic tubing (1). The headset is composed of ear tubes and ear tips; the chest piece can consist of a bell and a diaphragm part. The ear tips should fit in the ear orifice, preventing air leakage, with the tube properly aligned to the hearing canal, that is slightly directed forward. The tube connecting the headset and the chest piece should not be to long to restrict attenuation of acoustic pressure, especially of higher frequencies, generated at the chest piece. With the diaphragm part provided with a stiff membrane (diameter 4 cm), applied firmly to the skin, the high frequency sounds are better observed. With the bell part of the chest piece, applied with low pressure to the skin (enough to prevent air leaks between skin and bell edge) low frequency vibrations are best picked up. The bell diameter should be large enough to span an intercostal space ( 2.5 cm for adults). Firm application of the bell makes the skin act as a membrane thus diminishing its low frequency performance. Some stethoscopes have only one part with a specially mounted membrane, which can function in the ‘‘bell mode’’ or in the ‘‘membrane mode’’ by altering applied pressure for the purposes cited above. As such, in the application of the stethoscope, frequency filtering (as in phonocardiography) is performed by using a specific shape and mechanical coupling to the chest wall.
The electronic stethoscope (e-stethoscope) combines the simplicity of the acoustic stethoscope with the benefits of electronics and information technology. Essentially, the e- stethoscope is an acoustical type provided with a built-in microphone; as such, it can be indicated as an air coupled vibration pick-up. In its simplest form, sounds are transmitted to the ears by tubing as in the acoustical one. The more advanced type has the microphone built within the chest piece, with adjustable amplification and filtering, mode control with easy switching between bell and diaphragm modes, generation of processed sound by miniature speakers to the air tips, cable or wireless connection to a personal computer for further processing. Adjustment of stethoscope performance can be executed during auscultation. Most stethoscopes are intended for observation (and recording) of heart sounds and murmurs, and for lung and airway sounds as well. A special type, the esophageal stethoscope, can be used for monitoring heart and lung sounds during anesthesia (42).
User-friendly software is available for diagnostic and for training purposes. Recorded signals can be printed, visualized, adapted by digital filtering and scaling, improved by elimination of artifacts and disturbances, and combined
with synchronously recorded ECG. Processed sounds can be reproduced and played back with speakers with a sufficient bandwidth (in the low frequency range down to 20 Hz). Spectral analysis is also possible: Frequency content as a function of time can be displayed. Automated cardiac auscultation and interpretation can be useful in supporting diagnosis (43–45). Sounds recorded by a local general physician can be sent via internet to the cardiologist for accurate diagnosis (46).
Educational benefits are obvious. Heart sounds recorded with the e-stethoscope or obtained from a databank can be visually observed and listened to. CD–ROMs with a collection of typical heart sounds and murmurs are available for training purposes. Multimedia tools were found to contribute to the improvement of quality of physical examination skills (47,48).
HARDWARE AND SOFTWARE
In this paragraph, some practical details are given with respect to available hard and software. A conventional form of a phonocardiograph (heart sound transducer, amplifier and filters, audio, output connectable to recorder, also fit for lung sound recording) can be obtained from EEC (http:// www.eeconnet.com). ADInstruments provides a heart sound pickup (http://www.adinstruments.com). Colin (http://www.colin-mt.jp/eng) provides a phonocardiograph together with ECG and noninvasive blood pressure measurement for noninvasive assessment of arteriosclerosis. Electronic stethoscopes can be purchased at Cardionics (http://www.cardionics.com), 3M (Litttmann) (http://www. 3M.com/product/index.jhtml), Meditron (http://www.meditron.no/products/stethoscope), Philips (http://www.medical.philips.com/main/products/), EEC (http://www.eeco nnet.com). Software supporting the physician in the evaluation of heart sounds recorded with an electronic stethoscope is provided by Zargis (http://www.zargis.com), Stethographics (http://www.stethographics.com/index. html). Software intended for training in heart sound auscultation (heart sounds recorded with an electronic stethoscope or from data banks) can be obtained from Biosignetics (http:// www.bsignetics.com), Zargis (http://www.zargis.com), Cardionics (http://www.cardionics.com).
EVALUATION
Evaluation of heart sounds and murmurs remains an important method in the diagnosis of abnormalities of cardiac structures. Conventional PCG, however, essentially the graphic recording of sounds for visual inspection, has lost interest as a result of a number of reasons. First, the vibration signals are complex and thus difficult to interpret; they are characterized by a broad frequency range and, as such, different time representations present specific information (low and high frequencies). Obtaining high quality recordings having a high signal-to-noise ratio is difficult. Genesis and transmission of vibrations is difficult to describe and insufficiently known. A variety of waveforms are observable at the chest surface; Multisite recording and mapping are useful with respect to the solving of the genesis and transmission
PHONOCARDIOGRAPHY 289
problem but are difficult to execute and result in a large amount of data to be analyzed. The recording technique is not standardized; The ordinate axis of a phonocardiographic waveform does not have a physical unit as, for example, the millivolt in electrocardiography. The latter is due to the different transducer types, unquantified loading effect of the transducer on the chest wall, different frequency filter concepts. Thus, the method remains bound to a specific recording method and is semiquantitative. No guidelines for universal use have been developed and proposed to the clinical users. The most important reason evidently is found in the availability of technologies like echocardiography, Doppler, and cardiac imaging techniques, which provide more direct and accurate information concerning heart functioning. The latter, however, have the disadvantages of being costly and restricted to hospitals. Nevertheless, knowledge of heart sounds and murmurs has been greatly increased with the PCG technique and research is still going on. Signal analysis, more specifically time–frequency analysis, has proven to be very useful in the identification and classification of heart sound components and murmurs and their relation to cardiac structures and hemodynamic variables.
Conventional PCG has lost interest. Nevertheless, the historical value of the method has to be stressed. Auscultation, being simple, cheap, and not restricted to the hospital environment, held its position as a diagnostic tool for the general physician and for the cardiologist as well. However, this technique requires adequate training. Recording and processing of heart sounds remain beneficial for training and for supporting diagnosis. Electronic stethoscopes coupled to a laptop with suitable software and connected to the internet for automated or remote diagnosis by a specialist may grow in importance in the coming years.
BIBLIOGRAPHY
1.Tilkian AG. Understanding heart sounds and murmurs with an introduction to lung sounds. Philadelphia: W.B. Saunders; 2001.
2.Salmon AP. Heart sounds made easy. London: Churchill Livingstone; 2002.
3.Wartak J. Phonocardiology: Integrated Study of Heart Sounds and Murmurs. New York: Harper & Row; 1972.
4.Luisada AA. The Sounds of the Normal Heart. St. Louis, MO: Warren H. Green; 1972.
5.Delman AJ, Stein E. Dynamic Cardiac Auscultation and Phonocardiography. A Graphic Guide. Philadelphia, PA: W.B. Saunders; 1979.
6.Einthoven W. Die Registrierung der Mensclichen Hertztone mittels des Saitengalvanometers. Arch Gesamte Physiol Menschen Tiere 1907;117:461.
7.Mannheimer E. Standardization of phonocardiography. Am Heart J 1957;54:314–315.
8.Holldack K, Luisada AA, Ueda H. Standardization of phonocardiography. Am J Cardiol 1965;15:419–421.
9.Groom D. Standardization of microphones for phonocardiography. Biomed Eng 1970;5:396–398.
10.Rushmer RF. Cardiovascular Dynamics. Philadelphia, PA: Saunders; 1976.
11.Stein PD. Physical and Physiological Basis for the Interpretation of Cardiac Auscultation. Evaluations Based Primarily on the Second Sound and Ejection Murmurs. New York: Futura Publishing Co.; 1981.
290 PHONOCARDIOGRAPHY
12.Luisada AA, Portaluppi F. The Heart Sounds. New Facts and Their Clinical Implications. New York: Praeger; 1982.
13.Harris CM. Shock and Vibration Handbook. 5th ed. New York: McGraw-Hill; 2001.
14.van Vollenhoven E, Suzumura N, Ghista DN, Mazumdar J, Hearn T. Phonocardiography: Analyses of instrumentation and vibration of heart structures to determine their constitutive properties. In: Ghista DN, editor. Advances in Cardiovascular Physics. Vol. 2, Basel: Karger; 1979. pp. 68–118.
15.Verburg J, van Vollenhoven E. Phonocardiography: Physical and technical aspects and clinical uses. In: Rolfe P, editor. Non Invasive Physiological Measurements. London: Academic Press; 1979. pp. 213–259.
16.Vermarie¨n H, van Vollenhoven E. The recording of heart vibrations: A problem of vibration measurement on soft tissue. Med Biol Eng Comput 1984;22:168–178.
17.Suzumura N, Ikegaya K. Characteristics of air cavities of phonocardiographic microphones and the effects of vibration and room noise. Med Biol Eng Comput 1977;15:240–247.
18.Maass H, Weber A. Herzschallregistrierung mittels differenzierende filter. Eine Studie zur Herzschallnormung. Cardiologia 1952;21:773–794.
19.van Vollenhoven E, Beneken JEW, Reuver H, Dorenbos
T.Filters for phonocardiography. Med Biol Eng 1967;5:127– 138.
20.Verburg J. Transmission of vibrations of the heart to the chest wall. In: Ghista DN, editor. Advances in Cardiovascular Physics. Volume 5, Part III, Basel: Karger; 1983. pp. 84–103.
21.Durand LG, Pibarot P. Digital signal processing of the phonocardiogram: review of the most recent advancements. Crit Rev Biomed Eng 1995: 23(3–4):163–219.
22.Vermarie¨n H. Mapping and vector analysis of heart vibration data obtained by multisite phonocardiography. In: Ghista DN, editor. Advances in Cardiovascular Physics. Volume 6, Basel: Karger; 1989. pp. 133–185.
23.Wood JC, Barry DT. Quantification of first heart sound frequency dynamics across the human chest wall. Med Biol Eng Comput 1994;32(4 Suppl):S71–78.
24.Baykal A, Ider YZ, Koymen H. Distribution of aortic mechanical prosthetic valve closure sound model parameters on the surface of the chest. IEEE Trans Biomed Eng 1995;42(4): 358–370.
25.Cozic M, Durand LG, Guardo R. Development of a cardiac acoustic mapping system. Med Biol Eng Comput 1998;36(4): 431–437.
26.Blick EF, Sabbah HN, Stein PD. One-dimensional model of diastolic semilunar valve vibrations productive of heart sounds. J Biomech 1979;12:223–227.
27.Lewkowicz M, Chadwick RS. Contraction and relaxationinduced oscillations of the left ventricle of the heart during the isovolumic phases. J Acoust Soc Am 1990;87(3):1318–1326.
28.Chin JGJ, van Herpen G, Vermarie¨n H, Wang J, Koops J, Scheerlinck R, van Vollenhoven E. Mitral valve prolapse: a comparative study with two-dimensional and Doppler echocardiography, auscultation, conventional and esophageal phonocardiography. Am J Noninvas Cardiol 1992;6:147–153.
29.Longhini C, Scorzoni D, Baracca E, Brunazzi MC, Chirillo F, Fratti D, Musacci GF. The mechanism of the physiologic disappearance of the third heart sound with aging. Jpn Heart
J1996;37(2):215–226.
30.Chen D, Pibarot P, Honos G, Durand LG. Estimation of pulmonary artery pressure by spectral analysis of the second heart sound. Am J Cardiol 1996;78(7):785–789.
31.Nygaard H, Thuesen L, Hasenkam JM, Pedersen EM, Paulsen PK. Assessing the severity of aortic valve stenosis by spectral analysis of cardiac murmurs (spectral vibrocardiography). Part I: Technical aspects. J Heart Valve Dis 1993; 2(4):454– 467.
32.Nygaard H, Thuesen L, Terp K, Hasenkam JM, Paulsen PK. Assessing the severity of aortic valve stenosis by spectral analysis of cardiac murmurs (spectral vibrocardiography). Part II: Clinical aspects. J Heart Valve Dis 1993;2(4): 468–475.
33.Sava HP, Grant PM, Mc Donnell JT. Spectral characterization and classification of Carpentier-Edwards heart valves implanted in the aortic position. IEEE Trans Biomed Eng 1996;43(10):1046–1048.
34.Sava HP, Mc Donnell JT. Spectral composition of heart sounds before and after mechanical heart valve implantation using a modified forward-backward Prony’s method. IEEE Trans Biomed Eng 1996;43(7):734–742.
35.Obaidat MS. Phonocardiogram signal analysis: techniques and performance comparison. J Med Eng Technol 1993; 17(6):221–227.
36.Xu J, Durand LG, Pibarot P. Extraction of the aortic and pulmonary components of the second heart sound using a nonlinear transient chirp signal model. IEEE Trans Biomed Eng 2001;48(3):277–283.
37.Wang W, Guo Z, Yang J, Zhang Y, Durand LG, Loew M. Analysis of the first heart sound using the matching pursuit method. Med Biol Eng Comput 2001;39(6):644–648.
38.Hult P, Fjallbrant T, Wranne B, Ask P. Detection of the third heart sound using a tailored wavelet approach. Med Biol Comput 2004;42(2):253–258.
39.Debiais F, Durand LG, Guo Z, Guardo R. Time-frequency analysis of heart murmurs, Part II: Optimisation of timefrequency representations and performance evaluation. Med Biol Eng Comput 1997;35(5):480–485.
40.Chen D, Durand LG, Lee HC, Wieting DW. Time-frequency analysis of the first heart sound. Part 3: Application to dogs with varying cardiac contractility and to patients with mitral mechanical prosthetic heart valves. Med Biol Eng Comput 1997;35(5):455–461.
41.Sava H, Pibarot P, Durand LG. Application of the matching pursuit method for structural decomposition and averaging of phonocardiographic signals. Med Biol Eng Comput 1998;36(3):302–308.
42.Manecke GR, Jr., Poppers PJ. Esophageal stethoscope placement depth: its effect on heart and lung sound monitoring during general anesthesia. Anesth Analg 1998;86(6):1276–1279.
43.Thompson WR, Hayek CS, Tuchinda C, Telford JK, Lombardo JS. Automated cardiac auscultation for detection of pathologic heart murmurs. Pediatr Cardiol 2001;22(5): 373–379.
44.Hayek CS, Thompson WR, Tuchinda C, Wojcik RA, Lombardo JS. Wavelet processing of systolic murmurs to assist with clinical diagnosis of the heart disease. Biomed Instrum Technol 2003;37(4):263–270.
45.Pavlopoulos SA, Stasis AC, Loukis EN. A decision tree—based method for the differential diagnosis of aortic stenosis from mitral regurgitation using heart sounds. Biomed Eng Online 2004;3(1):21.
46.Guo Z, Moulder C, Zou Y, Loew M, Durand LG. A virtual instrument for acquisition and analysis of the phonocardiogram and its internet-based application. Telemed J E Health 2001;7(4):333–339.
47.Stern DT, Mangrulkar RS, Gruppen LD, Lang AL, Grum CM, Judge RD. Using a multimedia tool to improve cardiac auscultation knowledge and skills. J Gen Intern Med 2001; 16(11):763–769.
48.Woywodt A, Herrmann A, Kielstein JT, Haller H, Haubitz M, Purnhagen H. A novel multimedia tool to improve bedside teaching of cardiac auscultation. Postgrad Med J 2004; 80(944):355–357.
See also ELECTROCARDIOGRAPHY, COMPUTERS IN; GRAPHIC RECORDERS.