

Mankiw Principles of Microeconomics (4th ed)
.pdf230 Public Goods and Common Resources
238 |
PART FOUR THE ECONOMICS OF THE PUBLIC SECTOR |
|
|
|
|
IN THE NEWS
Should Yellowstone
Charge as Much as
Disney World?
NATIONAL PARKS, LIKE ROADS, CAN BE
either public goods or common resources. If congestion is not a problem, a visit to a park is not rival. Yet once a park becomes popular, it suffers from the same problem as the Town Common. In this opinion column, an economist argues for the use of higher entrance fees to solve the problem.
S a v e t h e P a r k s , a n d M a k e a P r o f i t
BY ALLEN R. SANDERSON
It is common knowledge that our national parks are overcrowded, deteriorating, and broke. Some suggest that we address these problems by requiring reservations, closing some areas, or asking
Congress to increase financing to the National Park Service. But to an economist, there is a more obvious solution: Raise the entrance fees.
When the National Park Service was established in 1916, the admission price to Yellowstone for a family of five arriving by car was $7.50; today, the price is only $10. Had the 1916 price been adjusted for inflation, the comparable 1995 fee would be $120 a day— about what that family would pay for a day of rides at Disney World, . . . or to see a professional football game.
No wonder our national parks are overrun and overtrampled. We are treating our natural and historical treasures as free goods when they are not. We are ignoring the costs of maintaining these places and rationing by congestion— when it gets too crowded, no more visitors are allowed—perhaps the most inefficient way to allocate scarce resources. The price of a family’s day in a national park has not kept pace with most other forms of recreation. Systemwide, it barely averages a dollar a person. . . .
An increase in daily user fees to, say, $20 per person would either reduce
the overcrowding and deterioration in our parks by cutting down on the number of visitors or it would substantially raise fee revenues for the Park Service (assuming that legislation was passed that would let the park system keep this money). Greater revenue is the more likely outcome. After spending several hundred dollars to reach Yellowstone Park, few people would be deterred by another $20.
The added revenues would bring more possibilities for outdoor recreation, both through expansion of the National Park Service and by encouraging private entrepreneurs to carve out and operate their own parks, something they cannot do alongside a public competitor giving away his product well below cost.
It is time to put our money where our Patagonia outfits are: Either we value the Grand Canyon and Yosemite and won’t complain about paying a realistic entrance fee, or we don’t really value them and shouldn’t wring our hands over their present sorry state and likely sorrier fate.
SOURCE: The New York Times, September 30, 1995, p. 19.
different values. Second, because the oceans are so vast, enforcing any agreement is difficult. As a result, fishing rights have been a frequent source of international tension among normally friendly countries.
Within the United States, various laws aim to protect fish and other wildlife. For example, the government charges for fishing and hunting licenses, and it restricts the lengths of the fishing and hunting seasons. Fishermen are often required to throw back small fish, and hunters can kill only a limited number of animals. All these laws reduce the use of a common resource and help maintain animal populations.
CASE STUDY WHY THE COW IS NOT EXTINCT
Throughout history, many species of animals have been threatened with extinction. When Europeans first arrived in North America, more than 60 million
TLFeBOOK

Public Goods and Common Resources |
231 |
CHAPTER 11 PUBLIC GOODS AND COMMON RESOURCES |
239 |
buffalo roamed the continent. Yet hunting the buffalo was so popular during the nineteenth century that by 1900 the animal’s population fell to about 400 before the government stepped in to protect the species. In some African countries today, the elephant faces a similar challenge, as poachers kill the animals for the ivory in their tusks.
Yet not all animals with commercial value face this threat. The cow, for example, is a valuable source of food, but no one worries that the cow will soon be extinct. Indeed, the great demand for beef seems to ensure that the species will continue to thrive.
Why is the commercial value of ivory a threat to the elephant, while the commercial value of beef is a guardian of the cow? The reason is that elephants are a common resource, whereas cows are a private good. Elephants roam freely without any owners. Each poacher has a strong incentive to kill as many elephants as he can find. Because poachers are numerous, each poacher has only a slight incentive to preserve the elephant population. By contrast, cows live on ranches that are privately owned. Each rancher takes great effort to maintain the cow population on his ranch because he reaps the benefit of these efforts.
Governments have tried to solve the elephant’s problem in two ways. Some countries, such as Kenya, Tanzania, and Uganda, have made it illegal to kill elephants and sell their ivory. Yet these laws have been hard to enforce, and elephant populations have continued to dwindle. By contrast, other countries, such as Botswana, Malawi, Namibia, and Zimbabwe, have made elephants a private good by allowing people to kill elephants, but only those on their own property. Landowners now have an incentive to preserve the species on their own land, and as a result, elephant populations have started to rise. With private ownership and the profit motive now on its side, the African elephant might someday be as safe from extinction as the cow.
QUICK QUIZ: Why do governments try to limit the use of common resources?
“WILL THE MARKET PROTECT ME?”
CONCLUSION: THE IMPORTANCE
OF PROPERTY RIGHTS
In this chapter and the previous one, we have seen there are some “goods” that the market does not provide adequately. Markets do not ensure that the air we breathe is clean or that our country is defended from foreign aggressors. Instead, societies rely on the government to protect the environment and to provide for the national defense.
Although the problems we considered in these chapters arise in many different markets, they share a common theme. In all cases, the market fails to allocate resources efficiently because property rights are not well established. That is, some item of value does not have an owner with the legal authority to control it. For example, although no one doubts that the “good” of clean air or national defense is valuable, no one has the right to attach a price to it and profit from its use. A factory
TLFeBOOK

232 Public Goods and Common Resources
240 |
PART FOUR THE ECONOMICS OF THE PUBLIC SECTOR |
pollutes too much because no one charges the factory for the pollution it emits. The market does not provide for national defense because no one can charge those who are defended for the benefit they receive.
When the absence of property rights causes a market failure, the government can potentially solve the problem. Sometimes, as in the sale of pollution permits, the solution is for the government to help define property rights and thereby unleash market forces. Other times, as in the restriction on hunting seasons, the solution is for the government to regulate private behavior. Still other times, as in the provision of national defense, the solution is for the government to supply a good that the market fails to supply. In all cases, if the policy is well planned and well run, it can make the allocation of resources more efficient and thus raise economic well-being.
Summar y
Goods differ in whether they are excludable and whether they are rival. A good is excludable if it is possible to prevent someone from using it. A good is rival if one person’s enjoyment of the good prevents other people from enjoying the same unit of the good. Markets work best for private goods, which are both excludable and rival. Markets do not work as well for other types of goods.
Public goods are neither rival nor excludable. Examples of public goods include fireworks displays, national defense, and the creation of fundamental
knowledge. Because people are not charged for their use
of the public good, they have an incentive to free ride when the good is provided privately. Therefore, governments provide public goods, making their decision about the quantity based on cost-benefit analysis.
Common resources are rival but not excludable. Examples include common grazing land, clean air, and congested roads. Because people are not charged for their use of common resources, they tend to use them excessively. Therefore, governments try to limit the use of common resources.
Key Concepts
excludability, p. 226 |
public goods, p. 226 |
cost-benefit analysis, p. 231 |
rivalry, p. 226 |
common resources, p. 226 |
Tragedy of the Commons, p. 234 |
private goods, p. 226 |
free rider, p. 228 |
|
Questions for Review
1.Explain what is meant by a good being “excludable.” Explain what is meant by a good being “rival.” Is a pizza excludable? Is it rival?
2.Define and give an example of a public good. Can the private market provide this good on its own? Explain.
3.What is cost-benefit analysis of public goods? Why is it important? Why is it hard?
4.Define and give an example of a common resource. Without government intervention, will people use this good too much or too little? Why?
TLFeBOOK

Public Goods and Common Resources |
233 |
CHAPTER 11 PUBLIC GOODS AND COMMON RESOURCES |
241 |
Problems and Applications
1.The text says that both public goods and common resources involve externalities.
a.Are the externalities associated with public goods generally positive or negative? Use examples in your answer. Is the free-market quantity of public goods generally greater or less than the efficient quantity?
b.Are the externalities associated with common resources generally positive or negative? Use examples in your answer. Is the free-market use of common resources generally greater or less than the efficient use?
2.Think about the goods and services provided by your local government.
a.Using the classification in Figure 11-1, explain what category each of the following goods falls into:
police protection
snow plowing
education
rural roads
city streets
b.Why do you think the government provides items that are not public goods?
3.Charlie loves watching Teletubbies on his local public TV station, but he never sends any money to support the station during their fund-raising drives.
a.What name do economists have for Charlie?
b.How can the government solve the problem caused by people like Charlie?
c.Can you think of ways the private market can solve this problem? How does the existence of cable TV alter the situation?
4.The text states that private firms will not undertake the efficient amount of basic scientific research.
a.Explain why this is so. In your answer, classify basic research in one of the categories shown in Figure 11-1.
b.What sort of policy has the United States adopted in response to this problem?
c.It is often argued that this policy increases the technological capability of American producers relative to that of foreign firms. Is this argument consistent with your classification of basic research in part (a)? (Hint: Can excludability apply to some potential beneficiaries of a public good and not others?)
5.Why is there litter along most highways but rarely in people’s yards?
6.The Washington, D.C., metro (subway) system charges higher fares during rush hours than during the rest of the day. Why might it do this?
7.Timber companies in the United States cut down many trees on publicly owned land and many trees on privately owned land. Discuss the likely efficiency of logging on each type of land in the absence of government regulation. How do you think the government should regulate logging on publicly owned lands? Should similar regulations apply to privately owned land?
8.An Economist article (March 19, 1994) states: “In the past decade, most of the rich world’s fisheries have been exploited to the point of near-exhaustion.” The article continues with an analysis of the problem and a discussion of possible private and government solutions:
a.“Do not blame fishermen for overfishing. They are behaving rationally, as they have always done.” In what sense is “overfishing” rational for fishermen?
b.“A community, held together by ties of obligation and mutual self-interest, can manage a common resource on its own.” Explain how such management can work in principle, and what obstacles it faces in the real world.
c.“Until 1976 most world fish stocks were open to all comers, making conservation almost impossible. Then an international agreement extended some aspects of [national] jurisdiction from 12 to 200 miles offshore.” Using the concept of property rights, discuss how this agreement reduces the scope of the problem.
d.The article notes that many governments come to the aid of suffering fishermen in ways that encourage increased fishing. How do such policies encourage a vicious cycle of overfishing?
e.“Only when fishermen believe they are assured a long-term and exclusive right to a fishery are they likely to manage it in the same far-sighted way as good farmers manage their land.” Defend this statement.
f.What other policies to reduce overfishing might be considered?
9.In a market economy, information about the quality or function of goods and services is a valuable good in its
TLFeBOOK
234 Public Goods and Common Resources
242 |
PART FOUR THE ECONOMICS OF THE PUBLIC SECTOR |
own right. How does the private market provide this information? Can you think of any way in which the government plays a role in providing this information?
10.Do you think the Internet is a public good? Why or why not?
11.High-income people are willing to pay more than lowerincome people to avoid the risk of death. For example,
they are more likely to pay for safety features on cars. Do you think cost-benefit analysts should take this fact into account when evaluating public projects? Consider, for instance, a rich town and a poor town, both of which are considering the installation of a traffic light. Should the rich town use a higher dollar value for a human life in making this decision? Why or why not?
TLFeBOOK

12
T H E D E S I G N O F
T H E T A X S Y S T E M
Al “Scarface” Capone, the notorious 1920s gangster and crime boss, was never convicted for his many violent crimes. Yet eventually he did go to jail—for tax evasion. He had neglected to heed Ben Franklin’s observation that “in this world nothing is certain, but death and taxes.”
When Franklin made this claim in 1789, the average American paid less than 5 percent of his income in taxes, and that remained true for the next hundred years. Over the course of the twentieth century, however, taxes have become ever more important in the life of the typical person. Today, all taxes taken together— including personal income taxes, corporate income taxes, payroll taxes, sales taxes, and property taxes—use up about a third of the average American’s income. In many European countries, the tax bite is even larger.
Taxes are inevitable because we as citizens expect the government to provide us with various goods and services. The previous two chapters have started to
243
IN THIS CHAPTER YOU WILL . . .
Get an over view of how the U . S . government raises and spends money
Examine the ef ficiency costs
of taxes
Learn alternative ways to judge the equity of a tax system
See why studying tax incidence is cr ucial for evaluating tax equity
Consider the tradeof f between ef ficiency and equity in the design of a tax system
235
TLFeBOOK

236 The Design of the Tax System
244 |
PART FOUR THE ECONOMICS OF THE PUBLIC SECTOR |
shed light on one of the Ten Principles of Economics from Chapter 1: The government can sometimes improve market outcomes. When the government remedies an externality (such as air pollution), provides a public good (such as national defense), or regulates the use of a common resource (such as fish in a public lake), it can raise economic well-being. Yet the benefits of government come with costs. For the government to perform these and its many other functions, it needs to raise revenue through taxation.
We began our study of taxation in earlier chapters, where we saw how a tax on a good affects supply and demand for that good. In Chapter 6 we saw that a tax reduces the quantity sold in a market, and we examined how the burden of a tax is shared by buyers and sellers, depending on the elasticities of supply and demand. In Chapter 8 we examined how taxes affect economic well-being. We learned that taxes cause deadweight losses: The reduction in consumer and producer surplus resulting from a tax exceeds the revenue raised by the government.
In this chapter we build on these lessons to discuss the design of a tax system. We begin with a financial overview of the U.S. government. When thinking about the tax system, it is useful to know some basic facts about how the U.S. government raises and spends money. We then consider the fundamental principles of taxation. Most people agree that taxes should impose as small a cost on society as possible and that the burden of taxes should be distributed fairly. That is, the tax system should be both efficient and equitable. As we will see, however, stating these goals is easier than achieving them.
A FINANCIAL OVERVIEW OF
THE U.S. GOVERNMENT
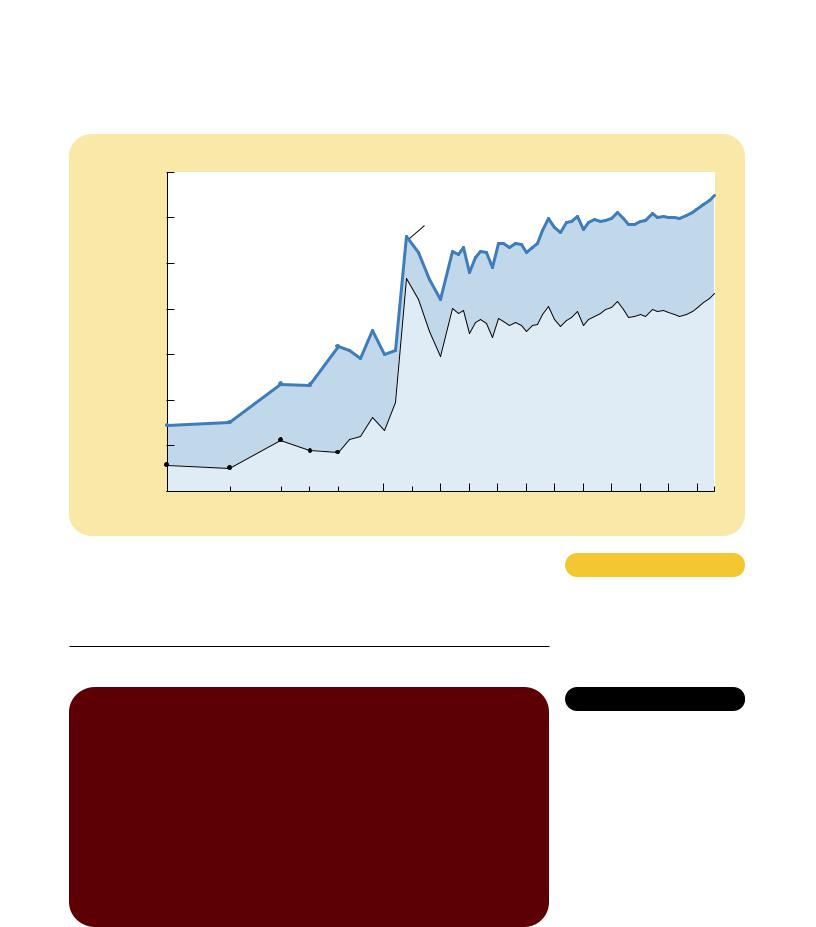
How much of the nation’s income does the government take as taxes? Figure 12-1 shows government revenue, including federal, state, and local governments, as a percentage of total income for the U.S. economy. It shows that, over time, the government has taken a larger and larger share of total income. In 1902, the government collected 7 percent of total income; in 1998, it collected 32 percent. In other words, as the economy’s income has grown, the government has grown even more.
Table 12-1 compares the tax burden for several major countries, as measured by the central government’s tax revenue as a percentage of the nation’s total income. The United States is in the middle of the pack. The U.S. tax burden is low compared to many European countries, but it is high compared to many other nations around the world. Poor countries, such as India and Pakistan, usually have relatively low tax burdens. This fact is consistent with the evidence in Figure 12-1 of a growing tax burden over time: As a nation gets richer, the government typically takes a larger share of income in taxes.
The overall size of government tells only part of the story. Behind the total dollar figures lie thousands of individual decisions about taxes and spending. To understand the government’s finances more fully, let’s look at how the total breaks down into some broad categories.
TLFeBOOK
The Design of the Tax System |
237 |
CHAPTER 12 THE DESIGN OF THE TAX SYSTEM |
245 |
Revenue as
Percent of |
35 |
|
|
|
|
|
|
|
|
|
GDP |
|
|
|
|
|
|
|
|
|
|
|
30 |
|
|
|
Total government |
|
|
|
|
|
|
|
|
|
|
|
|
|
|
||
|
25 |
|
|
|
|
|
|
|
|
|
|
|
|
|
|
|
State and local |
|
|
|
|
|
20 |
|
|
|
|
|
|
|
|
|
|
15 |
|
|
|
|
|
|
|
|
|
|
|
|
|
|
|
Federal |
|
|
|
|
|
10 |
|
|
|
|
|
|
|
|
|
|
5 |
|
|
|
|
|
|
|
|
|
|
0 |
|
|
|
|
|
|
|
|
|
|
1902 |
1913 |
1922 1927 1932 |
1940 |
1950 |
1960 |
1970 |
1980 |
1990 |
1998 |
GOVERNMENT REVENUE AS A PERCENTAGE OF GDP. This figure shows revenue of the federal government and of state and local governments as a percentage of gross domestic product (GDP), which measures total income in the economy. It shows that the government plays a large role in the U.S. economy and that its role has grown over time.
SOURCE: Historical Statistics of the United States; Economic Report of the President 1999; and author’s calculations.
France |
38.8% |
United Kingdom |
33.7 |
Germany |
29.4 |
Brazil |
19.7 |
United States |
19.3 |
Canada |
18.5 |
Russia |
17.4 |
Pakistan |
15.3 |
Indonesia |
14.7 |
Mexico |
12.8 |
India |
10.3 |
|
|
Figure 12-1
Table 12-1
CENTRAL GOVERNMENT TAX
REVENUE AS A PERCENT OF GDP
SOURCE: World Development Report 1998/99.
TLFeBOOK

238 The Design of the Tax System
246 |
PART FOUR THE ECONOMICS OF THE PUBLIC SECTOR |
THE FEDERAL GOVERNMENT
Table 12-2
RECEIPTS OF THE FEDERAL
GOVERNMENT: 1999
The U.S. federal government collects about two-thirds of the taxes in our economy. It raises this money in a number of ways, and it finds even more ways to spend it.
Receipts Table 12-2 shows the receipts of the federal government in 1999. Total receipts in this year were $1,806 billion, a number so large that it is hard to comprehend. To bring this astronomical number down to earth, we can divide it by the size of the U.S. population, which was about 272 million in 1999. We then find that the average American paid $6,639 to the federal government. A typical family of four paid $26,556.
The largest source of revenue for the federal government is the individual income tax. As April 15 approaches, almost every American family fills out a tax form to determine how much income tax it owes the government. Each family is required to report its income from all sources: wages from working, interest on savings, dividends from corporations in which it owns shares, profits from any small businesses it operates, and so on. The family’s tax liability (how much it owes) is then based on its total income.
A family’s income tax liability is not simply proportional to its income. Instead, the law requires a more complicated calculation. Taxable income is computed as total income minus an amount based on the number of dependents (primarily children) and minus certain expenses that policymakers have deemed “deductible” (such as mortgage interest payments and charitable giving). Then the tax liability is calculated from taxable income using the schedule shown in Table 12-3. This table presents the marginal tax rate—the tax rate applied to each additional dollar of income. Because the marginal tax rate rises as income rises, higher-income families pay a larger percentage of their income in taxes. (We discuss the concept of marginal tax rate more fully later in this chapter.)
Almost as important to the federal government as the individual income tax are payroll taxes. A payroll tax is a tax on the wages that a firm pays its workers. Table 12-2 calls this revenue social insurance taxes because the revenue from these taxes is earmarked to pay for Social Security and Medicare. Social Security is an income support program, designed primarily to maintain the living standards of the elderly. Medicare is the government health program for the elderly. Table 12-2 shows that the average American paid $2,239 in social insurance taxes in 1999.
|
AMOUNT |
AMOUNT |
PERCENT |
|
TAX |
(IN BILLIONS) |
PER PERSON |
OF RECEIPTS |
|
|
|
|
|
|
Individual income taxes |
$ |
869 |
$3,194 |
48% |
Social insurance taxes |
|
609 |
2,239 |
34 |
Corporate income taxes |
|
182 |
669 |
10 |
Other |
|
146 |
537 |
8 |
Total |
$ |
1,806 |
$6,639 |
100% |
|
|
|
|
|
SOURCE: Economic Report of the President, 1999, table B-80.
TLFeBOOK

The Design of the Tax System |
239 |
CHAPTER 12 THE DESIGN OF THE TAX SYSTEM |
247 |
ON TAXABLE INCOME . . . |
THE TAX RATE IS . . . |
Up to $25,750 |
15.0% |
From $25,750 to $62,450 |
28.0 |
From $62,450 to $130,250 |
31.0 |
From $130,250 to $283,150 |
36.0 |
Over $283,150 |
39.6 |
|
|
Next in magnitude, but much smaller than either individual income taxes or social insurance taxes, is the corporate income tax. A corporation is a business that is set up as a separate legal entity. The government taxes each corporation based on its profit—the amount the corporation receives for the goods or services it sells minus the costs of producing those goods or services. Notice that corporate profits are, in essence, taxed twice. They are taxed once by the corporate income tax when the corporation earns the profits; they are taxed a second time by the individual income tax when the corporation uses its profits to pay dividends to its shareholders.
The last category, labeled “other” in Table 12-2, makes up 8 percent of receipts. This category includes excise taxes, which are taxes on specific goods like gasoline, cigarettes, and alcoholic beverages. It also includes various small items, such as estate taxes and customs duties.
Spending Table 12-4 shows the spending of the federal government in 1999. Total spending was $1,727 billion, or $6,350 per person. This table also shows how the federal government’s spending was divided among major categories.
The largest category in Table 12-4 is Social Security, which represents mostly transfer payments to the elderly. (A transfer payment is a government payment not made in exchange for a good or service.) This category made up 23 percent of spending by the federal government in 1999 and is growing in importance. The reason for its growth is that increases in life expectancy and decreases in birthrates have caused the elderly population to grow more rapidly than the total population. Most analysts expect this trend to continue for many years into the future.
The second largest category of spending is national defense. This includes both the salaries of military personnel and the purchases of military equipment such as guns, fighter jets, and warships. Spending on national defense fluctuates over time as international tensions and the political climate change. Not surprisingly, spending on national defense rises substantially during wars.
The third category is spending on income security, which includes transfer payments to poor families. One program is Temporary Assistance for Needy Families (TANF), often simply called “welfare.” Another is the Food Stamp program, which gives poor families vouchers that they can use to buy food. The federal government pays some of this money to state and local governments, which administer the programs under federal guidelines.
A bit smaller than spending on income security is net interest. When a person borrows from a bank, the bank requires the borrower to pay interest for the loan. The same is true when the government borrows from the public. The more indebted the government, the larger the amount it must spend in interest payments.
Table 12-3
THE FEDERAL INCOME TAX
RATES: 1999. This table shows the marginal tax rates for an unmarried taxpayer. The taxes owed by a taxpayer depend on all the marginal tax rates up to his or her income level. For example, a taxpayer with income of $50,000 pays 15 percent of the first $25,750 of income, and then 28 percent of the rest.
TLFeBOOK