

Mankiw Principles of Microeconomics (4th ed)
.pdf150 Consumers, Producers, and the Efficiency of Markets
156 |
PART THREE SUPPLY AND DEMAND II: MARKETS AND WELFARE |
|
|
|
|
IN THE NEWS
Ticket Scalping
IF AN ECONOMY IS TO ALLOCATE ITS SCARCE
resources efficiently, goods must get to those consumers who value them most highly. Ticket scalping is one example of how markets reach efficient outcomes. Scalpers buy tickets to plays, concerts, and sports events and then sell the tickets at a price above their original cost. By charging the highest price the market will bear, scalpers help ensure that consumers with the greatest willingness to pay for the tickets actually do get them. In some places, however, there is debate over whether this market activity should be legal.
Ti c k e t s ? S u p p l y M e e t s
D e m a n d o n S i d e w a l k
BY JOHN TIERNEY
Ticket scalping has been very good to Kevin Thomas, and he makes no apologies. He sees himself as a classic American entrepreneur: a high school dropout from the Bronx who taught himself a trade, works seven nights a week, earns $40,000 a year, and at age twenty-six has $75,000 in savings, all by providing a public service outside New York’s theaters and sports arenas.
He has just one complaint. “I’ve been busted about 30 times in the last year,” he said one recent evening, just after making $280 at a Knicks game. “You learn to deal with it—I give the cops a fake name, and I pay the fines when I have to, but I don’t think it’s fair. I look at scalping like working as a stockbroker, buying low and selling high. If people are willing to pay me the money, what kind of problem is that?”
It is a significant problem to public officials in New York and New Jersey,
THE INVISIBLE HAND AT WORK
who are cracking down on street scalpers like Mr. Thomas and on licensed ticket brokers. Undercover officers are enforcing new restrictions on reselling tickets at marked-up prices, and the attorneys general of the two states are pressing well-publicized
even though each buyer and seller in a market is concerned only about his or her own welfare, they are together led by an invisible hand to an equilibrium that maximizes the total benefits to buyers and sellers.
A word of warning is in order. To conclude that markets are efficient, we made several assumptions about how markets work. When these assumptions do not hold, our conclusion that the market equilibrium is efficient may no longer be true. As we close this chapter, let’s consider briefly two of the most important of these assumptions.
First, our analysis assumed that markets are perfectly competitive. In the world, however, competition is sometimes far from perfect. In some markets, a single buyer or seller (or a small group of them) may be able to control market prices. This ability to influence prices is called market power. Market power can cause markets to be inefficient because it keeps the price and quantity away from the equilibrium of supply and demand.
Second, our analysis assumed that the outcome in a market matters only to the buyers and sellers in that market. Yet, in the world, the decisions of buyers and
TLFeBOOK

Consumers, Producers, and the Efficiency of Markets |
151 |
CHAPTER 7 CONSUMERS, PRODUCERS, AND THE EFFICIENCY OF MARKETS |
157 |
|
|
|
|
cases against more than a dozen ticket brokers.
But economists tend to see scalping from Mr. Thomas’s perspective. To them, the governments’ crusade makes about as much sense as the old campaigns by Communist authorities against “profiteering.” Economists argue that the restrictions inconvenience the public, reduce the audience for cultural and sports events, waste the police’s time, deprive New York City of tens of millions of dollars of tax revenue, and actually drive up the cost of many tickets.
“It is always good politics to pose as defender of the poor by declaring high prices illegal,” says William J. Baumol, the director of the C. V. Starr Center for Applied Economics at New York University. “I expect politicians to try to solve the AIDS crisis by declaring AIDS illegal as well. That would be harmless, because nothing would happen, but when you outlaw high prices you create real problems.”
Dr. Baumol was one of the economists who came up with the idea of sell-
ing same-day Broadway tickets for half price at the TKTS booth in Times Square, which theater owners thought dangerously radical when the booth opened in 1973. But the owners have profited by finding a new clientele for tickets that would have gone unsold, an illustration of the free-market tenet that both buyers and sellers ultimately benefit when price is adjusted to meet demand.
Economists see another illustration of that lesson at the Museum of Modern Art, where people wait in line for up to two hours to buy tickets for the Matisse exhibit. But there is an alternative on the sidewalk: Scalpers who evade the police have been selling the $12.50 tickets to the show at prices ranging from $20 to $50.
“You don’t have to put a very high value on your time to pay $10 or $15 to avoid standing in line for two hours for a Matisse ticket,” said Richard H. Thaler, an economist at Cornell University. “Some people think it’s fairer to make everyone stand in line, but that forces everyone to engage in a totally unpro-
ductive activity, and it discriminates in favor of people who have the most free time. Scalping gives other people a chance, too. I can see no justification for outlawing it.” . . .
Politicians commonly argue that without anti-scalping laws, tickets would become unaffordable to most people, but California has no laws against scalping, and ticket prices there are not notoriously high. And as much as scalpers would like to inflate prices, only a limited number of people are willing to pay $100 for a ticket. . . .
Legalizing scalping, however, would not necessarily be good news for everyone. Mr. Thomas, for instance, fears that the extra competition might put him out of business. But after 16 years—he started at age ten outside of Yankee Stadium—he is thinking it might be time for a change anyway.
SOURCE: The New York Times, December 26, 1992, p. A1.
sellers sometimes affect people who are not participants in the market at all. Pollution is the classic example of a market outcome that affects people not in the market. Such side effects, called externalities, cause welfare in a market to depend on more than just the value to the buyers and the cost to the sellers. Because buyers and sellers do not take these side effects into account when deciding how much to consume and produce, the equilibrium in a market can be inefficient from the standpoint of society as a whole.
Market power and externalities are examples of a general phenomenon called market failure—the inability of some unregulated markets to allocate resources efficiently. When markets fail, public policy can potentially remedy the problem and increase economic efficiency. Microeconomists devote much effort to studying when market failure is likely and what sorts of policies are best at correcting market failures. As you continue your study of economics, you will see that the tools of welfare economics developed here are readily adapted to that endeavor.
Despite the possibility of market failure, the invisible hand of the marketplace is extraordinarily important. In many markets, the assumptions we made in this
TLFeBOOK

152 Consumers, Producers, and the Efficiency of Markets
158 |
PART THREE SUPPLY AND DEMAND II: MARKETS AND WELFARE |
chapter work well, and the conclusion of market efficiency applies directly. Moreover, our analysis of welfare economics and market efficiency can be used to shed light on the effects of various government policies. In the next two chapters we apply the tools we have just developed to study two important policy issues—the welfare effects of taxation and of international trade.
Summar y
Consumer surplus equals buyers’ willingness to pay for a good minus the amount they actually pay for it, and it measures the benefit buyers get from participating in a market. Consumer surplus can be computed by finding the area below the demand curve and above the price.
Producer surplus equals the amount sellers receive for their goods minus their costs of production, and it measures the benefit sellers get from participating in a market. Producer surplus can be computed by finding the area below the price and above the supply curve.
An allocation of resources that maximizes the sum of consumer and producer surplus is said to be efficient.
Policymakers are often concerned with the efficiency, as well as the equity, of economic outcomes.
The equilibrium of supply and demand maximizes the sum of consumer and producer surplus. That is, the invisible hand of the marketplace leads buyers and sellers to allocate resources efficiently.
Markets do not allocate resources efficiently in the presence of market failures such as market power or externalities.
|
Key Concepts |
|
|
|
|
|
|
welfare economics, p. 142 |
cost, p. 148 |
efficiency, p. 153 |
|
willingness to pay, p. 142 |
producer surplus, p. 148 |
equity, p. 153 |
|
consumer surplus, p. 143 |
|
|
|
|
|
|
|
|
Questions for Review |
|
|
|
|
|
|
1.Explain how buyers’ willingness to pay, consumer surplus, and the demand curve are related.
2.Explain how sellers’ costs, producer surplus, and the supply curve are related.
3.In a supply-and-demand diagram, show producer and consumer surplus in the market equilibrium.
4.What is efficiency? Is it the only goal of economic policymakers?
5.What does the invisible hand do?
6.Name two types of market failure. Explain why each may cause market outcomes to be inefficient.
Problems and Applications
1.An early freeze in California sours the lemon crop. What happens to consumer surplus in the market for lemons? What happens to consumer surplus in the market for lemonade? Illustrate your answers with diagrams.
2.Suppose the demand for French bread rises. What happens to producer surplus in the market for French bread? What happens to producer surplus in the market for flour? Illustrate your answer with diagrams.
TLFeBOOK
Consumers, Producers, and the Efficiency of Markets |
153 |
CHAPTER 7 CONSUMERS, PRODUCERS, AND THE EFFICIENCY OF MARKETS |
159 |
3.It is a hot day, and Bert is very thirsty. Here is the value he places on a bottle of water:
Value of first bottle |
$7 |
Value of second bottle |
5 |
Value of third bottle |
3 |
Value of fourth bottle |
1 |
a.From this information, derive Bert’s demand schedule. Graph his demand curve for bottled water.
b.If the price of a bottle of water is $4, how many bottles does Bert buy? How much consumer surplus does Bert get from his purchases? Show Bert’s consumer surplus in your graph.
c.If the price falls to $2, how does quantity demanded change? How does Bert’s consumer surplus change? Show these changes in your graph.
4.Ernie owns a water pump. Because pumping large amounts of water is harder than pumping small amounts, the cost of producing a bottle of water rises as he pumps more. Here is the cost he incurs to produce each bottle of water:
Cost of first bottle |
$1 |
Cost of second bottle |
3 |
Cost of third bottle |
5 |
Cost of fourth bottle |
7 |
a.From this information, derive Ernie’s supply schedule. Graph his supply curve for bottled water.
b.If the price of a bottle of water is $4, how many bottles does Ernie produce and sell? How much producer surplus does Ernie get from these sales? Show Ernie’s producer surplus in your graph.
c.If the price rises to $6, how does quantity supplied change? How does Ernie’s producer surplus change? Show these changes in your graph.
5.Consider a market in which Bert from Problem 3 is the buyer and Ernie from Problem 4 is the seller.
a.Use Ernie’s supply schedule and Bert’s demand schedule to find the quantity supplied and quantity demanded at prices of $2, $4, and $6. Which of these prices brings supply and demand into equilibrium?
b.What are consumer surplus, producer surplus, and total surplus in this equilibrium?
c.If Ernie produced and Bert consumed one less bottle of water, what would happen to total surplus?
d.If Ernie produced and Bert consumed one additional bottle of water, what would happen to total surplus?
6.The cost of producing stereo systems has fallen over the past several decades. Let’s consider some implications of this fact.
a.Use a supply-and-demand diagram to show the effect of falling production costs on the price and quantity of stereos sold.
b.In your diagram, show what happens to consumer surplus and producer surplus.
c.Suppose the supply of stereos is very elastic. Who benefits most from falling production costs— consumers or producers of stereos?
7.There are four consumers willing to pay the following amounts for haircuts:
Jerry: $7 |
Oprah: $2 |
Sally Jessy: $8 |
Montel: $5 |
There are four haircutting businesses with the following costs:
Firm A: $3 |
Firm B: $6 |
Firm C: $4 |
Firm D: $2 |
Each firm has the capacity to produce only one haircut. For efficiency, how many haircuts should be given? Which businesses should cut hair, and which consumers should have their hair cut? How large is the maximum possible total surplus?
8.Suppose a technological advance reduces the cost of making computers.
a.Use a supply-and-demand diagram to show what happens to price, quantity, consumer surplus, and producer surplus in the market for computers.
b.Computers and adding machines are substitutes. Use a supply-and-demand diagram to show what happens to price, quantity, consumer surplus, and producer surplus in the market for adding machines. Should adding machine producers be happy or sad about the technological advance in computers?
c.Computers and software are complements. Use a supply-and-demand diagram to show what happens to price, quantity, consumer surplus, and producer surplus in the market for software. Should software producers be happy or sad about the technological advance in computers?
d.Does this analysis help explain why Bill Gates, a software producer, is one of the world’s richest men?
TLFeBOOK
154 Consumers, Producers, and the Efficiency of Markets
160 |
PART THREE SUPPLY AND DEMAND II: MARKETS AND WELFARE |
9.Consider how health insurance affects the quantity of health care services performed. Suppose that the typical medical procedure has a cost of $100, yet a person with health insurance pays only $20 out-of-pocket when she chooses to have an additional procedure performed. Her insurance company pays the remaining $80. (The insurance company will recoup the $80 through higher premiums for everybody, but the share paid by this individual is small.)
a.Draw the demand curve in the market for medical care. (In your diagram, the horizontal axis should represent the number of medical procedures.) Show the quantity of procedures demanded if each procedure has a price of $100.
b.On your diagram, show the quantity of procedures demanded if consumers pay only $20 per procedure. If the cost of each procedure to society is truly $100, and if individuals have health insurance as just described, will the number of procedures performed maximize total surplus? Explain.
c.Economists often blame the health insurance system for excessive use of medical care. Given your analysis, why might the use of care be viewed as “excessive”?
d.What sort of policies might prevent this excessive use?
10.Many parts of California experienced a severe drought in the late 1980s and early 1990s.
a.Use a diagram of the water market to show the effects of the drought on the equilibrium price and quantity of water.
b.Many communities did not allow the price of water to change, however. What is the effect of this policy on the water market? Show on your diagram any surplus or shortage that arises.
c.A 1991 op-ed piece in The Wall Street Journal stated that “all Los Angeles residents are required to cut their water usage by 10 percent as of March 1 and another 5 percent starting May 1, based on their 1986 consumption levels.” The author criticized this policy on both efficiency and equity grounds, saying “not only does such a policy reward families who ‘wasted’ more water back in 1986, it does little to encourage consumers who could make more drastic reductions, [and] . . . punishes consumers who cannot so readily reduce their water use.” In what way is the Los Angeles system for allocating water inefficient? In what way does the system seem unfair?
d.Suppose instead that Los Angeles allowed the price of water to increase until the quantity demanded equaled the quantity supplied. Would the resulting allocation of water be more efficient? In your view, would it be more or less fair than the proportionate reductions in water use mentioned in the newspaper article? What could be done to make the market solution more fair?
TLFeBOOK
8
A P P L I C A T I O N : T H E C O S T S
O F T A X A T I O N
Taxes are often a source of heated political debate. In 1776 the anger of the American colonies over British taxes sparked the American Revolution. More than two centuries later Ronald Reagan was elected president on a platform of large cuts in personal income taxes, and during his eight years in the White House the top tax rate on income fell from 70 percent to 28 percent. In 1992 Bill Clinton was elected in part because incumbent George Bush had broken his 1988 campaign promise, “Read my lips: no new taxes.”
We began our study of taxes in Chapter 6. There we saw how a tax on a good affects its price and the quantity sold and how the forces of supply and demand divide the burden of a tax between buyers and sellers. In this chapter we extend this analysis and look at how taxes affect welfare, the economic well-being of participants in a market.
161
IN THIS CHAPTER YOU WILL . . .
Examine how taxes r educe consumer and pr oducer surplus
Learn the meaning and causes of the deadweight loss of a tax
Consider why some taxes have lar ger deadweight losses than others
Examine how tax r evenue and deadweight loss var y with the size of a tax
155
TLFeBOOK

156 Application: The Costs of Taxation
162 |
PART THREE SUPPLY AND DEMAND II: MARKETS AND WELFARE |
“You know, the idea of taxation with representation doesn’t appeal to me very much, either.”
The effects of taxes on welfare might at first seem obvious. The government enacts taxes to raise revenue, and that revenue must come out of someone’s pocket. As we saw in Chapter 6, both buyers and sellers are worse off when a good is taxed: A tax raises the price buyers pay and lowers the price sellers receive. Yet to understand fully how taxes affect economic well-being, we must compare the reduced welfare of buyers and sellers to the amount of revenue the government raises. The tools of consumer and producer surplus allow us to make this comparison. The analysis will show that the costs of taxes to buyers and sellers exceeds the revenue raised by the government.
THE DEADWEIGHT LOSS OF TAXATION
We begin by recalling one of the surprising lessons from Chapter 6: It does not matter whether a tax on a good is levied on buyers or sellers of the good. When a tax is levied on buyers, the demand curve shifts downward by the size of the tax; when it is levied on sellers, the supply curve shifts upward by that amount. In either case, when the tax is enacted, the price paid by buyers rises, and the price received by sellers falls. In the end, buyers and sellers share the burden of the tax, regardless of how it is levied.
Figure 8-1 shows these effects. To simplify our discussion, this figure does not show a shift in either the supply or demand curve, although one curve must shift. Which curve shifts depends on whether the tax is levied on sellers (the supply curve shifts) or buyers (the demand curve shifts). In this chapter, we can simplify the graphs by not bothering to show the shift. The key result for our purposes here
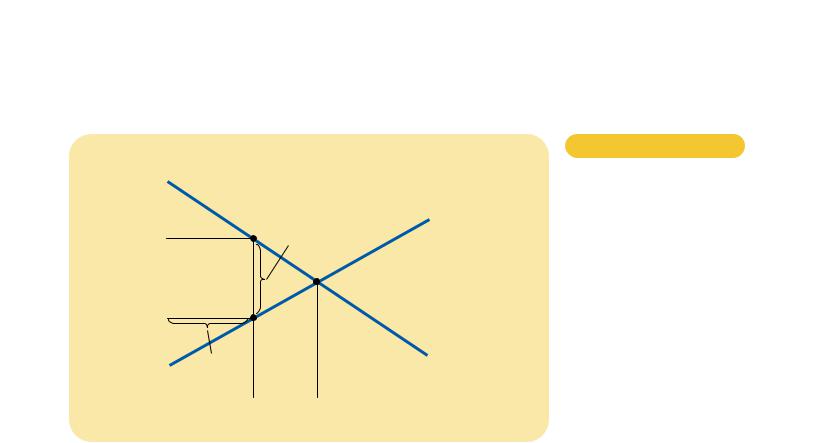
Figur e 8-1
THE EFFECTS OF A TAX. A tax
on a good places a wedge between the price that buyers pay and the price that sellers receive. The quantity of the good sold falls.
Price |
|
|
|
|
|
|
Supply |
Price buyers |
|
Size of tax |
|
pay |
|
|
|
|
|
|
|
Price |
|
|
|
without tax |
|
|
|
Price sellers |
|
|
|
receive |
|
|
|
|
|
|
Demand |
0 |
Quantity |
Quantity |
Quantity |
|
with tax |
without tax |
|
TLFeBOOK
Application: The Costs of Taxation |
157 |
CHAPTER 8 APPLICATION: THE COSTS OF TAXATION |
163 |
Price |
|
|
|
|
|
|
|
|
Supply |
Price buyers |
|
|
Size of tax (T ) |
|
|
|
|
||
pay |
|
|
|
|
Tax |
|
|
|
|
|
|
|
|
|
|
revenue |
|
|
|
|
(T Q ) |
|
|
|
Price sellers |
|
|
|
|
|
|
|
|
|
receive |
|
|
|
|
|
Quantity |
|
Demand |
|
|
|
|
||
|
sold (Q) |
|
|
|
|
|
|
|
|
0 |
Quantity |
Quantity |
Quantity |
|
|
with tax |
without tax |
|
|
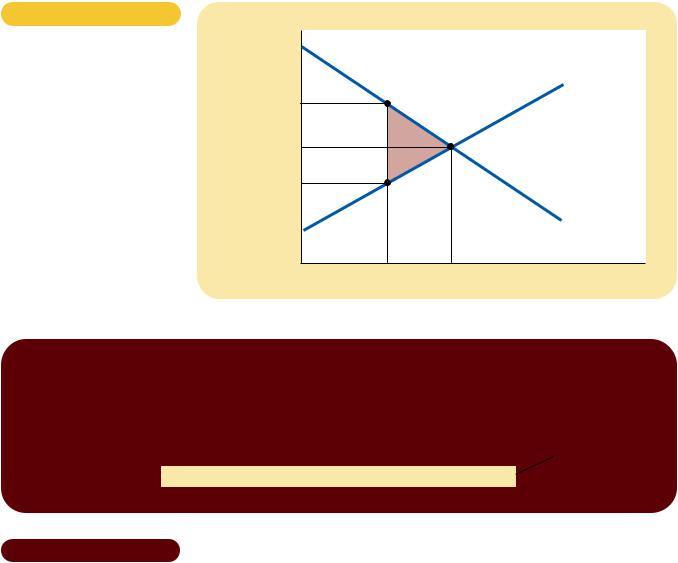
Figur e 8-2
TAX REVENUE. The tax revenue that the government collects equals T Q, the size of the tax T times the quantity sold Q. Thus, tax revenue equals the area of the rectangle between the supply and demand curves.
is that the tax places a wedge between the price buyers pay and the price sellers receive. Because of this tax wedge, the quantity sold falls below the level that would be sold without a tax. In other words, a tax on a good causes the size of the market for the good to shrink. These results should be familiar from Chapter 6.
HOW A TAX AFFECTS MARKET PARTICIPANTS
Now let’s use the tools of welfare economics to measure the gains and losses from a tax on a good. To do this, we must take into account how the tax affects buyers, sellers, and the government. The benefit received by buyers in a market is measured by consumer surplus—the amount buyers are willing to pay for the good minus the amount they actually pay for it. The benefit received by sellers in a market is measured by producer surplus—the amount sellers receive for the good minus their costs. These are precisely the measures of economic welfare we used in Chapter 7.
What about the third interested party, the government? If T is the size of the tax and Q is the quantity of the good sold, then the government gets total tax revenue of T Q. It can use this tax revenue to provide services, such as roads, police, and public education, or to help the needy. Therefore, to analyze how taxes affect economic well-being, we use tax revenue to measure the government’s benefit from the tax. Keep in mind, however, that this benefit actually accrues not to government but to those on whom the revenue is spent.
Figure 8-2 shows that the government’s tax revenue is represented by the rectangle between the supply and demand curves. The height of this rectangle is the size of the tax, T, and the width of the rectangle is the quantity of the good sold, Q. Because a rectangle’s area is its height times its width, this rectangle’s area is T Q, which equals the tax revenue.
TLFeBOOK
158 |
Application: The Costs of Taxation |
164 |
PART THREE SUPPLY AND DEMAND II: MARKETS AND WELFARE |
Welfar e without a Tax To see how a tax affects welfare, we begin by considering welfare before the government has imposed a tax. Figure 8-3 shows the supply-and-demand diagram and marks the key areas with the letters A through F.
Without a tax, the price and quantity are found at the intersection of the supply and demand curves. The price is P1, and the quantity sold is Q1. Because the demand curve reflects buyers’ willingness to pay, consumer surplus is the area between the demand curve and the price, A B C. Similarly, because the supply curve reflects sellers’ costs, producer surplus is the area between the supply curve and the price, D E F. In this case, because there is no tax, tax revenue equals zero.
Total surplus, the sum of consumer and producer surplus, equals the area A B C D E F. In other words, as we saw in Chapter 7, total surplus is the area between the supply and demand curves up to the equilibrium quantity. The first column of Table 8-1 summarizes these conclusions.
Figur e 8-3
HOW A TAX AFFECTS WELFARE.
A tax on a good reduces consumer surplus (by the area B C) and producer surplus (by the area D E). Because the fall in producer and consumer
surplus exceeds tax revenue (area B D), the tax is said to impose a deadweight loss (area C E).
|
Price |
|
|
|
Price |
|
A |
|
Supply |
|
|
|
||
buyers PB |
|
|
|
|
pay |
|
|
|
|
|
|
B |
C |
|
Price |
P1 |
|
|
|
|
|
|
||
without tax |
|
E |
|
|
Price |
|
D |
|
|
|
|
|
||
|
|
|
|
|
sellers PS |
|
|
|
|
receive |
|
F |
|
|
|
|
|
|
|
|
|
|
|
Demand |
|
0 |
Q2 |
Q1 |
Quantity |
|
WITHOUT TAX |
WITH TAX |
CHANGE |
|
|
|
|
Consumer Surplus |
A B C |
A |
(B C) |
Producer Surplus |
D E F |
F |
(D E) |
Tax Revenue |
None |
B D |
(B D) |
Total Surplus |
A B C D E F |
A B D F |
(C E) |
The area C E shows the fall in total surplus and is the deadweight loss of the tax.
Table 8-1 |
|
CHANGES IN WELFARE FROM A TAX. This table refers to the areas marked in Figure 8-3 to |
|
show how a tax affects the welfare of buyers and sellers in a market. |
|
|
|
|
|
|
|
TLFeBOOK

|
Application: The Costs of Taxation |
159 |
|
|
CHAPTER 8 APPLICATION: THE COSTS OF TAXATION |
165 |
|
Welfare with a Tax |
Now consider welfare after the tax is enacted. The price |
|
|
paid by buyers rises from P1 to PB, so consumer surplus now equals only area A (the |
|
|
|
area below the demand curve and above the buyer’s price). The price received by |
|
|
|
sellers falls from P1 to PS, so producer surplus now equals only area F (the area above |
|
|
|
the supply curve and below the seller’s price). The quantity sold falls from Q1 to Q2, |
|
|
|
and the government collects tax revenue equal to the area B D. |
|
|
|
To compute total surplus with the tax, we add consumer surplus, producer |
|
|
|
surplus, and tax revenue. Thus, we find that total surplus is area A B D F. |
|
|
|
The second column of Table 8-1 provides a summary. |
|
|
|
Changes in Welfar e |
We can now see the effects of the tax by comparing |
|
|
welfare before and after the tax is enacted. The third column in Table 8-1 shows the |
|
|
|
changes. The tax causes consumer surplus to fall by the area B C and producer |
|
|
|
surplus to fall by the area D E. Tax revenue rises by the area B D. Not surpris- |
|
|
|
ingly, the tax makes buyers and sellers worse off and the government better off. |
|
|
|
The change in total welfare includes the change in consumer surplus (which |
|
|
|
is negative), the change in producer surplus (which is also negative), and the |
|
|
|
change in tax revenue (which is positive). When we add these three pieces to- |
|
|
|
gether, we find that total surplus in the market falls by the area C E. Thus, the |
|
|
|
losses to buyers and sellers from a tax exceed the revenue raised by the government. The |
|
|
|
fall in total surplus that results when a tax (or some other policy) distorts a mar- |
|
|
|
ket outcome is called the deadweight loss. The area C E measures the size of |
deadweight loss |
|
|
the deadweight loss. |
|
the fall in total surplus that results |
|
To understand why taxes impose deadweight losses, recall one of the Ten Prin- |
from a market distortion, such as |
||
ciples of Economics in Chapter 1: People respond to incentives. In Chapter 7 we saw |
a tax |
|
|
that markets normally allocate scarce resources efficiently. That is, the equilibrium |
|
|
|
of supply and demand maximizes the total surplus of buyers and sellers in a mar- |
|
|
|
ket. When a tax raises the price to buyers and lowers the price to sellers, however, |
|
|
|
it gives buyers an incentive to consume less and sellers an incentive to produce |
|
|
|
less than they otherwise would. As buyers and sellers respond to these incentives, |
|
|
|
the size of the market shrinks below its optimum. Thus, because taxes distort in- |
|
|
|
centives, they cause markets to allocate resources inefficiently. |
|
|
|
DEADWEIGHT LOSSES AND THE GAINS FROM TRADE
To gain some intuition for why taxes result in deadweight losses, consider an example. Imagine that Joe cleans Jane’s house each week for $100. The opportunity cost of Joe’s time is $80, and the value of a clean house to Jane is $120. Thus, Joe and Jane each receive a $20 benefit from their deal. The total surplus of $40 measures the gains from trade in this particular transaction.
Now suppose that the government levies a $50 tax on the providers of cleaning services. There is now no price that Jane can pay Joe that will leave both of them better off after paying the tax. The most Jane would be willing to pay is $120, but then Joe would be left with only $70 after paying the tax, which is less than his $80 opportunity cost. Conversely, for Joe to receive his opportunity cost of $80, Jane would need to pay $130, which is above the $120 value she places on a clean house. As a result, Jane and Joe cancel their arrangement. Joe goes without the income, and Jane lives in a dirtier house.
The tax has made Joe and Jane worse off by a total of $40, because they have lost this amount of surplus. At the same time, the government collects no revenue from Joe and Jane because they decide to cancel their arrangement. The $40 is pure
TLFeBOOK