

Firth D.R.Balanced constant current excitation for dynamic strain measurements
.pdfBalanced Constant Current Excitation for
Dynamic Strain Measurements
Douglas R. Firth
Alan R. Szary
Precision Filters, Inc.
Ithaca, New York
(607) 277-3550
Balanced constant current excitation uses a pair of matched constant current sources to excite a single active strain gage. The technique provides enhanced immunity from electrostatic noise pickup and may be employed for dynamic strain measurement applications that require only two wires to the transducer. In this paper, the properties of balanced constant current excitation will be examined and compared against traditional techniques using the Wheatstone bridge or single-ended constant current excitation. A method to verify transducer health and cabling will also presented.
INTRODUCTION
There are various cabling and hookup schemes used for strain gage measurements ranging from a simple two-wire connection, to as many as eleven wires depending on the desired AC and DC accuracy. Strain gage measurements that minimize hookup wiring are often desired on tests of rotating machinery, low mass/low inertia test models, or simply to reduce cabling cost on large channel count systems. Also, cable connections to the test article may be limited by slip ring contacts. A special class of strain gage testing is the dynamic (AC only) measurement of single active strain gages.
Electrostatic Noise Source
REXT |
CNH |
|
Exc |
|
|
||
EN |
|
|
|
|
CNL |
CNSH |
|
RG |
|
|
|
REXT |
|
Signal |
|
|
Conditioner |
|
|
|
|
Interface |
eIN |
Figure 1: Two-Wire Wheatstone Bridge Connection
The Wheatstone bridge is the most commonly used methodology for strain gage measurements. Figure 1 shows a two-wire Wheatstone bridge connection, which may be used for single-gage dynamic strain measurements. Zero errors are caused by drift of the extension wire lead resistance, REXT, however they are removed by the AC coupled differential amplifier and are not a factor in the dynamic measurement. Measurement sensitivity is defined as the

change in circuit output voltage to changes in gage resistance. Measurement sensitivity errors caused by REXT can represent a much more troublesome characteristic of the two-wire Wheatstone bridge connection. Lead resistance for commonly used hookup and extension wire can range from .006 Ω per foot for standard 18 gage wire, to as high as high as 10 Ω per foot for high temperature wire commonly used in harsh environments such as jet engine turbine testing. Let ∆E be the bridge output, per unit of excitation, for gage resistance change, ∆R. Normalized measurement sensitivity is defined as:
Normalized Measurement Sensitivity = (∂∆E/∂∆R REXT≠0)/(∂∆E/∂∆R REXT=0) |
(1) |
Figure 2 shows variations in normalized measurement sensitivity versus REXT for a 100Ω single arm Wheatstone bridge connection. Measurement sensitivity decreases as lead resistance increases. If the lead resistance is known, the decrease in measurement sensitivity may be compensated for with more amplification or via post processing. If the lead resistance is unknown or exhibits drift with temperature, it can represent significant measurement uncertainty.
The Wheatstone bridge topology has another significant disadvantage for dynamic strain measurements. As shown in Figure 1 the signal conditioner differential amplifier connection consists of one-input from the external gage and the second from an internal reference point. It is clear that electrostatic and electromagnetic noise pickup on the external extension wire will not be equivalent to that picked up on the internal reference point and thus will not be eliminated by common mode rejection (CMR) of the differential amplifier. This topology is inherently unbalanced and effectively presents a single-ended input to the external bridge corner connection, converting all noise pickup to a normal mode interference signal. In noisy environments, this pickup can dominate signal conditioner input noise and severely degrade input signal to noise ratio (SNR).
Figure 2: Normalized Measurement Sensitivity vs. REXT
A second test methodology often preferred for single gage dynamic measurements is the single-ended constant current excitation technique shown in Figure 3. Here a single-ended constant current source is used to excite the gage. Since the current through the gage is held constant, gage resistance fluctuations are converted directly to voltage fluctuations with no need for ballast or completion resistors. Gage sense lines, while useful for accurate DC measurements, are not required for dynamic measurements since voltage drops of extension wires do not effect excitation of the gage and hence AC measurement sensitivity. As shown by the dashed curve in Figure 2, measurement sensitivity is unaffected by lead wire resistance. Unlike the Wheatstone bridge circuit, constant current excitation provides inherently linear response, even for large variations in gage resistance. When only dynamic (AC)

data is required, the excitation lines themselves can be AC coupled to the differential amplifier resulting in a simple two-wire gage connection with known measurement sensitivity.
Gage power dissipation is often the main criteria for selecting excitation levels. Simple circuit analysis shows that at a given gage power dissipation, the constant current excitation technique provides twice the sensitivity to gage fluctuations compared to the Wheatstone bridge circuit. With a properly designed signal conditioner, this translates to an immediate 6 dB improvement in overall signal to noise ratio. Also, since the Wheatstone bridge excites the equivalent of four gages, system power requirements are four times that of the constant current technique.
As with the two-wire Wheatstone bridge topology, the single ended constant current circuit is also unbalanced. All noise pickup on the input is converted directly to a normal mode interference signal, which again significantly degrades SNR of the measurement.
Electrostatic Noise Source |
+V |
Constant |
|
|
Current |
||
|
|
|
|
|
CNH |
|
Supply |
REXT |
|
|
|
EN |
|
|
|
|
CNL |
CNSH |
|
RG |
|
|
|
|
|
|
VNS |
|
|
Signal |
|
REXT |
|
Conditioner |
|
|
|
Interface |
|
Figure 3: Single-Ended Constant Current Excitation Circuit
Balanced constant current excitation uses a pair of matched current sources to excite the gage and a differential amplifier to measure gage voltage as shown in Figure 4. In addition to the measurement sensitivity and linearity advantages described for single ended constant current excitation, the balanced topology provides other measurement advantages. We can see in Figure 4 that the two differential amplifier connections are balanced both physically and electrically with respect to the interfering noise source acting upon the gage and interconnecting cables. With proper attention to cabling and hookup techniques, noise pickup will be nearly equal on the two balanced inputs and therefore greatly reduced by the CMR of the differential amplifier. Other advantages of the balanced topology include improved tolerance to gage fault conditions and a zero centered compliance range which makes better use of bipolar power supplies commonly used in signal conditioner designs.
|
|
|
V+ |
|
|
|
IEXC |
Electrostatic Noise Source |
|
|
|
REXT |
CNH |
|
|
EN |
|
|
RIN |
|
CNL |
CNSH |
|
|
|
||
RG |
|
|
VNB |
|
|
|
RIN |
REXT |
|
|
|
|
|
Signal |
IEXC |
|
|
Conditioner |
|
|
|
|
|
|
|
Interface |
V- |
|
|
|
|
Figure 4: Balanced Constant Current Excitation Circuit
BALANCED CONSTANT CURRENT EXCITATION
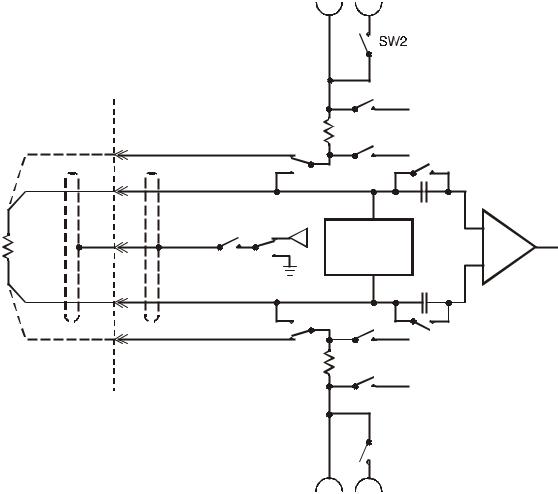
Figure 5 shows a circuit diagram of the balanced differential constant current technique implemented by Precision Filters. Two matched current sources are used in a “push pull” configuration, one sourcing current to the gage, the other pulling current from the gage. Providing the two current supplies are well matched and the floating gage is connected to the input through a twisted/shielded pair, the circuit is both physically and electrically balanced and provides excellent noise immunity. Also, since the gage DC voltage will be symmetrical about the bipolar power supply ground, the balanced topology has twice the signal compliance range of ground referred single-ended current sources. In the 4-wire mode, high impedance sense lines connect the differential amplifier directly to the gage terminals. Since no current flows in these sense lines the reading is uncorrupted by DC drops of the current carrying excitation lines. For dynamic measurements, SW1 can be placed in the two-wire mode and the input may be AC coupled, allowing only the dynamic fluctuations of the gage element to be amplified. Since the input connection is a balanced differential input, the shield of the cable may be driven (guarded) with the common mode voltage as shown in Figure 5 and the CMR of the differential amplifier will be further improved.
DC Drive 
 AC Test Current
|
I |
DRIVE |
SW1 |
RSENSE |
IDRIVE Monitor |
|
|
|
|
|
|
|
+Signal |
|
|
|
|
|
|
Open |
Guard |
Gage |
Input |
|
|
|
|
||
RGAGE |
|
|
|
Short/Open |
|
Shield |
|
Amp |
|||
|
|
Detect |
|
||
|
–Signal |
|
|
|
|
|
ISINK |
|
|
|
|
|
|
|
SW1 |
RSENSE |
ISINK Monitor |
SW2
DC Sink 
 AC Test Current
Figure 5: Balanced Constant Current Excitation Circuit Diagram
Balanced Constant Current Excitation Properties
The balanced topology offers three principal advantages when compared to single-ended constant current excitation: 1) Significantly less susceptibility to electrostatic and electromagnetic noise sources, 2) immunity to certain gage fault conditions and 3) wider current source compliance.
Noise susceptibility is significantly reduced since the input cabling is balanced with respect to electrostatic pickup. Noise pickup in the extension wires appears as common mode signal and thus will be rejected by the CMR of the differential amplifier. A simple electrostatic noise-coupling model is included in Figure 4. Here, a twisted/shielded pair cable is run between the amplifier and the active gage. A single, unshielded conductor carrying unwanted noise, EN, is run in parallel with the twisted/shielded pair. Coupling from the noise carrying cable to the signal cable will primarily occur when the center conductors extend beyond the protective shield. Let RG be the gage resistance and RIN be the input impedance of the signal conditioner. Assume the electrostatic noise source EN is coupled to the input pairs by stray coupling capacitance CNH and CNL. Also, assume RIN >> RG, and the impedance of RG is much less than CNH or CNL. The noise pickup, VNB versus frequency f (in hertz) for the balanced current input is given by:
VNB = πfRG|CNH-CNL|EN |
(2) |
For single-ended constant current excitation, the noise pickup, VNS is given by:
VNS = 2πfRGCNHEN |
(3) |
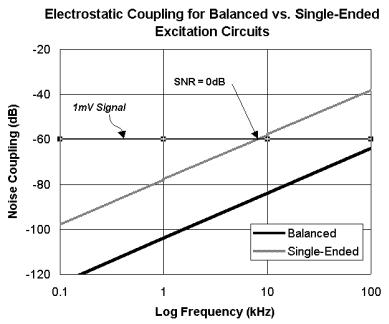
Figure 6: Electrostatic Noise Coupling for Balanced vs. Single-Ended Excitation
Figure 6 shows a plot of VNB and VNS versus frequency for RG = 1000Ω, CNH = 22pF and CNL = 20pF. Electrostatic coupling increases by 20 dB per decade with increasing frequency. The balanced topology results in 26 dB less noise pickup than the single-ended topology. Reduction of noise pickup for the balanced topology compared to the single ended topology is primarily dependent on the match of stray coupling capacitors, CNH and CNL as shown in equation (1). It should be noted that noise-coupling capacitor, CNSH will couple noise to the shield depending on the effectiveness of the shield termination. This noise can be significant in harsh environments with longer cable runs or with improperly terminated shields. Noise coupling from the shield to the center conductors could be significant since this coupling capacitance is approximately 40pF per foot. Here again, the CMR of the balanced topology will act to reduce this noise.
Noise Coupling Test Results of Balanced Constant Current Excitation
To test the electrostatic coupling model, a 10-foot twisted pair wire was used to connect to a remote 1kΩ gage. The extension cable was run in a conduit along side an unshielded 2-conductor cable (hostile cable). Test signals were applied to the hostile cable to characterize coupling level versus frequency. As shown on the plots in Figure 7, the single-ended connection (Wheatstone bridge or constant current) resulted in coupling curves increasing by 6 dB per octave. Results are consistent with a coupling capacitance of approximately 5pF per foot. We see a 6 dB improvement in coupling level for the Wheatstone bridge circuit since the impedance of the circuit is 500Ω rather than 1kΩ. The balanced constant current connection reduced the effective coupling by approximately 40 dB at all test frequencies. This is consistent with a coupling capacitance match of approximately 1%. While the quantitative value of these results may not be directly transferable to a specific test setup or environmental conditions they do serve to validate the electrostatic coupling model and allow us to make some predictions of expected coupling resulting from several common test practices. Table 1 lists approximate per unit capacitances that may be used for estimates of coupling capacitance.
Condition |
Capacitance |
Conductor to conductor in a 22 |
40pF/ft |
AWG bundle |
|
Two-conductor shielded cable, |
65pF/ft |
conductor to shield |
|
Pin to pin capacitance on Amphenol |
2pF |
Connector |
|
0.5 Watt resistor, end to end |
1.2pF |
Center wire to shield, RG-58 |
33pF/ft |
Table 1: Typical Capacitances
(From Ralph Morrison, Grounding and Shielding Techniques in Instrumentation, New York: Wiley, 1967, page 34.)
In a second experiment, a twisted/shielded gage extension wire is routed in the rear of a typical electronic rack enclosure in close proximity to a 19-inch SVGA computer monitor. Channel gain on the gage conditioner was set to 1000 to amplify a 1mV-gage signal. The plot of Figure 8 clearly shows the noise coupling caused by the horizontal scan rate of the computer monitor for the single-ended and balanced constant current excitation circuit. We can see from this plot that the balanced circuit was extremely effective, reducing the noise coupling by 34 dB.
A typical failure mode for dynamic strain measurements involves shorting one end of a fatigued or damaged gage to the test model. When this occurs, data for the channel is typically lost and data for other channels may be corrupted by the newly created ground loop. The differential constant current topology assures a return current from the gage exactly equal to the current sourced to the gage, eliminating any possibility of current flow to the test model even if one end of the gage is shorted directly to the model. The bias point of the gage will shift to that of a single ended connection and the input lines will no longer be balanced but the gage will continue to operate with proper excitation and proper measurement sensitivity
Another advantageous property of balanced constant current is increased compliance levels due to the bipolar, zero centered gage voltage. Assuming proper attention to gage self-heating and power dissipation issues, increasing gage excitation is the optimal method of improving overall measurement sensitivity. Increasing excitation however translates to increasing current source compliance requirements. Compliance levels are typically limited by the unipolar nature of single ended current supplies, (typically 8 to 10 Volts). Bipolar current excitation allows signals to swing toward both supply rails essentially doubling the compliance range. With +/-15V supply rails, the balanced topology can be designed to deliver 25mA of excitation current to a floating 1kΩ gage.

Figure 7: Noise Coupling Test for 10’ Cable
Single-Ended
Balanced
Figure 8: Noise Coupling Test with Computer Monitor

VERIFICATION OF TRANSDUCER HEALTH AND CABLING
As time in test cells becomes more expensive and test results more critical, modern day test protocols often include significant pre-test setup and equipment verification steps. An effective dynamic strain pre-test validation would consist of: gage resistance check, excitation level check, cable and connector integrity check and measurement system gain and frequency response check. These tests can be automated by proper design of the signal conditioning front end. As shown in Figure 5, an AC test current can be summed with the DC excitation current (SW2) allowing for in situ dynamic validation of the cable resistance, gage resistance and connector integrity, even with the input AC coupled. If the AC test current is programmable in level and frequency, then system gain and frequency response may be verified. Also, the AC current may be generated from an arbitrary waveform generator reference so that system response to complex waveforms similar to those encountered during an actual test may be evaluated. From the point of view of the measurement system, it is not possible to distinguish whether the signal is generated from a stimulated transducer or the injected AC test current. Accurate low drift sense resistors in series with excitation current lines provide a means for measuring actual excitation current delivered to the gage. Excitation current is sensed independently on source and sink lines to reveal leakage conditions produced by excitation current flow to the test model. Gage fault detectors provide continuous monitoring of open or short conditions and alert the user or controlling software.
Figure 9: Precision Filters, Inc. Signal Conditioner with Balanced Constant Current Excitation
SUMMARY
Balanced constant current excitation provides an accurate means of measuring dynamic strain with a single active strain gage using only a two-wire connection. Electrostatic pickup will be reduced when compared to single-ended constant current excitation or a quarter bridge configuration with remote completion resistors. The balanced current excitation circuit proposed operates properly even under the certain common gage fault conditions such as a direct short of the gage to the test model. The balanced constant current excitation circuit provides a wider current source compliance range than single-ended counterparts. Finally, a technique for verification of the transducer, cabling and system frequency response by injection of an AC test current into the current loop was described. This AC excitation could represent simulation of expected signal energy to evaluate system response to complex waveforms. Figure 9 shows an implementation of a signal conditioner having balanced constant current excitation. Developed by Precision Filters, Inc., the conditioner provides four channels of programmable excitation, amplification and antialiasing filters. The design embodies all of the balanced constant current excitation features and concepts discussed in this paper.
ACKNOWLEDGEMENTS
The authors wish to thank Bob Mahrenholz of Sverdrup at the Arnold Engineering Development Center, Tullahoma, Tennessee for introducing the concept of balanced constant current conditioning. They would also like to acknowledge Don Chandler and Paul Costantini for their contributions to the concepts introduced here. Finally, we wish to thank Don Hall at Precision Filters for help with proof reading and production of this paper.
REFERENCES
Dally, James W. and Riley, William F., 1978, Experimental Stress Analysis, New York: McGraw-Hill
Morrison, Ralph, 1967, Grounding and Shielding Techniques in Instrumentation, New York: John Wiley & Sons
Ott, Henry W., 1988, Noise Reduction Techniques in Electronic Systems, New York: John Wiley & Sons
Rich, Alan, “Shielding and Guarding”, Analog Devices Inc., Analog Dialogue 17-1, 1983
Rich, Alan, “Understanding Interference Type Noise”, Analog Devices Inc., Analog Dialogue 16-3, 1982
Wright, Charles, 1995, Applied Measurement Engineering, New Jersey: Prentice Hall