

Physical layer specification.V1
.4.PDFIrDA Serial Infrared Physical Layer Specification, Version 1.4, February 6, 2001
5.5.3.3. START (STA) FLAG DEFINITION:
The transmitted START (STA) delimiter is the 48-chip (2 μs) chip sequence
STA = ’100’101’010’100’100’010’000’001’001’010’101’001’000’001’010’000’.
The left-most/right-most chip of STA is transmitted first/last and a ’1’ in STA means an active chip (pulse) and a ’0’ means an empty chip (no pulse).
The Start Flag Delimiter allows for packet synchronization. A delimiter detection circuit should declare a flag as having been found when there is a perfect match between the receiver chip stream and a particular delimiter. The Start and Stop delimiters contain a subsequence ‘1001010101001’ that violates the HHH (1,13) code. This subsequence occurs twice in the Start Flag delimiter and never occurs within the main HHH code.
5.5.3.4 IrLAP Frame:
The structure remains unchanged from that defined in the IrLAP Specification, Version 1.1. The content of the IrLAP frame is first scrambled with the scheme recommended in Section 5.5.4. and then encoded with HHH(1,13) as described in Section 5.5.2. Note that the 32 CRC bits for the IrLAP frame are calculated before the IrLAP frame is scrambled. For reference, the IrLAP frame has the following structure:
| Address (8 bits) | Control (8 bits) | Information (M times 8 bits) |
5.5.3.5. CRC:
Computation remains unchanged from the 32-bit CRC defined for the 4 Mbit/s data rate. Please refer Section 5.4.2.5 for this CRC function. The content of the CRC field is first scrambled with the scheme recommended in Section 5.5.4 and then encoded with HHH(1, 13) as described in Section 5.5.2. Note that the 32 CRC bits for the IrLAP frame are calculated before the IrLAP frame is scrambled. The transmitted CRC field is a 48-chip (2 μs) sequence.
5.5.3.6. FLUSH BYTE (FB):
The Flush Byte (FB) is the 8-bit sequence
FB = ’00’00’00’00’.
These 8 bits are not scrambled but directly sent to the HHH(1, 13) encoder. The transmitted FB field is a 12-chip (0.5 μs) sequence. Note that the FB field is required to enable complete decoding of the CRC field. The flush byte denotes the end of the main body. Since the flush byte is not scrambled, a well balanced HHH(1,13) sequence precedes the STOP delimiter.
5.5.3.7. STOP (STO):
The transmitted STOP (STO) delimiter is the 48-chip (2 μs) sequence
STO = ’001’001’010’101’001’000’100’000’100’101’010’100’100’000’100’000’.
The left-most/right-most chip of STO is transmitted first/last and a ’1’ in STO means an active chip (pulse) and a ’0’ means an empty chip (no pulse). As in the Start Flag delimiter, the Stop flag also contains a subsequence ‘1001010101001’ that violates the HHH (1,13) code. This subsequence also occurs twice in the Stop Flag delimiter.
5.5.3.8. NULL sequence:
The transmitted NULL sequence is the 24-chip (1 μs) sequence
NULL = ’000’000’000’000’000’000’000’000’.
The NULL field is a new field for the purpose of providing an HHH(1, 13) code pattern violation that permits terminating reception of the packet in the event that the STO field is not recognized. The left-most/right-most chip in NULL is transmitted first/last and all chips of NULL are empty chips (no pulses).
23
IrDA Serial Infrared Physical Layer Specification, Version 1.4, February 6, 2001
The NULL field increases the probability that the packet is terminated close to the STOP flag. The NULL field also reduces the probability that two back to back packets are interpreted as a single packet, should the STOP flag delimiter of the first packet be missed.
5.5.4 Scrambling and Descrambling Functions
It is advantageous to enhance the encoder/decoder system with simple scrambler/descrambler functions. The primitive polynomial
x 8 Å x 4 Å x 3 Å x 2 Å 1 ,
where Å indicates a modulo-2 addition or, equivalently, a logic exclusive OR (XOR) operation, is proposed for implementing these functions. The operations of the proposed scrambling and descrambling functions are performed according to the principles of frame synchronized scrambling/descrambling (FSS) mechanisms. Note that FSS does not introduce memory into the signal path, i.e., FSS does not increase the encoding/decoding delay and it does not aggravate error propagation in the decoded data stream. The hardware used for scrambling during transmission can mostly be reused during the descrambling process in reception mode.
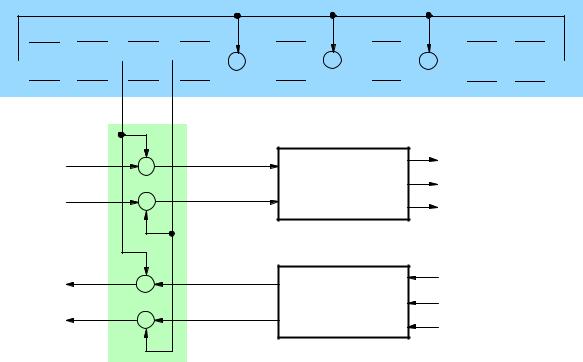
The reference hardware implementation of the proposed scrambling/descrambing scheme is shown in the following figure. The linear feedback shift register (LFSR) produces a maximum-length pseudo-random sequence with period 255. It is important to note that the proposed scrambling/descrambling functions are implemented with an LFSR where the feedback taps are configured according to the so-called one-to-many implementation; for reasons of compatibility, implementations should adhere to this type of LFSR. Furthermore, it is assumed that the output of register cell x6 shown in the figure is defined to be the equivalent serial output of the LFSR.
The modulo-2 adders shown in the figure correspond to logic XOR (exclusive OR) gates. During transmission, each new pair of source bits (d1', d2') is XOR-ed with a new pair of scrambling bits (s1, s2) to produce the scrambled data bit pair (d1, d2) entering the encoder. Similarly, during reception, each new pair of decoded bits (u1, u2) is XOR-ed with a new pair of descrambling bits (s1, s2) to produce the descrambled user bit pair (u1', u2') that is sent to the data sink. A scrambling/descrambling cycle has duration 3T seconds where T = 41.7 ns is the chip period.
5.5.4.1 Effects and Limits of Scrambling/Descrambling:
By enhancing the system with scrambling/descrambling functions during data transmission/reception, one achieves generally better duty cycle statistics in the HHH(1, 13) coded channel chip stream; the resulting duty cycle converges towards the average duty cycle of the code (≈26%) for typical payload data. It is important to note that scrambling cannot entirely eliminate possible worst-case duty cycle patterns in the transmitted signal stream that can result from certain specific input data sequences. However, scrambling can greatly reduce the probability of occurrence of such worst-case patterns.
5.5.4.2 Scrambler/ Descrambler Initialization:
Transmit mode: The scrambler’s LFSR is initialized with the all-1 state, that is (x8, x7, x6, x5, x4, x3, x2, x1) = (1, 1, 1, 1, 1, 1, 1, 1), such that (s1, s2) = (x6, x5) = (1, 1) at the arrival of the first pair of source bits (d1', d2'), ready to be scrambled. Note that the LFSR must be advanced twice per scrambling cycle to produce a new pair of scrambling bits (s1, s2) for each new pair of data bits (d1', d2').
Receive mode: The descrambler’s LFSR is initialized with the all-1 state, that is (x8, x7, x6, x5, x4, x3, x2, x1) = (1, 1, 1, 1, 1, 1, 1, 1), such that (s1, s2) = (x6, x5) = (1, 1) when the decoder produces the first pair of decoded bits (u1, u2), ready to be descrambled. Note that the LFSR must be advanced twice per descrambling cycle to produce a new pair of descrambling bits (s1, s2) for each new pair of decoded data bits (u1, u2).
24
IrDA Serial Infrared Physical Layer Specification, Draft Version 1.4, February 6, 2001
 x8
x8 
 x7
x7 

 x6
x6 

 x5
x5  +
+
 x4
x4  +
+
 x3
x3  +
+ 
 x2
x2 
 x1
x1 
s1 |
s2 |
|
|
|
|
|
d1' |
+ |
d1 |
|
Y1 |
|
|
from |
|
HHH(1,13) |
Y2 |
|
||
sourceDATA d2' |
d2 |
to Transmitter |
||||
|
ENCODER |
|||||
+ |
|
|||||
|
|
|
Y3 |
|
to |
u1' |
+ |
u1 |
HHH(1,13) |
r1 |
|
|
DATA |
u2' |
u2 |
r2 |
from Receiver |
|||
|
DECODER |
||||||
sink |
+ |
r3 |
|
||||
|
|
|
|
|
Fig 14. Reference Hardware to implement the scrambling/descrambling functions. The LFSR is implemented in the one-to-many form.
5.5.5 – State Table of Scrambler/Descrambler Reference Hardware
Table B1 represents the complete state table of the scrambler/descrambler hardware shown in Fig. B1 where we have defined that a new state is reached after the LFSR has been clocked twice. The LFSR’s state is represented by its contents, i.e., (x8, x7, x6, x5, x4, x3, x2, x1), xi c [0, 1], ¼i. The table lists also the scrambling/descrambling bit pairs (s1, s2) = (x6, x5) that are valid in each state. The state sequence {(x8, x7, x6, x5, x4, x3, x2, x1)} and thus the sequence of scrambling/descrambling bit pairs {(s1, s2)} have period 255, i.e., they both repeat after 255 scrambling/descrambling cycles. The all-0 state (x8, x7, x6, x5, x4, x3, x2, x1) = (0, 0, 0, 0, 0, 0, 0, 0) does not occur (it is not allowed at any time). The table also indicates that the equivalent serial sequence formed from the pair sequence {(s1, s2)} consists of two periods of the maximum-length pseudo-random sequence (MLPRS) of length 255 bits, as determined by the scrambling/descrambling polynomial shown above.
5.5.5.1 Example of Scrambled/Descrambled Data Sequences:
The scrambled sequence, {(d1, d2)}, in this example corresponds to Example 1 in Section A5 of Appendix A.
Payload sequence: |
{(d1’, d2’)} |
= |
(0, 0) (0, 1) (0, 0) (1, 1) (1, 1) (1, 1) (0, 1) (0, 1) |
Scrambling sequence: |
{(s1, s2)} |
= |
(1, 1) (0, 1) (0, 0) (1, 1) (0, 0) (1, 1) (0, 1) (0, 1) |
Scrambled sequence: |
{(d1, d2)} |
= |
(1, 1) (0, 0) (0, 0) (0, 0) (1, 1) (0, 0) (0, 0) (0, 0) |
Decoded scrambled sequence: |
{(u1, u2)} |
= |
(1, 1) (0, 0) (0, 0) (0, 0) (1, 1) (0, 0) (0, 0) (0, 0) |
Descrambling sequence: |
{(s1, s2)} |
= |
(1, 1) (0, 1) (0, 0) (1, 1) (0, 0) (1, 1) (0, 1) (0, 1) |
Descrambled payload sequence:{(u1’, u2’)} |
= |
(0, 0) (0, 1) (0, 0) (1, 1) (1, 1) (1, 1) (0, 1) (0, 1) |
|
Legend:
a |
= count index for scrambling/descrambling cycle |
bcdefghi |
= x8, x7, x6, x5, x4, x3, x2, x1 (LFSR contents = state) |
jk |
= s1, s2 (pair of scrambling/descrambling bits) |
25

IrDA Serial Infrared Physical Layer Specification, Version 1.4, February 6, 2001
*) First cycle of the first scrambling/descrambling period (a = 1)
|
|
First bit of first serial MLPRS (a =1: j = s1 = x6) |
||
|
↓ |
|
|
|
|
|
Second bit of first serial MLPRS (a = 1: k = s2 = x5) |
||
|
↓ |
|
|
|
|
a bcdefghi jk |
a bcdefghi jk |
a bcdefghi jk |
a bcdefghi jk |
*) 1 11111111 11 |
65 01000110 00 |
129 11100011 10 |
193 10001100 00 |
|
2 11011011 01 |
66 00000101 00 |
130 10101011 10 |
194 00001010 00 |
|
3 01001011 00 |
67 00010100 01 |
131 10010110 01 |
195 00101000 10 |
|
4 00110001 11 |
68 01010000 01 |
132 01100010 10 |
196 10100000 10 |
|
5 11000100 00 |
69 01011101 01 |
133 10010101 01 |
197 10111010 11 |
|
6 00110111 11 |
70 01101001 10 |
134 01101110 10 |
198 11010010 01 |
|
7 11011100 01 |
71 10111001 11 |
135 10100101 10 |
199 01101111 10 |
|
8 01010111 01 |
72 11011110 01 |
136 10101110 10 |
200 10100001 10 |
|
9 01000001 00 |
73 01011111 01 |
137 10000010 00 |
201 10111110 11 |
|
10 00011001 01 |
74 01100001 10 |
138 00110010 11 |
202 11000010 00 |
|
11 01100100 10 |
75 10011001 01 |
139 11001000 00 |
203 00101111 10 |
|
12 10001101 00 |
76 01011110 01 |
140 00000111 00 |
204 10111100 11 |
|
13 00001110 00 |
77 01100101 10 |
141 00011100 01 |
205 11001010 00 |
|
14 00111000 11 |
78 10001001 00 |
142 01110000 11 |
206 00001111 00 |
|
15 11100000 10 |
79 00011110 01 |
143 11011101 01 |
207 00111100 11 |
|
16 10100111 10 |
80 01111000 11 |
144 01010011 01 |
208 11110000 11 |
|
17 10100110 10 |
81 11111101 11 |
145 01010001 01 |
209 11100111 10 |
|
18 10100010 10 |
82 11010011 01 |
146 01011001 01 |
210 10111011 11 |
|
19 10110010 11 |
83 01101011 10 |
147 01111001 11 |
211 11010110 01 |
|
20 11110010 11 |
84 10110001 11 |
148 11111001 11 |
212 01111111 11 |
|
21 11101111 10 |
85 11111110 11 |
149 11000011 00 |
213 11100001 10 |
|
22 10011011 01 |
86 11011111 01 |
150 00101011 10 |
214 10100011 10 |
|
23 01010110 01 |
87 01011011 01 |
151 10101100 10 |
215 10110110 11 |
|
24 01000101 00 |
88 01110001 11 |
152 10001010 00 |
216 11100010 10 |
|
25 00001001 00 |
89 11011001 01 |
153 00010010 01 |
217 10101111 10 |
|
26 00100100 10 |
90 01000011 00 |
154 01001000 00 |
218 10000110 00 |
|
27 10010000 01 |
91 00010001 01 |
155 00111101 11 |
219 00100010 10 |
|
28 01111010 11 |
92 01000100 00 |
156 11110100 11 |
220 10001000 00 |
|
29 11110101 11 |
93 00001101 00 |
157 11110111 11 |
221 00011010 01 |
|
30 11110011 11 |
94 00110100 11 |
158 11111011 11 |
222 01101000 10 |
|
31 11101011 10 |
95 11010000 01 |
159 11001011 00 |
223 10111101 11 |
|
32 10001011 00 |
96 01100111 10 |
160 00001011 00 |
224 11001110 00 |
|
33 00010110 01 |
97 10000001 00 |
161 00101100 10 |
225 00011111 01 |
|
34 01011000 01 |
98 00111110 11 |
162 10110000 11 |
226 01111100 11 |
|
35 01111101 11 |
99 11111000 11 |
163 11111010 11 |
227 11101101 10 |
|
36 11101001 10 |
100 11000111 00 |
164 11001111 00 |
228 10010011 01 |
|
37 10000011 00 |
101 00111011 11 |
165 00011011 01 |
229 01110110 11 |
|
38 00110110 11 |
102 11101100 10 |
166 01101100 10 |
230 11000101 00 |
|
39 11011000 01 |
103 10010111 01 |
167 10101101 10 |
231 00110011 11 |
|
40 01000111 00 |
104 01100110 10 |
168 10001110 00 |
232 11001100 00 |
|
|
41 (next page) |
105 (next page) |
169 (next page) |
233 (next page) |
26

IrDA Serial Infrared Physical Layer Specification, Version 1.4, February 6, 2001
(continued from previous page) |
|
|
|
||
|
a bcdefghi jk |
a bcdefghi jk |
a bcdefghi jk |
a bcdefghi jk |
|
41 00000001 00 |
105 10000101 00 |
169 00000010 00 |
233 00010111 01 |
|
|
42 00000100 00 |
106 00101110 10 |
170 00001000 00 |
234 01011100 01 |
|
|
43 00010000 01 |
107 10111000 11 |
171 00100000 10 |
235 01101101 10 |
|
|
44 01000000 00 |
108 11011010 01 |
172 10000000 00 |
236 10101001 10 |
|
|
45 00011101 01 |
109 01001111 00 |
173 00111010 11 |
237 10011110 01 |
|
|
46 01110100 11 |
110 00100001 10 |
174 11101000 10 |
238 01000010 00 |
|
|
47 11001101 00 |
111 10000100 00 |
175 10000111 00 |
239 00010101 01 |
|
|
48 00010011 01 |
112 00101010 10 |
176 00100110 10 |
240 01010100 01 |
|
|
49 01001100 00 |
113 10101000 10 |
177 10011000 01 |
241 01001101 00 |
|
|
50 00101101 10 |
114 10011010 01 |
178 01011010 01 |
242 00101001 10 |
|
|
51 10110100 11 |
115 01010010 01 |
179 01110101 11 |
243 10100100 10 |
|
|
52 11101010 10 |
116 01010101 01 |
180 11001001 00 |
244 10101010 10 |
|
|
53 10001111 00 |
117 01001001 00 |
181 00000011 00 |
245 10010010 01 |
|
|
54 00000110 00 |
118 00111001 11 |
182 00001100 00 |
246 01110010 11 |
|
|
55 00011000 01 |
119 11100100 10 |
183 00110000 11 |
247 11010101 01 |
|
|
56 01100000 10 |
120 10110111 11 |
184 11000000 00 |
248 01110011 11 |
|
|
57 10011101 01 |
121 11100110 10 |
185 00100111 10 |
249 11010001 01 |
|
|
58 01001110 00 |
122 10111111 11 |
186 10011100 01 |
250 01100011 10 |
|
|
59 00100101 10 |
123 11000110 00 |
187 01001010 00 |
251 10010001 01 |
|
|
60 10010100 01 |
124 00111111 11 |
188 00110101 11 |
252 01111110 11 |
|
|
61 01101010 10 |
125 11111100 11 |
189 11010100 01 |
253 11100101 10 |
|
|
62 10110101 11 |
126 11010111 01 |
190 01110111 11 |
254 10110011 11 |
|
|
63 11101110 10 |
127 01111011 11 |
191 11000001 00 |
255 11110110 11 |
^) |
|
64 10011111 01 |
128 11110001 11 |
192 00100011 10 |
[256 11111111 11] ”) |
||
−
First bit of second serial MLPRS (a = 128: k = s2 = x5)
−
Last (255th) bit of first serial MLPRS (a = 128: j = s1 = x6)
^) End of the first scrambling/descrambling period (a = 255)
”) Start of the second scrambling/descrambling period (a = 256 ≡ 1)
Table 17: The complete state table of the scrambler/descrambler reference hardware shown in Fig.14.
5.5.5 Aborted Packets
Receivers may only accept packets that have valid STA, IrLAP frame, CRC, and STO fields as defined in the Packet Format section. The PA field need not be valid in the received packet. All other packets are aborted and ignored.
5.5.6 Back to Back Packet Transmission
Back to back, or "brick-walled" packets are allowed, but each packet must be complete (i.e., containing PA, STA, IrLAP Frame, CRC and STO fields).
27
IrDA Serial Infrared Physical Layer Specification, Version 1.4, February 6, 2001
Appendix A. Test Methods
Note- A.1 is Normative unless otherwise noted. The rest of Appendix A and all of Appendix B are Informative, not Normative {i.e., it does not contain requirements, but is for information only}. Examples of measurement test circuits and calibration are provided in IrDA Serial Infrared Physical Layer Measurement Guidelines.
A.1. Background Light and Electromagnetic Field
There are four ambient interference conditions in which the receiver is to operate correctly. The conditions are to be applied separately.
1. Electromagnetic field: 3 V/m maximum
Refer to IEC 61000-4-3 test level 2 for details.
(For devices that intend to connect with or operate in the vicinity of a mobile phone or pager, a field of 30 V/m with frequency ranges from 800 Mhz to 960 Mhz and 1.4 GHz to 2.0 GHz including 80% amplitude modulation with a 1 kHz sine wave is recommended. Refer to IEC 61000-4-3 test level 4 for details. The 30 V/m condition is a recommendation; 3 V/m is the normative condition.)
2. Sunlight: 10 kilolux maximum at the optical port
This is simulated with an IR source having a peak wavelength within the range 850 nm to 900 nm and a spectral width less than 50 nm biased to provide 490 μW/cm^2 (with no modulation) at the optical port. The light source faces the optical port.
This simulates sunlight within the IrDA spectral range. The effect of longer wavelength radiation is covered by the incandescent condition.
3. Incandescent Lighting: 1000 lux maximum
This is produced with general service, tungsten-filament, gas-filled, inside-frosted lamps in the 60 Watt to 150 Watt range to generate 1000 lux over the horizontal surface on which the equipment under test rests. The light sources are above the test area. The source is expected to have a filament temperature in the 2700 to 3050 degrees Kelvin range and a spectral peak in the 850 nm to 1050 nm range.
4. Fluorescent Lighting : 1000 lux maximum
This is simulated with an IR source having a peak wavelength within the range 850 nm to 900 nm and a spectral width of less than 50 nm biased and modulated to provide an optical square wave signal (0 μW/cm^2 minimum and 0.3 μW/cm^2 peak amplitude with 10% to 90% rise and fall times less than or equal to 100 ns) over the horizontal surface on which the equipment under test rests. The light sources are above the test area. The frequency of the optical signal is swept over the frequency range from 20 kHz to 200 kHz.
Due to the variety of fluorescent lamps and the range of IR emissions, this condition is not expected to cover all circumstances. It will provide a common floor for IrDA operation.
A.2. Active Output Specifications A.2.1. Peak Wavelength
The peak wavelength (Peak Wavelength, Up, um) is the wavelength of peak intensity and can be measured using an optical spectrum analyzer. The pulse shape and sequence can be the same as that used for the power measurements below and the measurement can be made on the optical axis.
A.2.2. Intensity and Angle
The following three specifications form a set that can be measured concurrently:
-Maximum Intensity In Angular Range, mW/sr
-Minimum Intensity In Angular Range, mW/sr
-Half-Angle, degrees
28

IrDA Serial Infrared Physical Layer Specification, Version 1.4, February 6, 2001
This intensity measurement requires means to measure optical power as well as the distance and angle from a reference point. Power measured in milliwatts (mW) or microwatts (μW) is converted to intensity in mW/sr (or μW/sr) or irradiance in mW/cm^2 (or μW/cm^2). In addition, if there are any cosmetic windows or filters that are part of the interface, they must be in place for all intensity and spatial distribution optical measurements
The primary reference point is the center point of the surface of the IrDA optical port and the port's optical axis is the line through the reference point and normal to the port surface. Link specifications are based on the assumption that the maximum intensity at the port surface is 500 mW/cm^2 due to a point source of 500 mW/sr maximum intensity placed one centimeter behind the reference surface. Distance is measured radially from the reference point to the test head. Half-Angle is the angular deviation from the optical axis as shown in Figure 4. The plane of the detector at the Test Head is normal to the radial vector from the center of the optical port to the detector.
Test Head
|
|
|
|
Half Angle |
||
Optical Port Centerline |
|
|||||
|
||||||
|
|
Optical Axis |
||||
|
|
|
|
|
|
|
|
|
|
|
|
|
|
The Optical Reference Surface |
Optical Port |
|||||
is the Node's External Surface |
||||||
|
|
|||||
containing the Port |
|
|
|
|||
|
|
|
||||
|
|
|
|
|
|
|
Figure 4. Optical Port Angle Measurement Geometry
The IrDA link specification is based on peak optical power levels. Power measurement can be made on a single pulse or by averaging a sequence of pulses and converting to peak levels. Averaging methods require knowledge of the pulse sequence and/or duty factor in order to calculate the peak power from the reported average. In addition, for short pulse durations, attention must be paid to the effect of the rise and fall times of the optical signal on the effective optical pulse duration.
The test head is to be calibrated to provide accurate results for signals within the appropriate ranges of wavelength, pulse and pulse sequence characteristics. The size of the photodetector in the test head must be known in order to translate the results from power (mW or μW) to irradiance (mW/cm^2 or μW/cm^2) and intensity (mW/sr or μW/sr). Finally, the test head should be aimed directly at the reference point, i.e., the test detector should be normal to the vector from the center of the optical port to the center of the test detector.
The power measurement should be made at a distance large enough to avoid near field optical effects but close enough to receive a robust signal. To test for an appropriate distance, make power measurements at half and double the chosen distance and check that the results are consistent with an inverse square relationship.
Resolution of spatial intensity variation should be as fine as the smallest detector. Unfortunately, because the detected signal intensity is averaged over the size of the test head, resolution becomes a tradeoff with signal strength. However, there is no size constraint in the Active Input Interface specification for the detector in the IrDA receiver. It is impractical to test with an infinitesimal detector. A suggested test setup employs a 1 cm^2 area photodiode at a distance of 30 cm from the emitter. For a circular photodiode, the
29

IrDA Serial Infrared Physical Layer Specification, Version 1.4, February 6, 2001
diameter is 1.13 mm, which subtends an angle of 1.08°, or 0.00111 steradians. Any measurement setup should have at least this angular resolution.
Figure 5 contains a graphical representation of the serial infrared Active Output Interface specifications. The measured intensity must be less than or equal to "Maximum Intensity In Angular Range" in the angular region less than or equal to 30 degrees and less than or equal to "Minimum Intensity In Angular Range" in the angular region greater than 30 degrees. The measured intensity must be greater than or equal to "Minimum Intensity In Angular Range" in the angular region less than or equal to 15 degrees. The minimum allowable intensity value is indicated by “min” in Figure 5, since the actual specified value is dependent upon data rate.
Intensity |
(Vertical axis is not drawn to scale.) |
Unacceptable Range
500
|
|
|
Acceptable |
Range |
|
|
|
|
|
||||
|
|
|
|
|
|
|
|
|
min |
|
|
|
|
|
|
|
|
|
Unacceptable |
|
|
|
|
|
|||
|
|
|
|
|
|
|
|
|
|
|
|
||
|
|
|
|
|
|
|
|
|
|
|
|
|
|
-30 |
-15 |
0 |
15 |
30 |
|
||||||||
|
|
|
|
|
Angle (Degrees) |
|
|
|
|
|
|||
Figure 5. Acceptable Optical Output Intensity Range
The optical power measurements are converted to optical intensity across the +/- 30 degree region to verify both the maximum and minimum intensity specifications and sufficiently beyond +/- 30 degrees to verify the specification. Optical power is converted to intensity by the relationship
Intensity(mW/sr) = [Power(mW)]/[Detector Solid Angle(sr)].
The Detector Solid Angle in steradians is given by the relationship
Detector Solid Angle (sr) = 2pi[1-cos(Half-Angle)],
where the Half-Angle is half the angle subtended by the detector, viewed from the reference point.
The Detector Solid Angle can be approximated with the relationship
Detector Solid Angle (sr) ~ [Area of Detector]/[r^2],
where r is the distance between the test head and the reference point.
A.2.3. Pulse Parameters and Signaling Rate
The following six specifications form a set that can be measured with the same set-up:
-Rise Time tr, 10-90%, μs or ns
-Fall Time tf, 90-10%, μs or ns
-Pulse Duration, % of Bit or Symbol Period
-Optical Over Shoot, %
-Edge Jitter, μs or ns
-Signaling Rate, kbit/s or Mbit/s
30
IrDA Serial Infrared Physical Layer Specification, Version 1.4, February 6, 2001
These measurements require means to measure optical power and an oscilloscope (or equivalent) with sufficient bandwidth to resolve jitter to better than 0.2 μs (for data rates up to and including 115.2 kbit/s). For the data rates up to 4.0 Mbit/s, jitter down to 10 ns must be resolved. For 16.0 Mbit/s, the jitter is about 3 ns. Thus, the oscilloscope bandwidth should be sufficiently high to observe the jitter.
Definitions of the reference point, etc., are the same as for the Active Output Interface power measurements and the same considerations for test distance and signal strength apply. The test head should be positioned within +/-15 degrees of the optical axis and aimed directly at the reference point.
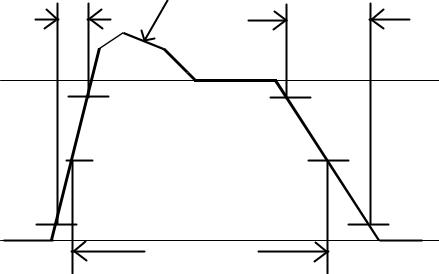
Rise Time, Fall Time, Pulse Duration and Overshoot can be measured for a single optical pulse. Since overshoot is referenced to the pulse amplitude at the end of the pulse, the maximum duration pulses should be used in this test. For Rise Time, Fall Time, Pulse Duration and Overshoot, refer to Figure 6. It is critical to determine the 100% level, since all four of these parameters are dependent upon it. If there is uncertainty concerning the existence of the flat region that defines the 100% level (is there over shoot, or does the pulse have a long, rounded top?), measurements at a longer drive pulse duration will resolve this, and allow easier determination of the 100% level.
Jitter and Signaling Rate require a sequence of pulses for determination. For data rates up to and including 115.2 kbit/s, the signal is asynchronous at the byte; therefore Jitter and Signal Rate are only relevant within a byte. For 0.576 Mbit/s, 1.152 Mbit/s and 4.0 Mbit/s, however, the optical bit stream is synchronous for up to 500 ms, though typically less than 20 ms (window = 7, packet size = 2k). Thus, the measurement requires the accumulation of data over a longer time interval.
|
Overshoot |
Tr |
Tf |
100% |
|
90% |
90% |
50% |
50% |
10% |
10% |
0% |
Pulse Duration |
|
|
Figure 6. Pulse Parameter Definitions |
|
The reciprocal of the mean of the absolute delay times between optical pulses is the data rate. Although some accuracy should be gained by the averaging, for only 1 asynchronous byte the tolerance requirement may be difficult to achieve with an oscilloscope. If UART frames are back to back (synchronous across bytes), use of an oscilloscope may be adequate. If access to an internal clock signal is available, a counter may be used.
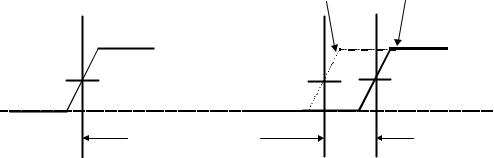
For rates up to and including 115.2 kbit/s, we can consider jitter to be the range of deviation between the leading edge of the optical pulse and a reference signal edge. Refer to Figure 7. For simplicity, the reference signal can be taken to be the leading edge of the first pulse in the byte (the “Start” pulse). Using the nominal data rate, the arrival time of each pulse in the byte can be predicted. The jitter (in time units) is
31
IrDA Serial Infrared Physical Layer Specification, Version 1.4, February 6, 2001
the maximum departure from predicted arrival time of the actual arrival time. Since jitter may be pattern dependent, various data should be used in the test signal.
For 0.576 Mbit/s and 1.152 Mbit/s RZI and 4.0 Mbit/s 4PPM and 16.0 Mbit/s HHH(1,13), an entire packet can be used to determine jitter. The optical signal should be detected using a high speed optical detector (e.g., a reverse-biased, small silicon p-i-n diode). The detector output signal is displayed using a storage oscilloscope set to trigger as often as possible during a packet, the stored image displaying an eye diagram. Care should be taken to use time constants in any ac coupling which are much, much longer than the symbol times.. The jitter (in time units) is half of the horizontal “smear” of the eye signal at the 50% level, where the leading and trailing edges of the signal cross (see Figure 8). To determine data rate, a counter may be used at 4.0 Mbit/s and 16.0 Mbit/s if a sufficiently long data transmission is available. For 0.576 Mbit/s and 1.152 Mbit/s, an oscilloscope and back to back packets are recommended to determine data rate.
For 0.576 and 1.152 Mbit/s, there may be some implementations which use a digital synthesizer to generate the transmitter clock. In this case, there may be jitter of up to +/- 25 ns relative to an idealized reference clock. Typically, with a 40 MHz primary clock, the jitter would be +/- 12.5 ns from the synthesizer, and another 5 ns or so from the driver and LED.
The jitter may be measured indirectly by using a high speed photodiode and a digitizing oscilloscope to measure the variance in edge to edge delay. Configure the transmitter to repetitively send large (2kb) packets of data (approximately 2 ms), and trigger the oscilloscope on any rising optical edge. Capture a section of the waveform delayed from the reference edge by 1 to 31 times the bit period. Capture several hundred repetitions at each delay, and measure the spread in the edge locations. It is necessary to measure at several delays since any one delay might be a multiple of the clock synthesis cycle, and show artificially small jitter. Measurements at several prime intervals should be sufficient, e.g., at 3, 7, 13 ,19, and 31 times the bit period. The jitter relative to a "reference" clock is one half of the worst case spread in the rising edges at each delay.
The jitter may also be measured relative to a reference clock generated with an analog phase locked loop with a tracking bandwidth of about 10 kHz, locked to the optical signal edges. In this case, the oscilloscope should be triggered on the reference clock edge, and several hundred optical signal edges should be collected. Adequate time must be allowed for the PLL to settle before collecting edges, so the oscilloscope trigger should be gated for several PLL time constants after the beginning of a packet.
Optical Pulse J
Optical Pulse 1 Predicted Actual
(Optical Reference Signal)
50% |
|
Predicted Delay |
Jitter |
Figure 7. Pulse Delay and Jitter Definitions
32