

Test-Bank-for-Heizer-Operations-Management-9e
.pdfPROBLEMS
109.Management is concerned that workers create more product defects at the very beginning and end of a work shift than at other times of their eight hour workday. Construct a scatter diagram with the following data, collected last week. Is management justified in its belief?
|
|
|
Number of defects |
|
||
|
Monday |
Tuesday |
|
Wednesday |
Thursday |
Friday |
First hour at work |
12 |
9 |
|
6 |
8 |
7 |
Second hour at work |
6 |
5 |
|
3 |
4 |
5 |
Third hour at work |
5 |
2 |
|
4 |
3 |
3 |
Fourth hour at work |
4 |
0 |
|
5 |
2 |
3 |
Fifth hour at work |
1 |
6 |
|
2 |
4 |
5 |
Sixth hour at work |
4 |
3 |
|
3 |
2 |
1 |
Seventh hour at work |
7 |
4 |
|
4 |
6 |
3 |
Eighth hour at work |
5 |
7 |
|
8 |
5 |
9 |
Solution: |
|
|
|
|
|
|
|
|
|
|
|
|
Number of Defects |
|
|
||||
|
12 |
|
|
|
|
|
|
|
|
count |
10 |
|
|
|
|
|
|
|
|
8 |
|
|
|
|
|
|
|
|
|
6 |
|
|
|
|
|
|
|
defects |
|
Defect |
|
|
|
|
|
|
|
||
4 |
|
|
|
|
|
|
|
|
|
2 |
|
|
|
|
|
|
|
|
|
|
|
|
|
|
|
|
|
|
|
|
0 |
|
|
|
|
|
|
|
|
|
0 |
1 |
2 |
3 |
4 |
5 |
6 |
7 |
8 |
|
|
|
|
Hour of workshift |
|
|
|
||
There is fairly convincing evidence that there are more defects in the first and last shift hours than at other times. (Tools of TQM, moderate) {AACSB: Analytic Skills}
121

110. Perform a Pareto analysis on the following information:
Reason for unsatisfying stay at hotel |
Frequency |
Unfriendly staff |
6 |
Room not clean |
2 |
Room not ready at check-in |
3 |
No towels at pool |
33 |
No blanket for pull-out sofa |
4 |
Pool water too cold |
3 |
Breakfast of poor quality |
16 |
Elevator too slow or not working |
23 |
Took too long to register |
7 |
Bill incorrect |
3 |
Total |
100 |
Solution |
|
|
|
|
|
|
|
|
|
|
|
|
|
|
|
|
|
|
|
|
|
|
|
|
|
|
|
120 |
|
|
|
|
|
|
|
|
|
|
|
|
|
|
|
|
|
|
|
|
|
|
|
|
|
|
Percent |
100 |
|
|
|
|
|
|
|
|
|
|
|
|
|
|
|
|
|
|
|
|
|
|
|
|
|
100 |
|
80 |
|
|
|
|
|
|
|
|
|
|
|
|
|
|
|
|
|
|
|
|
|
|
|
|
|
|
|
60 |
|
|
|
|
|
|
|
|
|
|
|
|
|
|
|
|
|
|
|
|
|
|
|
|
|
|
|
|
|
|
|
|
|
|
|
|
|
|
|
|
|
|
|
|
|
|
|
|
|
|
|
|
|
50 |
|
40 |
|
|
|
|
|
|
|
|
|
|
|
|
|
|
|
|
|
|
|
|
|
|
|
|
|
|
|
33 |
|
|
|
|
|
|
|
|
|
|
|
|
|
|
|
|
|
|
|
|
|
|
|
|
|
|
|
20 |
23 |
|
|
|
|
|
|
|
|
|
|
|
|
|
|
|
|
|
|
|
|
|
|
|
|
|
|
|
|
16 |
|
|
|
|
|
|
|
|
|
|
|
|
|
|
|
|
|
|
|
|
|
|
|
||
0 |
|
|
|
|
|
7 |
|
|
6 |
|
|
|
|
|
|
|
|
|
|
|
|
|
|
|
|
0 |
|
N |
Ele |
B |
|
T |
|
|
|
|
N |
|
|
Room |
Pool |
B |
|
|
|
R |
|
|
|||||||
o |
|
r |
|
o |
|
|
|
|
o |
|
|
il |
|
|
|
o |
|
|
|||||||||
to |
|
v |
|
e |
|
ok |
|
|
|
|
b |
|
|
l |
|
|
|
om |
|
||||||||
|
|
a |
|
|
|
|
|
|
|
in |
|
|
|||||||||||||||
|
|
a |
|
|
k |
|
|
|
|
|
|
la |
|
|
|
|
c |
|
|||||||||
we |
t |
|
|
fa |
|
to |
|
|
|
|
|
|
|
wa |
|
|
n |
|
|||||||||
or |
|
|
|
|
|
n |
|
not |
|
|
o |
|
|||||||||||||||
|
ls |
|
to |
|
s |
|
|
o |
|
|
|
|
k |
|
|
t |
|
|
r |
ot |
|
||||||
|
|
|
t |
|
Unfriendly |
|
|
e |
|
|
er |
|
|
re |
|
||||||||||||
|
at |
|
o |
|
o |
|
long |
|
|
|
|
t |
|
|
r |
|
|
|
|
|
c |
c |
|
||||
|
|
|
|
f |
|
|
staff |
|
f |
|
|
e |
|
too |
|
|
t |
l |
|
||||||||
|
|
p |
|
slo |
|
p |
|
|
o |
|
|
a |
|
|
|
|
e |
|
|||||||||
|
|
|
|
|
|
|
|
r |
|
d |
|
|
|
|
a |
|
|||||||||||
|
|
o |
|
|
o |
to |
|
|
p |
|
|
|
|
|
|
|
|||||||||||
|
|
o |
|
w |
|
o |
|
|
|
|
y |
|
cold |
n |
|
||||||||||||
|
|
l |
|
|
|
r |
|
|
|
|
|
|
|
u |
a |
|
|
||||||||||
|
|
|
|
|
|
|
|
|
reg |
|
|
|
|
|
l |
|
|
||||||||||
|
|
|
|
|
|
or |
|
|
qu |
|
|
|
|
|
|
l |
|
t |
|
|
|||||||
|
|
|
|
|
|
|
|
|
|
|
|
|
|
- |
|
|
c |
|
|
|
|
|
|
||||
|
|
|
|
|
|
|
|
|
|
|
|
|
|
|
|
|
|
|
|
|
h |
|
|
|
|
|
|
(Tools of TQM, moderate) {AACSB: Analytic Skills}
122
111. Perform a Pareto analysis on the following information:
Reason for unsatisfying check-out at store |
Frequency |
Unfriendly cashier |
27 |
Incorrect change |
4 |
Cashier too slow |
9 |
Price check |
34 |
Poorly bagged merchandise |
2 |
Slow receiving check approval |
3 |
Solution |
|
100 |
Percent |
|
|
80 |
100 |
60 |
|
40 |
50 |
|
34 |
20 |
27 |
|
|
|
9 |
0 |
0 |
Price check |
Cashier too slow |
Slow receiving check |
|
Unfriendly cashier |
Incorrect change Poorly bagged mercha |
||
(Tools of TQM, moderate) {AACSB: Analytic Skills}
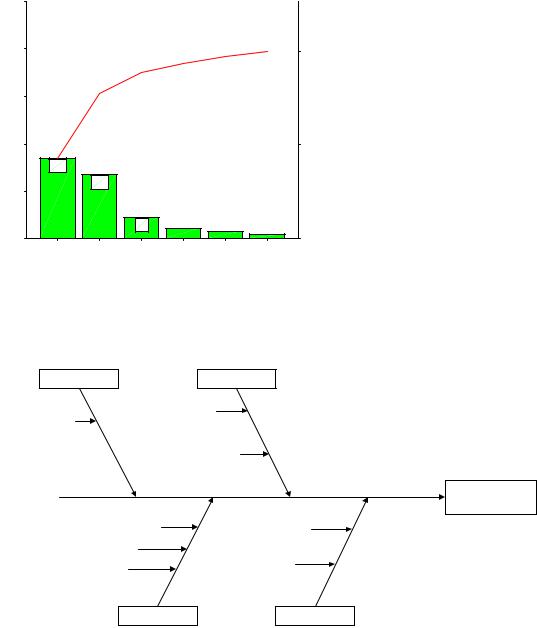
112.Construct a cause-and-effect diagram showing why a student might be dissatisfied with the cafeteria.
Solution: (Note that answers may vary considerably)
(Tools of TQM, Moderate) {AACSB: Analytic Skills}
123

113.Pretend that you have just come from a relative's wedding reception. It didn't turn out as well as it should have, and the bride's parents are pretty mad at how things turned out. Use the supplied template to construct a conventional cause-and-effect diagram. Identify twelve sources of defects for the issue "dissatisfied customer of wedding reception caterer." (Your dozen need not be exactly three per main cause, but should be a balanced treatment.) Categorize each cause onto a main cause. Provide brief support for each of your choices
Solution: Individual responses may vary considerably; some of the variation in responses comes from differing views of what is the caterer's realm of responsibility, compared to what might be assigned to a wedding planner instead. Material: not enough plates, glassware, utensils; prepared wrong dish; food was cold; ran out of food; food was "bad." Machinery: air conditioning/heating was broken; room was dirty; room too small; furniture poorly arranged; wedding "props" ugly or shopworn. Method: not on time; overcharged; not enough workers. Manpower: wait staff not properly attired; wait staff not speedy; wait staff not courteous. Responses should comment as necessary to show why a fault lies on a certain main branch; as an example, "cold food" might be interpreted as Method, not Material. (Tools of TQM, moderate) {AACSB: Analytic Skills}
124

114.A refrigeration and heating company—one that installs and repairs home central air and heating systems—has asked your advice on how to analyze their service quality. They have logged customer complaints. Here's a recent sampling. Use the supplied template to construct a conventional cause-and-effect diagram. Place each of the complaints onto a main cause; justify your choice with a brief comment as necessary.
1."I was overcharged—your labor rates are too high."
2."The repairman left trash where he was working."
3."You weren't here when you said you would be. You should call when you must be late."
4."Your repairman smoked in my house."
5."The part you installed is not as good as the factory original."
6."Your repairman was here for over two hours, but he wasn't taking his work seriously."
7."You didn't tighten some of the fittings properly—the system's leaking."
8."Your estimate of repair costs was WAY off."
9."I called you to do an annual inspection, but you've done more—work that I didn't authorize."
10."Your mechanic is just changing parts—he doesn't have a clue what's really wrong."
11."Your bill has only a total—I wanted to see detail billing."
12."Your testing equipment isn't very new—are you sure you've diagnosed the problem?"
13."One of the workmen tracked mud into my living room."
Solution: Individual responses may vary. A typical set of responses might be Material: item 5. Method: items 1, 3, 8, 9, 11. Machinery: item 12; Manpower: items 2, 4, 6, 7, 10, 13. Items 8 and 11 could be manpower or method. (Tools of TQM, moderate) {AACSB: Analytic Skills}
125
SUPPLEMENT 6: STATISTICAL PROCESS CONTROL
TRUE/FALSE
1.Some degree of variability is present in almost all processes.
True (Statistical Process Control (SPC), easy)
2.The purpose of process control is to detect when natural causes of variation are present.
False (Statistical Process Control (SPC), moderate)
3.A normal distribution is generally described by its two parameters: the mean and the range.
False (Statistical Process Control (SPC), easy)
4.A process is said to be in statistical control when assignable causes are the only sources of variation.
False (Statistical Process Control (SPC), moderate)
5.Mistakes stemming from workers' inadequate training represent an assignable cause of variation.
True (Statistical Process Control (SPC), easy)
6.Averages of small samples, not individual measurements, are generally used in statistical process control.
True (Statistical Process Control (SPC), moderate)
7.The X-bar chart indicates that a gain or loss of uniformity has occurred in dispersion of a production process.
False (Statistical Process Control (SPC), moderate)
8.The Central Limit Theorem states that when the sample size increases, the distribution of the sample means will approach the normal distribution.
True (Statistical Process Control (SPC), moderate)
9.In statistical process control, the range often substitutes for the standard deviation.
True (Statistical Process Control (SPC), moderate)
10.If the process average is in control, then the process range must also be in control.
False (Statistical Process Control (SPC), moderate)
11.A process range chart illustrates the amount of variation within the samples.
True (Statistical Process Control (SPC), moderate)
12.Mean charts and range charts complement one another, one detecting shifts in process average, the other detecting shifts in process dispersion.
True (Statistical Process Control (SPC), moderate)
13.X-bar charts are used when we are sampling attributes.
False (Statistical Process Control (SPC), easy)
126
14.To measure the voltage of batteries, one would sample by attributes.
False (Statistical Process Control (SPC), easy)
15.A p-chart is appropriate to plot the number of typographic errors per page of text.
False (Statistical Process Control (SPC), easy)
16.A c-chart is appropriate to plot the number of flaws in a bolt of fabric.
True (Statistical Process Control (SPC), easy)
17.The x-bar chart, like the c-chart, is based on the exponential distribution.
False (Statistical Process Control (SPC), moderate)
18.A process that is in statistical control will always yield products that meet their design specifications.
False (Process capability, moderate)
19.The higher the process capability ratio, the greater the likelihood that process will be within design specifications.
True (Process capability, moderate)
20.The Cpk index measures the difference between desired and actual dimensions of goods or services produced.
True (Process capability, moderate)
21.Acceptance sampling accepts or rejects an entire lot based on the information contained in the sample.
True (Acceptance sampling, moderate)
22.A lot that is accepted by acceptance sampling is free of defects.
False (Acceptance sampling, moderate)
23.In acceptance sampling, a manager can reach the wrong conclusion if the sample is not representative of the population it was drawn from.
True (Acceptance sampling, moderate)
24.The probability of rejecting a good lot is known as consumer's risk.
False (Acceptance sampling, moderate)
25.An acceptance sampling plan must define "good lots" and "bad lots" and specify the risk level associated with each one.
True (Acceptance sampling, moderate)
26.The acceptable quality level (AQL) is the average level of quality we are willing to accept.
False (Acceptance sampling, moderate)
27.The steeper an OC curve, the better it discriminates between good and bad lots.
True (Acceptance sampling, moderate)
127
MULTIPLE CHOICE
28.If a sample of items is taken and the mean of the sample is outside the control limits the process is
a.out of control and the cause should be established
b.in control, but not capable of producing within the established control limits
c.within the established control limits with only natural causes of variation
d.monitored closely to see if the next sample mean will also fall outside the control limits
e.producing high quality products
a (Statistical Process Control (SPC), moderate)
29.The causes of variation in statistical process control are
a.cycles, trends, seasonality, and random variations
b.producer's causes and consumer's causes
c.mean and range
d.natural causes and assignable causes
e.Type I and Type II
d (Statistical Process Control (SPC), moderate)
30.Natural variations
a.affect almost every production process
b.are the many sources of variation that occur when a process is under control
c.when grouped, form a pattern, or distribution
d.are tolerated, within limits, when a process is under control
e.All of the above are true.
e (Statistical Process Control (SPC), moderate)
31.Natural variations
a.are variations that are to be identified and eliminated
b.are variations that can be traced to a specific cause
c.are the same as assignable variations
d.lead to occasional false findings that processes are out of control
e.play no role in statistical process control
d (Statistical Process Control (SPC), moderate)
32.Assignable variation
a.is a sign that a process is under control
b.is to be identified and eliminated
c.is the same as random variation
d.is variation that cannot be traced to a specific cause
e.leads to a steep OC curve
b (Statistical Process Control (SPC), moderate)
33.Assignable causes
a.are not as important as natural causes
b.are within the limits of a control chart
c.depend on the inspector assigned to the job
d.are also referred to as "chance" causes
e.are causes of variation that can be identified and removed
e(Statistical Process Control (SPC), moderate)
128

34.Control charts for variables are based on data that come from
a.acceptance sampling
b.individual items
c.averages of small samples
d.averages of large samples
e.the entire lot
c (Statistical Process Control (SPC), moderate)
35.The purpose of an X chart is to determine whether there has been a
a.gain or loss in uniformity
b.change in the percent defective in a sample
c.change in the central tendency of the process output
d.change in the number of defects in a sample
e.change in the AOQ
c (Statistical Process Control (SPC), moderate)
36.Statistical process control charts
a.display the measurements on every item being produced
b.display upper and lower limits for process variables or attributes, and signal when a process is no longer in control
c.indicate to the process operator the average outgoing quality of each lot
d.indicate to the operator the true quality of material leaving the process
e.none of the above
b (Statistical Process Control (SPC), moderate)
37.A sample of parts is measured. The mean of this sample is in the middle of the control limits, but some individual parts measure too low for design specifications and other parts measure too high. Which of the following is true?
a.The process is out of control, and the cause should be established.
b.The process is in control, but not capable of producing within the established control limits.
c.The process is within the established control limits with only natural causes of variation.
d.The process is outside the established control limits with only natural causes of variation.
e.The process is in control, and there is nothing to worry about.
b (Statistical Process Control (SPC), difficult)
38.The Central Limit Theorem
a.is the theoretical foundation of the c-chart
b.states that the average of assignable variations is zero
c.allows managers to use the normal distribution as the basis for building some control charts
d.states that the average range can be used as a proxy for the standard deviation
e.controls the steepness of an operating characteristic curve
c (Statistical Process Control (SPC), difficult)
129

39.For an x-bar chart where the standard deviation is known, the Upper Control Limit a. is 3 σ below the mean of sample means for a 3σ control chart
b. |
is 3 σ above the mean of sample means for a 3σ control chart |
|
c. |
is 3 σ |
n below the mean of sample means for a 3σ control chart |
d. |
is 3 σ |
n above the mean of sample means for a 3σ control chart |
e.cannot be calculated unless the average range is known
d(Statistical Process Control (SPC), moderate)
40.Up to three standard deviations above or below the centerline is the amount of variation that statistical process control allows for
a.Type I errors
b.about 95.5% variation
c.natural variation
d.all types of variation
e.assignable variation
c (Statistical Process Control (SPC), moderate)
41.A manager wants to build 3σ control limits for a process. The target value for the mean of the process is 10 units, and the standard deviation of the process is 6. If samples of size 9 are to be taken, the UCL and LCL will be
a.-8 and 28
b.16 and 4
c.12 and 8
d.4 and 16
e.8 and 12
b (Statistical Process Control (SPC), moderate) {AACSB: Analytic Skills}
42.The type of inspection that classifies items as being either good or defective is
a.variable inspection
b.attribute inspection
c.fixed inspection
d.all of the above
e.none of the above
b (Statistical Process Control (SPC), moderate)
43.The x-bar chart tells us whether there has been a
a.gain or loss in dispersion
b.change in the percent defective in a sample
c.change in the central tendency of the process output
d.change in the number of defects in a sample
e.none of the above
c (Statistical Process Control (SPC), moderate)
130