

2.4 Analysis of assets and liabilities management of jsc Kazkommertsbank
By results of the last years Kazcom bank is the leader of the banking sector on the volume of assets: its share in the market makes 19,4%, it also is leading bank on crediting and deposits, the share on the volume of a loan portfolio made 20,9%, and on deposits of clients 17,7%.
Table 14
Assets of JSC Kazkommertsbank
|
Assets |
2012 (mln.KZT) |
2011 (mln.KZT) |
2010 (mln.KZT) |
2009 (mln.KZT) |
Changes for 2009-2012 in (%) |
|
Money and accounts in national (central) banks |
106,497 |
105,067 |
61.216 |
90,533 |
17,63% |
|
The continue of table 14 | |||||
|
Precious metals |
3,823 |
3,280 |
1,345 |
1,209 |
216,21% |
|
The financial assets estimated at fair value through profit or a loss |
118,822 |
188,313 |
223,231 |
114,203 |
4,04% |
|
Loans and the means provided to banks and other financial institutions |
146,703 |
53,968 |
146,331 |
148,375 |
-1,13% |
|
The loans provided to clients |
1,917,692 |
2,079,661 |
2,174,760 |
2,160,767 |
-11,25% |
|
Investments available for sale |
15,682 |
15,419 |
16,822 |
16,696 |
-6,07% |
|
The investments withheld before repayment |
6,937 |
4,026 |
1,996 |
943 |
635,63% |
|
Business reputation |
2,405 |
2,405 |
2,405 |
2,405 |
0,00% |
|
Fixed assets and intangible assets |
32,520 |
33,028 |
31,857 |
33,971 |
-4,27% |
|
Other assets |
89,511 |
80,522 |
28,145 |
18,771 |
376,86% |
|
Total assets |
2,444,812 |
2,565,689 |
2,688,108 |
2,587,873 |
-5,52%
|
|
Note - source website www.kkb.kz | |||||
Analyzed period since 2009 to 2012 showed increase in investments withheld before repayment increased by 6 bln KZT or in 634%, assets in precious metals were increased by 2,6 bln KZT of in 216%, money and accounts in national bank were increased by 16 bln KZT or in 17%, financial assets estimated at fair value through profit or loss were increased by 4,6 bln KZT or in 4%, while other assets show decrease in volume. So loans provided to clients were decreased by 243 bln KZT or in 11%, investments available for sale were decreased by 1,5 bln KZT or in 4%, loans and the means provided to banks and other financial institutions were decreased by 1,6 bln KZT or in 1%. Other assets were increased by 70 bln KZT or in 376%. In total analyzed period show decrease – total assets were decreased by 143 bln KZT or in 5,5%.
Volume of "reliable" and "potentially reliable" credits, as of December 31, 2011 made 682,4 billion KZT (4 599 million dollars), in comparison with 800,9 billion KZT (5 429 million dollars) for the end of 2010. Their share in the considered period made 24,9%. For comparison year before their share I made 29,2%. The share of the problem credits in a loan portfolio grows since 2007, and it first of all is connected with deterioration of a financial condition of the borrowers interfaced to the crisis phenomena, taking place in the country more than four years. The share of the "doubtful" and "unprofitable" credits remained invariable in comparison with December 31, 2010, their share for the end of 2011 made 30,7%.


Note - source websitewww.kkb.kz)
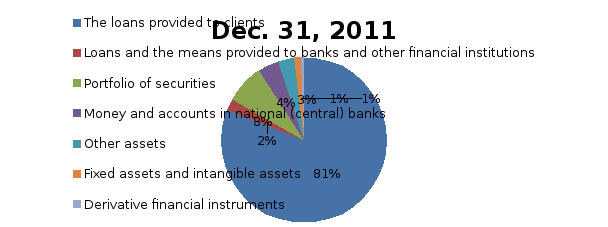
Figure 20. Comparative structure of assets as of December 31, 2011, 2010 and 2009
The loans issued to clients continue to remain the largest article in structure of assets of Group. As of December 31, 2011 their share made 81,1% against 80,9% as of December 31, 2010. Decrease in the actual volumes of liquid assets, in comparison with last year, generally resulted from reduction of volumes of percentage obligations. Optimization of obligations, didn't affect execution by Bank of standards for liquidity. As of December 31, 2011 the assets relating to most liquid (money and accounts in the national banks, securities, loans and the means provided to other banks with a maturity date till 1 year) not burdened with pledge or the right of the requirement made 290,6 billion KZT (11,3% from total assets), having shown decrease in comparison with 386,7 billion KZT of 14,4% from total assets) as of December 31, 2010. Reduction made 96,1 billion KZT or 24,8%. There was a redistribution of part of liquid means between the articles "Money and Accounts in National (Central) Banks" and "Loans and the Means Provided to Banks and Other Financial Institutions". The share of money and accounts in national central) banks increased for the end of 2011 to 4,2%, in comparison with 2,3% for the beginning of the reporting period. Loans and the means presented to banks and other financial institutions, decreased and made 2,1% from assets as of December 31, 2011, in comparison with 5,4% as of December 31, 2010. The share of a portfolio of securities in structure of assets decreased from 8,2% to 7,6%. The share of other assets as of December 31, 2011 made 3,1%, against 1% for the period beginning. Considerable changes didn't occur in structure of assets of bank from 2009 to 2010. The increase in volume of assets occurred generally at the expense of growth of a portfolio of securities (126,1 billion KZT or 859 million dollars). Temporarily free money was placed in the most liquid assets, such as short-term notes of national bank of the Republic of Kazakhstan and the state treasury obligations. Decrease in a share of the loans provided to clients on 2,6 points became possible generally at the expense of increase in a share of liquid assets in structure of assets of bank to 15,9% in 2010 in comparison with 13,0% in 2009. Owing to increase bank of investments in liquid financial instruments, the share of a portfolio of securities in structure of assets grew from 3,7% to 8,2%./28/
According to the analysis of deposit and non-depository sources, we can see that the volume of deposit sources is equal to 1.5 trillion tenge or 74% from all sources, while the volume of non-depository sources is equal to 548 billion tenge or 26%. On the basis of analyzes, we identified that the deposit is the main source of funding. In comparison with 2010 (69%) and 2011 (72%) KazCom attracts more depository sources of funding. The cost of deposits 4,2% for 2012, average cost of non-depository sources 7,041. On the basis of this statistic we can say that deposits are cheaper sources than non-depository sources.
Table 15
Liabilities sector efforts of KazCom bank in 2012
|
Liabilities |
2012 (mln. KZT) |
2011 (mln. KZT) |
2010 (mln. KZT) |
2009 (mln. KZT) |
Changes for 2009-2012 in (%) |
|
Loans and means to banks and other financial institutions |
110,477 |
92,215 |
147,139 |
209,122 |
-47,17% |
|
Means of clients |
1,553,576 |
1,463,077 |
1,506,800 |
1,276,464 |
21,71% |
|
The financial liabilities estimated at fair value through profit or a loss |
8,877 |
37,771 |
36,047 |
35,991 |
-75,34% |
|
The issued debt securities |
297,247 |
324,087 |
375,199 |
463,656 |
-35,89% |
|
The other raised funds |
18,631 |
26,359 |
23,943 |
31,172 |
-40,23% |
|
Reserves |
15,549 |
10,724 |
10,190 |
11,945 |
30,17% |
|
Liabilities for a deferred income tax |
- |
29,131 |
30,035 |
24,519 |
-100,00% |
|
Dividends to payment |
40 |
6 |
4 |
15 |
166,67% |
|
Other liabilities |
10,296 |
7,647 |
7,868 |
8,990 |
14,53% |
|
The subordinated loan |
122,150 |
138,040 |
137,137 |
136,411 |
-10,45%
|
|
Total liabilities |
2,136,843 |
2,129,057 |
2,274,362 |
2,198,285 |
-2,79% |
|
Note - source website www.kkb.kz | |||||
During the analyzed period since 2009 on 2012 means of clients grew by 277 billion KZT or in 21,71%, reserves grew by 3,6 billion KZT and dividends to payment grew by 30 mln KZT or in 166,6% while other articles showed decrease in volumes, so according to loans and means of banks and other financial institutions decrease made 98 billion KZT or in 47,7%, financial liabilities estimated at fair value through profit or loss were decreased by 27 bln KZT or in 75%, the issued debt securities were deceased by 166 bln KZT or in 35%, other raised funds were decreased by 12,5 bln KZT or in 40%, subordinated loan was decreased by 14 bln KZT or in 10%, liabilities for a deferred income tax were closed. Other liabilities were increased by 1,3 bln KZT or in 10%. However in total there are almost no changes for analyzed period – total liabilities were decreased by 61 bln KZT or in 2,7%.
Optimization of obligations of the bank, directed on decrease in percentage expenses has the main impact on decrease in volumes of corporate sector./28/
In liabilities sector efforts of KazCom bank in 2012 were directed on decrease in percentage expenses by optimization of percentage obligations.
At the same time KazCom bank traced a situation in foreign markets, for definition of acceptable opportunity for attraction of financing, and finished placement of Eurobonds on 300 million US dollars that showed degree of confidence and interest of the international investors in bank. In the reporting period the bank continued service of the obligations under the established schedules.
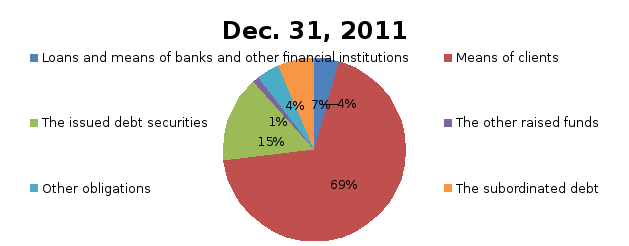
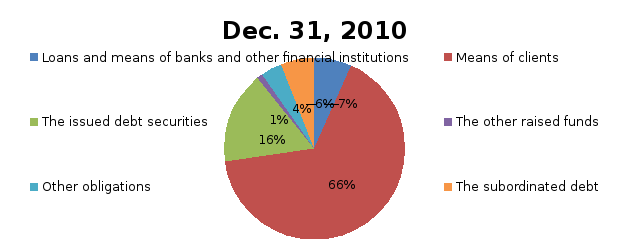
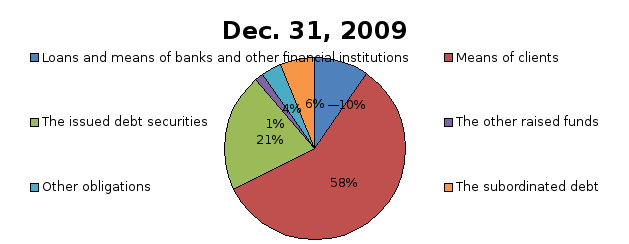
Figure 21.Comparative structure of liabilities as of December 31, 2011, 2010 and 2009
The bank pays much attention to effective management of assets and obligations which allows Bank to offer competitive products in the market and, at the same time, to support a risk and profitability ratio at the level creating additional cost for shareholders. The body responsible for risk management, assets arising in management process and obligations is the Committee on management of assets and liabilities of Group. Information considered by this committee includes data on a portfolio of securities, currency positions, liquidity gaps, cash flows, stress tests and others. It is very important to define bank liquidity coefficient correctly.
By data from a site AFN.kz the coefficient of the current bank liquidity in 2012 made 0,5, having decreased by 20,9% as a result of decrease in money for 26,3%. The average value of the current liquidity over the last 5 years made around 1,15.
While the absolute liquidity index in 2012 made 5,6 that is 32,1% lower than an indicator of 2011 equal to 8,3 at the expense of decrease in money for 26,3%. The average value over the last 5 years makes about 5,9. The minimum limit of the standard is 0,2.
The analysis of liquidity of balance consists in comparison of means on an asset, grouped in degree of decreasing liquidity, with sources of formation of assets on a passive which are grouped in degree of urgency of repayment.
The following tables submit the analysis of financial assets and liabilities grouped in terms before repayment from reporting date as of Dec. 31, 2011:
Table 16
Structure of assets by liquidity
|
Financialassets: |
A1 (The most liquid assets) |
A2 (Quickly realized assets) |
A3 (Slowly realized assets) |
A4 (Difficult realized assets) |
|
|
(mln. KZT) |
(mln. KZT) |
(mln. KZT) |
(mln. KZT) |
|
Financialassets: |
290,843 |
728,385 |
1,353,979 |
321,459 |
Note - source website www.kkb.kz
Table 17
Structure of liabilities by liquidity
|
|
L1 (The most urgent liabilities) |
L2 (Current liabilities) |
L3 (Long-term liabilities) |
L4 (Constant liabilities) |
|
Financialobligations: |
(mln. KZTs) |
(mln. KZTs) |
(mln. KZTs) |
(mln. KZTs) |
|
|
595,898 |
449,176 |
830,638 |
413,743 |
|
Note – source website www.kkb.kz | ||||
Now we can compare assets and liabilities with standards:
Table 18
Comparison of assets and liability with standards
|
Standards |
Data for Dec. 31, 2011 |
|
|
A1≥ L1; |
359,843<595,898 |
A1<L1 |
|
A2≥L2 |
728,385>449,176 |
A2>L2 |
|
A3≥P3 |
1,353,979>830,638 |
A3>A3 |
|
A4≤L4 |
321,459<413,743 |
A4<L4 |
Table 19
Execution of prudential and standards of liquidity
|
|
Liquidity | ||
|
|
k4 |
k4-1 |
k4-2 |
|
Standards |
≥0,30 |
≥0,9 |
≥0,8 |
|
Coefficients as of 01.01.2012 |
0,64 |
8,32 |
2,892 |
|
Coefficients as of 01.01.2011 |
0,68
|
10,54 |
4,15 |
|
1 Note – source website www.AFN.kz 2 Note - source website www.cesec.kz | |||
Thus, JSC Kazkommertsbank isn’t absolutely liquid. Bank liquidity is broken in the short-term period, i.e. the most urgent obligations exceed the most liquid assets. It can cause difficulty in performance by Bank of the obligations under deposits before clients. As for long-term liquidity and performance of standards of sufficiency of the capital, it is possible to draw a conclusion that the bank in long-term prospect is solvent. The bank stabilizes liquidity in comparison with 2009 when liquidity in the short-term and medium-term period was broken. However it should be noted that management of bank considers that depositors won't lose confidence of bank at once, and on the contrary the bank will attract all new and new deposits. In this case this deviation of liquidity is part of policy of the bank. In general liquidity conforms to standards./16/