

2.3 Analysis of non-deposits sources of funding in Kazkommertsbank rk
In 2012 the volume of non-deposit resources was 407,724 billion KZT, 416,302 billion KZT in 2011, 522,338 billion KZT in 2010. In comparison with 2011, 2010, we can see the tendency to the decrease in volume of non-deposit resources in 2012.
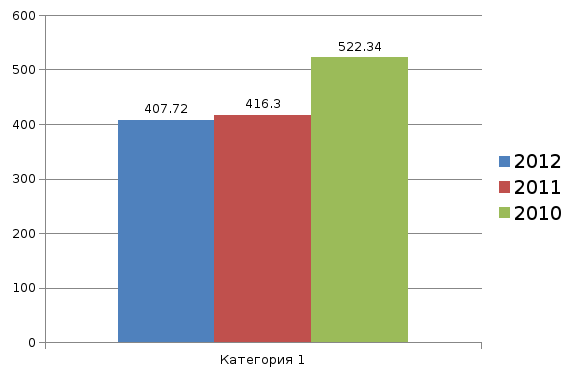
Note - Complied by the author according to the data of website www.kkb.kz
Figure 14. The volume of non-deposit sources in 2010-2012, billion KZT
As at 31 December 2012, accrued interest expense included in loans and advances from banks and other financial institutions amounted to KZT 213 million (2011: KZT 236 million, 2010: KZT 492 million).
As at 31 December 2012, loans from other banks and financial institutions of KZT 23,546 million (97.35% of total loans from other banks and financial institutions) (2011: KZT 42,890 million or 97% of total loans with other banks and financial institutions, 2010: KZT 116,985 million or 96% of total loans from other banks and financial institutions) consisted of 7 (2011: 6, 2010: 9) banks and financial institutions of such countries as Great Britain, Latvia, Kazakhstan, Russian Federation, United States of America, the Netherlands and China. Maturities of these loans range from 12 months to 97 months (2011: 7 days to 97 months, 2010: 48 days to 52 months). Interest rates on loans with other banks and financial establishments varied from 0.86% to 7.00% (2011: from 0.25% to 9%, 2010: from 1.33% to 9.75%).
In diagram we can see that Kazkommertsbank took out most of loans under repurchase agreements (65%). Loans from other banks and financial institutions take second place (22,1%). The percentage of loan with maturity of June 2014 is 7,6 %.

Note - Compiled by the author according to the data of website www.kkb.kz
Figure 15. Percentage share of loans and advances from banks and other financial institutions
As at 31 December 2012, included in loans and advances from banks and other financial institutions are loans under repurchase agreements of KZT 71,486 million (2011: KZT 27,937 million, 2010: KZT 26 million).
The fair value of collateral and carrying value of loans under repurchase agreements as at 31 December 2012, 2011 and 2010 are presented as follows:
Table 13
Fair value of collateral and Carrying value of loans
|
|
31 December 2012 (mln. KZT) |
31 December 2011 (mln. KZT) |
31 December 2010 (mln. KZT) | ||||
|
|
Fair value of collateral |
Carrying value of loans |
Fair value of collateral |
Carrying value of loans |
Fair value of collateral |
Carrying value of loans | |
|
Bonds of the Ministry of Finance of the Republic of Kazakhstan |
65,186 |
60,222 |
- |
- |
- |
- | |
|
The continue of table13 | |||||||
|
Bonds of foreign companies |
8,964 |
7,857 |
- |
- |
- |
- | |
|
Municipal bonds of RF |
1,993 |
1,895 |
- |
- |
- |
- | |
|
Bonds of foreign banks |
1,793 |
1,512 |
- |
- |
- |
- | |
|
Notes of the NBRK |
- |
|
29,404 |
27,937 |
- |
- | |
|
Shares of Kazakhstan companies |
- |
- |
- |
- |
37 |
26 | |
|
In total |
77,936 |
71,486 |
29,404 |
27,937 |
37 |
26 | |
|
Note - source website www.kkb.kz | |||||||
As at 31 December 2012, reverse repurchase agreements were concluded through KASE. The Bank believes that counterparties of these agreements are banks and other financial institutions.
Let’s analyze another non-deposit resource – debt securities.
In 2012 the volume of debt securities issued amounted to 297,247 billion KZT, 324,087 billion KZT in 2011, 375,199 billion KZT in 2010.
We see a tendency to decrease in volume of debt securities.

Note - Complied by the author according to the data of website www.kkb.kz
Figure 16. Volume of debt securities issued in 2010-2012, billion KZT
Interest on debt securities issued amounted to 24,737 billion KZT in 2012, 28,701 billion KZT in 2011, 31,313 billion KZT in 2010. The amount of securities issued was 297,247 billion KZT in 2012, 324,087 billion KZT in 2011, 375,199 billion KZT in 2010.
On the basis of below mentioned data the cost of debt securities issued is equal to:
24,737 billion KZT/297,247 billion KZT*100%=8,322% in 2012
28,701 billion KZT/324,087 billion KZT*100%=8,856% in 2011
31,313 billion KZT/375,199 billion KZT*100%=8,346 in 2010

Note - Complied by the author according to the data of website www.kkb.kz
Figure 17.The cost of debt securities issued in 2010-2012
Through analyzing the below presented data we could conclude the following:
The cost of debt securities is stable through the last 3 years. There was the growth in 2011 in comparison with 2010 and then the cost has fallen marginally. Analyzing this tendency we could suppose that next 3 years wouldn’t be high growth of cost of debt securities.
Interest on loans and advances from banks and other financial institutions was 3,972billion KZT in 2012, 5,412 billion KZT in 2011, 7,947 billion KZT in 2010. Loans and advances from banks and other financial institutions were amounted to 110,477 billion KZT in 2012, 92,215 billion KZT in 2011, 147,139 billion KZT in 2010.
On the basis of below mentioned data the cost of loans and advances from banks and other financial institutions is equal to:
3,972billion KZT/110,477 billion KZT*100%=3,595% in 2012
5,412 billion KZT/92,215 billion KZT*100%=5,869% in 2011
7,947 billion KZT/147,139 billion KZT*100%=5,401% in 2010

Note - Complied by the author according to the data of website www.kkb.kz
Figure 18.The cost of loans and advances from banks and other financial institutions in 2010-2012
Through analyzing the below presented data we could conclude the following:
The cost of loans and advances from banks and other financial institutions is changeable through the last 3 years. In comparison with the previous 2011 and 2010 years the cost has fallen marginally in 2012. The reason is that interest rate was reduced during 3 years.
There are following steps for calculation of the average cost of non-deposit resources:
The sum of Interest rate on debt securities and interest rate on loans and advances from banks and other financial institutions is equal to 28,709 billion KZT in 2012, 34,113 billion KZT in 2011, 39,260 billion KZT in 2010.
The sum of amount of debt securities and amount of loans and advances from banks and other financial institutions is equal to 407,724 billion KZT in 2012, 416,302 billion KZT in 2011, 522,338 billion KZT in 2010.
On the basis of below mentioned data the average cost of non-deposit resources is equal to:
28,709 billion KZT /407,724 billion KZT *100%=7,041% in 2010
34,113 billion KZT/416,302 billion KZT*100%=8,194% in 2011
39,260 billion KZT/522,338 billion KZT*100%=7,516% in 2010
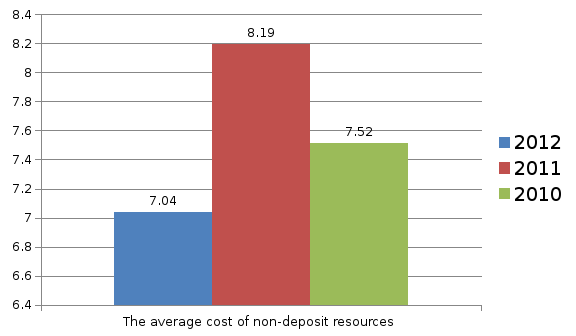
Note - Complied by the author according to the data of website www.kkb.kz
Figure 19.The average cost of non-deposit resources in 2010-2012
Through analyzing the below presented data we could observe the decrease in the average cost of non-deposit resources in 2012 in comparison with 2011 and even 2010. Such changes is explained by the decrease of cost of debt securities issued and the cost of loans and advances from banks and other financial institutions.