

prt%3A978-0-387-35973-1%2F16
.pdfModeling with ISO 191xx Standards |
711 |
Modeling with ISO 191xx Standards, Figure 6 Complex curve
Modeling with ISO 191xx Standards, Figure 7 Topological primitives and complex speciÞed by ISO 19107
TP_Primitives include TP_Node, TP_Edge, TP_Face, and TP_Solid, which parallel the geometric primitives presented earlier. TP_Complex aggregates TP_Primitives of different types up to the dimension of the complex. For example, a complex referring to a road network would include TP_Nodes and TP_Edges.
Temporal Schema The representation of geographic features or attributes in an application schema or a geographic database may also have a temporal deÞnition. For example, a bridge could be accessible only within speciÞc periods of time in a day. ISO 19108 Temporal Schema [12] deÞnes primitives, topological primitives, and topological complexes for the description of temporal characteristics. Basically, there are two temporal primitives: TM_Instant and TM_Period (Fig. 8). TM_Instant is used to describe a point in the time dimension whereas TM_Period represents a temporal extent, i. e., duration. A topological primitive, TM_Node or TM_Edge, provides information about its linkage or connectivity with other topological primitives. A set of topological primitives linked together forms a temporal topological complex, i. e., a TM_TopologicalComplex.
Application Schema Geographic databases are collections of representations of geographic real world phenomena, i. e., geographic features that hold in a speciÞc context and are of interest for users and/or applications. The manner in which a real world phenomenon is described
depends on the perception of the observer about that phe- |
|
|
nomenon from which he/she abstracts characteristics of |
|
|
importance. Typically, an application schema is used to |
|
|
identify geographic as well as nongeographic features and |
|
|
their characteristics that are maintained in a geographic |
|
|
database or processed in an application. |
|
|
For the same universe of discourse, observers may come |
|
|
to different conceptual models. Consequently, it is neither |
|
|
desirable nor of interest to standardize conceptual mod- |
|
|
els. However, ISO 19109 Rules for Application Schema |
|
|
deÞnes a number of rules to develop and maintain con- |
|
|
sistent application schemas. An application schema is |
|
|
a conceptual schema or model for geographic data that is |
|
|
required by one or more applications. Consistent applica- |
|
|
tion schemas help in the understanding, the acquisition, |
|
|
the processing, the analysis, the access, the represen- |
|
|
tation, and the exchange of geographic information, in |
|
|
other words in the interoperability. On the one hand, |
|
|
ISO 19109 deÞnes a metamodel called the General Fea- |
|
|
M |
||
ture Model (GFM). The GFM includes all the necessary |
||
elements for the description of features (GF_FeatureType), |
|
|
|
||
their properties (GF_PropertyType, GF_AttributeType, |
|
|
GF_AssociationRole, and GF_Operation), the different |
|
|
types of associations (GF_AssociationType, GF_Ag- |
|
|
gregationType, GF_SpatialAssociationType, and GF_- |
|
|
TemporalAssociationType), generalization/specialization |
|
|
(GF_InheritanceRelation) relationships, and constraints |
|
|
(GF_Constraint). The description of an attribute encom- |
|
|
passes thematic (GF_ThematicAttributeType), location |
|
|
(GF_LocationAttributeType), and temporal attributes |
|
|
(GF_TemporalAttributeType). On the other hand, ISO |
|
|
19109 deÞnes rules to end up with consistent application |
|
|
schemas. These rules explain: |
|
¥The steps to create application schemas
¥The general information of an application schemas (e. g., name and version)
¥The integration of application schemas
¥The use of UML to build application schemas
¥The inclusion of metadata in an application schemas (e. g., quality of the geometry)
¥The use of geometric, topological, and temporal primitives
Figure 9 illustrates an example of an application schema complying with ISO 19109 rules. It shows two feature classes: EX_Road and EX_Bridge. EX_Road has an identifier and a name thematic attribute. The attribute identifier is of the type ID, which is deÞned in the class ID, and the attribute name of the type CharacterString from

712 Modeling with ISO 191xx Standards
Modeling with ISO 191xx Standards, Figure 8 Temporal primitives, topological primitives and complex speciÞed by ISO 19108 [12]
Modeling with ISO 191xx Standards, Figure 9 Road-bridge application schema example
ISO 19103. EX_Road has also two geometric attributes: centerline and surface. The attribute centreline is of the type CenterlineGeometry, which is described in the class CenterlineGgeometry. CenterlineGeometry has an attribute position, which describes the geometry of the road, and an attribute accuracy for the description of the
positional accuracy of the geometry. The class EX_Bridge has a similar attribute arrangement to EX_Road with the addition of the attribute structure that takes its value from the code list EX_BridgeStructure. Finally, EX_Road is linked to EX_Bridge through the Traverse association. In this association, EX_Bridge plays the role structure

Modeling with ISO 191xx Standards |
713 |
in EX_Road and, reciprocally, EX_Road plays the role roadway for EX_Bridge. An instance of EX_Bridge must always be associated to an instance of EX_Road.
Feature Cataloging To describe an application schema completely, it is imperative to provide the semantics of each of its elements: classes, attributes, relationships, and so on. The object of ISO 19110 Methodology for Feature Cataloging is to deÞne a mechanism for the documentation of the semantics of all application schema elements. Basically, the methodology for cataloging features agrees to the GFM discussed in Sect. ÒApplication SchemaÓ. A feature catalog includes a description of itself, feature types, feature property types, feature operations, feature attributes and attribute values, relationships, and association roles. As an example, the feature catalog of the road-bridge example could be depicted as in Table 1.
Spatial Referencing Typically, the representation of a geographic feature position is done according to a coordinate reference system (CRS). In ISO19111 Spatial Referencing by Coordinates [13], a CRS is deÞned as a coordinate system which is related to an object by a datum. For the purpose of geodesy, the object of concern is the Earth and consists in the reference for the geometric depiction of geographic features. ISO19111 provides the mechanism for describing a CRS, which can be either simple or compound. A simple CRS includes a description of the coordinate system (i. e., its axes) and the datum. A compound CRS is an aggregation of two or more simple CRSs. For example, a compound CRS may include a horizontal and a vertical CRS, which both have speciÞc coordinate axes and datum.
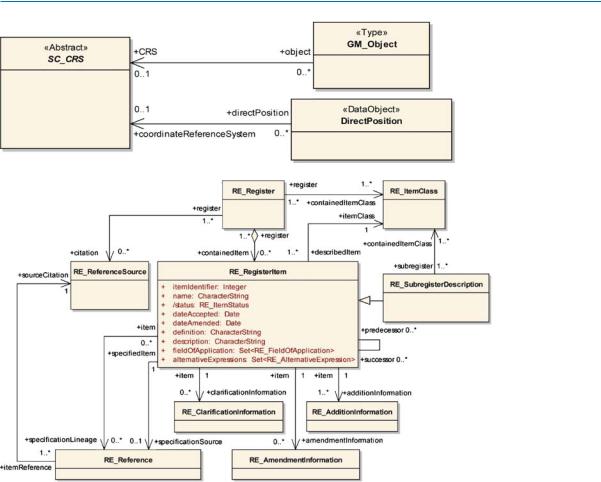
CRS is of interest to conceptual modeling of geographic databases as it provides the description in which the positions of geographic features are known. Accordingly, it is important to note that each geometric object as deÞned in ISO 19107 (primitive, aggregate, or complex) is associated to a CRS and, as such, carries all parameters describing the CRS in which its coordinates are recorded (see Fig. 10).
A geographic feature can also be located by the way of a geographic identiÞer, which provides a geographic reference through a label (e. g., King West street) or a code (e. g., postal code ÒJ1H 1P1Ó). Geographic identiÞers are usually organized in gazetteers, which are dictionaries of geographic identiÞers. ISO 19112 Spatial Referencing by Geographic IdentiÞers [14] speciÞes a mechanism and components to describe geographic references based on geographic identiÞers.
In this standard, a geographic identiÞer is represented by a SI_LocationInstance data type, which can be used in an application schema for documenting the location of
Modeling with ISO 191xx Standards, Table 1 Road-bridge feature catalog example
FC_FeatureCatalogue
¥Name: RoadBridgeExample
¥Scope: Transportation network
¥Field of application: Tracking and routing
¥Version number: 1.0
¥Producer:
ÐName: Jean Brodeur
ÐRole: Custodian
¥Functional language: English (ISO639_2.eng)
¥Feature type: EX_Road, EX_Bridge
FC_FeatureType
¥Name: EX_Bridge
¥DeÞnition: Structure erected along a travelled route to span
a depression or obstacle and ensure the continuity of the road and railway network
¥Code: 2139
¥Abstract: False
¥Feature catalogue: RoadBridgeExample
¥Chracteristics: identiÞer, name, structure, centerline, surface
FC_FeatureAttribute |
|
¥ Name: identiÞer |
M |
|
¥DeÞnition: unique identiÞer of the object
¥Cardinality: 1
¥Code: 2139.2
¥ValueType: ID
FC_FeatureAttribute
¥Name: name
¥DeÞnition: place-name of the feature
¥Cardinality: 1
¥Code: 2139.2
¥ValueType: CharacterString
FC_FeatureAttribute
¥Name: structure
¥DeÞnition: kind of construction
¥Cardinality: 1
¥Code: 2139.3
¥ListedValue: covered, moveable surface, trestle, other
FC_ListedValue
¥Label: covered
¥Code: 1
¥DeÞnition: A bridge that has a building like cover to protect the bridge deck
FC_ListedValue
¥Label: moveable surface
¥Code: 2
¥DeÞnition: A bridge of which section can be moved to allow passage of vessels . . .
714 Modeling with ISO 191xx Standards
Modeling with ISO 191xx Standards, Figure 10 Geometric object relationships with coordinate reference systems (CRSs)
Modeling with ISO 191xx Standards, Figure 11 Geometric object relationships with CRSs
a geographic feature. For example, ÒJ1H 1P1Ó constitutes a SI_LocationInstance from the gazetteer of postal code of Canada and locates the north side of a portion of the King West street in MyCity.
Metadata Metadata, commonly known as data about data, is meaningful information to better understand geographic data elements and data sets. ISO 19115 Metadata [8] sets the content and structure of geographic metadata. It covers topics like identiÞcation, constraints, quality, lineage, maintenance, spatial representation, reference system, content, portrayal, distribution, and application schema. Metadata elements are used to describe data sets and to provide additional information about geographic feature characteristics. For example, the road-bridge application schema illustrated in Sect. ÒApplication SchemaÓ uses an attribute accuracy of DQ_AbsoluteExternalPositionAccuracy type from ISO 19115 in classes CenterlineGeometry and SurfaceGe-
ometry to report the geometric accuracy of road and bridge instances. This data type and others from ISO 19115 can be used to report metadata about different facets of geographic data and therefore to beneÞt conceptual modeling. In addition, ISO 19115 includes the application schema (MD_ApplicationSchemaInformation) and a reference to the feature catalog (MD_ContentInformation) as metadata items for the description of datasets, data collections, or series. This makes the application schema and the feature catalog living components for the use of geographic information to support better understanding of the data but also analysis and reasoning purposes. Consequently, metadata contributes to semantic interoperability of geographic information.
Register According to ISO 19135 Procedures for Item Registration [15], a register consists of a collection of object identiÞers with deÞnitions recorded in a Þle or set of Þles. It establishes the identity of concepts of interest with-

Modeling with ISO 191xx Standards |
715 |
M
Modeling with ISO 191xx Standards, Figure 12 Road-bridge register example
in a namespace for geographic applications and databases. A registry is a complete system to ensure the appropriate management of a register including a register owner, a register manager, and submitting organizations, which sponsor the register.
ISO 19135 establishes the structure of a register (RE_ Register) and the rules for the proper management of registers. A register contains items that exist as components of an item Class (Fig. 11). An item (RE_RegisterItem) is described by an identiÞer, a name, a status, an acceptance date, an amendment date, a deÞnition, a description, a Þeld of application, and a set of alternative expressions. Items may evolve in time and a register allows for maintainance and tracking of modiÞcations.
Registers contribute to geographic database modeling in maintaining semantics of concepts that application schemas, feature catalogs, or geographic databases may reuse and associate to model elements or data. They support conceptsÕ multilingual representation via alternative expressions that are associated with a speciÞc locale (i. e., the language and country identiÞcation). Figure 12 illustrates a register of the road-bridge example that shows EX_Bridge as a contained item of the register with EX_Pont as an alternative expression in French.
Key Applications
The importance of spatial database modeling based on the ISO191xx suite of standards lies mostly in increasing interoperability of geographic information. Geographic data described in a common structure using the same data types facilitates their access, understanding, integration, and use through SDIs. It is easier for users to Þnd and get geographic data that Þt their application when, for example, they are published on a web portal such as the CGDI Discovery portal in Canada (http://geodiscover.cgdi.ca/gdp/) or Geospatial One Stop in the US (http://gos2.geodata.gov/ wps/portal/gos) using these standards where all the information is described and presented similarly. From a user point of view, it supports applications such as disaster management, global warming, sustainable development, trafÞc management, etc. which typically need to integrate data from different sources, themes, levels of details, such as road, drainage, railways, satellite images, relief and so on.
Future Directions
The contribution of standard-based geographic data modeling to interoperability of geographic information and the contribution of international standards in geographic infor-

716 Modeling with Pictogrammic Languages
mation to geographic data modeling has been explained in this chapter.
Standards in geographic information play an important role in geographic data modeling. As noted here, a number of standards provide data types for the representation of geographic information. These data types include basic types, such as numbers, texts, and dates, geometric types (e. g., point, line and surface), temporal types (e. g., instant and period), etc. This is the case for ISO/TS 19103 (conceptual schema language), ISO 19107 (spatial schema), and ISO 19108 (temporal schema). Other standards provide data types for the description of ancillary information. This is the case for ISO 19111 (spatial referencing by coordinates), ISO 19112 (spatial referencing by geographic identiÞers), ISO 19115 (metadata), and ISO 19131 (data product speciÞcations). Finally, there are standards that concern the elaboration of geographic data models. These standards provide structures and rules for the elaboration of application schemas and documentation of concepts. This is the case for ISO 19109 (rules for application schema), ISO 19110 (methodology for feature cataloging), and ISO 19135 (procedures for item registration).
Additionally, standards in geographic information bring a common domain ontology, which describes a set of concepts that are needed for the overall aspects of geographic information. This sets the foundation for the Semantic Web in the geographic information realm. Some open frameworks like GeOxygene [16] are already available to help in the interoperable development and deployment of geospatial applications over the internet.
Cross References
Geospatial Semantic Web, Interoperability
Metadata and Interoperability, Geospatial
Modeling with Pictogrammic Languages
OGCÕs Open Standards for Geospatial Interoperability
Vector Data
Recommended Reading
1.ISO/TC211: ISO19109:2005 Geographic InformationÑRules for Application Schema. ISO, Geneva, Switzerland (2005)
2.Brodeur, J., BŽdard, Y., Proulx, M.J.: Modeling geospatial application databases using UML-based repositories aligned with international standards in geomatics. In: Proceedings of the 8th ACM Symposium on Advances in Geographic Information Systems (ACMGIS), Washington, D.C., USA, 6Ð11 Nov 2000
3.ISO/TC211: ISO19110:2005 Geographic InformationÑ Methodology for Feature Cataloguing. ISO, Geneva, Switzerland (2005)
4.ISO/TC211 (2007) Geographic information/geomatics homepage. http://www.isotc211.org/. Accessed 2 Sept 2007
5.OGC (2007) Open Geospatial Consortium homepage. http:// www.opengeospatial.org/. Accessed 2 Sept 2007
6.Institute of Electrical and Electronics Engineers: IEEE Standard Computer Dictionary: A Compilation of IEEE Standard Computer Glossaries. IEEE Computer Society, USA (1990)
7.Brodeur, J., BŽdard, Y., Edwards, G., Moulin, B.: Revisiting the concept of geospatial data interoperability within the scope of a human communication process. Trans. GIS 7, 243Ð265 (2003)
8.ISO/TC211: ISO19115:2003 Geographic InformationÑMetadata. ISO, Geneva, Switzerland (2003)
9.ISO/TC211: ISO/TS19103:2005 Geographic InformationÑ Conceptual Schema Language. ISO, Geneva, Switzerland (2005)
10.Object Management Group: UniÞed Modeling Language: Superstructure, v2.0. OMG, Needham, MA, USA (2005)
11.ISO/TC211: ISO19107:2003 Geographic InformationÑSpatial Schema. ISO, Geneva, Switzerland (2003)
12.ISO/TC211: ISO19108:2002 Geographic InformationÑTemporal Schema. ISO, Geneva, Switzerland (2002)
13.ISO/TC211: ISO19111:2002 Geographic InformationÑSpatial Referencing by Coordinates. ISO, Geneva, Switzerland (2002)
14.ISO/TC211: ISO19112:2003 Geographic InformationÑSpatial Referencing by Geographic IdentiÞer. ISO, Geneva, Switzerland (2003)
15.ISO/TC211: ISO19135 Geographic InformationÑProcedures for Item Registration. ISO, Geneva, Switzerland (2005)
16.Badard, T., Braun, A.: OXYGENE: A platform for the development of interoperable geographic applications and web services. In: Proceedings of the 15th International Workshop on Database and Expert Systems Applications (DEXAÕ04), Zaragoza, Spain, 30 AugÐ3 Sept 2004
Modeling with Pictogrammic Languages
YVAN BƒDARD, SUZIE LARRIVƒE
Dept of Geomatics Sciences, Centre for Research in Geomatics, Canada NSERC Industrial Research Chair in Geospatial Databases for Decision Support, Laval University, Quebec City, QC, Canada
Synonyms
Spatial modeling language extension; Spatio-temporal modeling language extension; Perceptory pictograms
Definition
ÒSpatial databasesÓ consist of large groups of data structured in a way to represent the geographic features of interest to the users of a system. Spatial database models are schematic representations of these data. Database models are created to design and document the system, to facilitate communication and to support programming. They are created using CASE tools (computer-assisted software engineering). CASE tools support schema drawing, dictionaries and code generation. Database schemas are typically represented with a graphical language such as

Modeling with Pictogrammic Languages |
717 |
UML (UniÞed Modeling Language; see http://www.uml. org and [11]).
ÒDatabase modelsÓ can represent (1) usersÕ real-life views of the data of interest, (2) developersÕ views of the potential organization of these data for a family of technologies, or (3) their Þnal implementation on a speciÞc platform. For example, in the standard Model-Driven Architecture (MDA) method (http://www.omg.org/mda/), these three models represent three levels of abstraction and are respectively called CIM (computation-independent model), PIM (platform-independent model) and PSM (plat- form-speciÞc model). In other methods, they may be called conceptual, logical and physical models as well as analysis, design and implementation models.
ÒPictogramsÓ are symbols aimed at facilitating modeling. Different sets of pictograms have been proposed. This chapter presents those used by the CASE tool Perceptory (http://sirs.scg.ulaval.ca/perceptory) since they are the most widely used, they were designed to allow developers to keep their method, and they were thoroughly tested as implementations of UML stereotypes. In Perceptory, they aim at hiding the complexity of geometric primitives in CIM and PIM models. They can serve other purposes as well and have been implemented in other CASE tools [14].
Historical Background
In the Þeld of GIS, pictograms were Þrst proposed in 1989 by Bedard and Paquette [6] to simplify how Entity-Rela- tionship (E/R) models depicted the geometry of cartographic features. It was then called ÒSub-Model SubstitutionÓ technique as the main goal was to remove from the spatial database model those geometric primitives with their data elements and relationship (considered of no interest to the user) and to replace them by simple symbols showing only the information of interest to the users (i. e. the featuresÕ shape). This Þrst solution was tested in several projects and enhanced over time to lead to the development of Modul-R [4,5,7], the Þrst spatio-temporal- ly extended E/R which led to Orion, the Þrst GIS-compat- ible CASE tool in 1992 [5]. This Þrst solution has inßuenced several researchers afterwards. Examples of methods or tools using pictograms for spatial databases include Perceptory [1,3] which is used in over 30 countries, Software Development Process Model with Objecteering [14], MADS [17], CONGOO [16], UML-Geoframe with ArgoCASEGEO [10], and STER [19].
In 1996, Modul-R pictograms were revisited to integrate three paradigms: object-orientation (OO), plug-in (module, blade, cartridge) and a pragmatic symbiotic approach [3]. Object-orientation allowed for more expressive power and was Þrst tested with UML in its pre-release
days. The plug-in approach led to deÞne the pictograms and their syntax as a module, i. e. a specialized language designed to extend standard languages (e. g. UML, E/R, English). This allowed for enriching oneÕs modeling language and tool rather than requiring to adopt new ones. For instance, in addition to Perceptory, these pictograms have been used with commercial and open-source CASE tools such as Oracle Designer, Objecteering and others while being also used to describe spatial integrity constraints, to compare database semantics and to improve software user-interfaces. With regards to the symbiotic approach, it came from cognitive studies and pragmatics lessons resulting from several projects with practitioners, including very complex ones. It helped to Þnd a better balance between human abilities, language requirements, database design methods and commercial software constraints. Practical projects clearly indicated the need to better support unexpected complex situations, to simplify the pictograms along with their syntax, and to better balance the content of the graphical schema with the ontological content of the dictionary (i. e. simpler schemas, increased use of natural and formal languages in the dictionary). This was a departure from the trend of that period
to rely increasingly on graphical depictions. Such novel M approach and the arrival of UML led to developing Perceptory. This approach also goes beyond the leading ten-
dency to perceive ÒmodelingÓ solely as a schema-building exercise since in fact it is not; a schema without clear and complete semantics is meaningless and its robustness cannot be validated. Accordingly, good spatial database modeling becomes an ontological exercise. For example, Perceptory provides specialized spatial and temporal sections in its dictionary (as can be added to other CASE tools). In the remaining of this chapter are presented the scientiÞc fundamentals of modeling spatial databases with pictograms, using examples from the UML-based Perceptory CASE tool.
Scientific Fundamentals
ÒPictogramsÓ aim at supporting the expression of any featureÕs spatial and spatio-temporal properties into a consistent manner that is compatible with various human-oriented languages (ex. UML, Entity-Relationship, English, French).
ÒSyntax rulesÓ dictate the way to combine and position pictograms in a model or document. These rules also dictate how to use special characters (0Ð9 N ,). Properly combining pictograms, with or without characters, makes it possible to express complex cases of geometry and spa- tio-temporality, namely: facultative, mandatory, alternate, aggregate, multiple, and derived.
718 |
Modeling with Pictogrammic Languages |
|
Modeling with Pictogrammic Languages, Table 1 Simple pictogram- |
Modeling with Pictogrammic Languages, Table 2 Simple pictogram- |
|
mic expression for geometry |
mic expressions for temporality |
|
2D space |
3D space |
Examples of cases |
||
0D geometry |
|
|
|
hydrants when they are |
|
|
|
|
all represented by points |
1D geometry |
|
|
|
road segments when |
|
|
|
||
|
|
|
|
they are all represented |
|
|
|
|
by lines |
|
|
|
|
electric poles when they |
|
|
|
|
|
|
|
|
|
are all represented by |
|
|
|
|
vertical lines |
2D geometry |
|
|
|
lakes when they are all |
|
|
|
|
represented by polygons |
|
|
|
|
walls when they are all |
|
|
|
|
|
|
|
|
|
represented by vertical |
|
|
|
|
plans |
3D geometry |
|
|
|
buildings when they are |
|
|
|
||
|
|
|
|
all represented by solids |
|
|
|
|
|
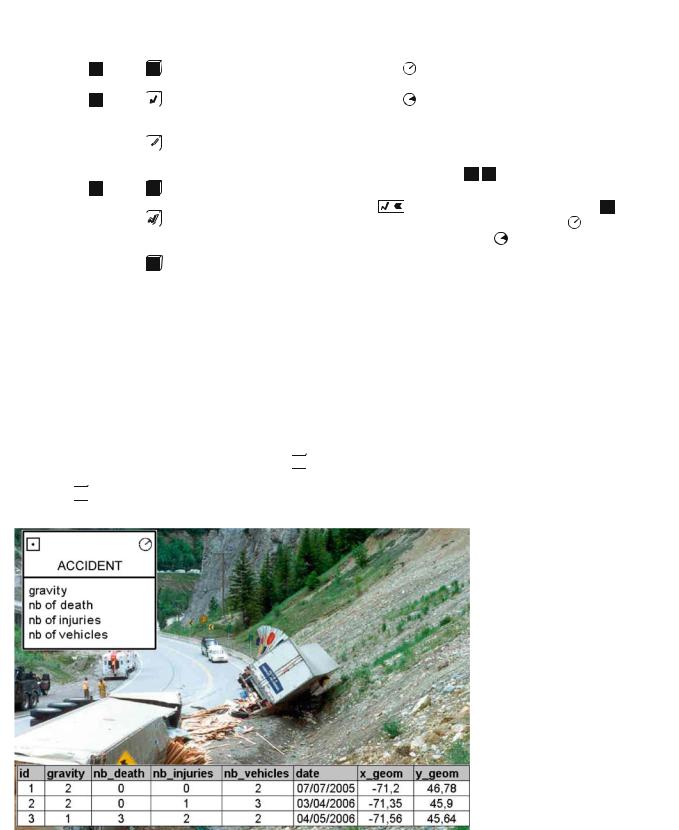
A Òpictogrammic expressionÓ includes one or several pictograms which are positioned in a precise manner with pertinent digits according to a syntax. Such a pictogrammic expression completely describes the spatial, temporal or spatio-temporal properties of either (1) a feature, (2) where and when an attribute value is valid within an object geometry or existence, or of (3) a relationship between features. For example, in Perceptory, the simple expression  is made of only one pictogram and represents a simple 1D geometry in a 2D universe. Similarly, the expression
  represents the same geometry in a 3D universe while the expression
  adds thickness to this geometry. On the
|
Examples of cases |
0D temporality |
Existence of accidents; trafÞc ßow of a road |
|
segment |
1D temporality |
Existence of a building; duration of its |
|
commercial use; duration of its ownership |
|
by a given person |
|
|
other hand, the expression (i. e. 1D OR 2D) has a different meaning from the previous ones and from the
expression |
(i. e. 1D + 2D) or from the expression |
||
0,N. In a similar manner, the simple expression |
repre- |
||
sents one instant, the expression |
represents one peri- |
||
od of time. More complex temporal and spatio-temporal expressions can be made.
Grouping pictograms and syntactic rules commonly used together allows one to form a specialized graphical language called ÒPVLÓ (Plug-in for Visual Languages). A PVL, as introduced in [3], allows extending a modeling language with a tested method that is compatible with other PVLs if needed. For example, one may decide to use only a small group of Perceptory pictograms to make a 2D spatial PVL (i. e. a language to depict plane geometries of geographic features) while later on, if needed, use additional Perceptory pictograms to have a 3D spatio-tempo- ral PVL. A pictogrammic expression is sometimes called a PVL expression.
The pictograms high level of abstraction facilitates the making of database models, reports, speciÞcations, spatio-
Modeling with Pictogrammic Languages, Figure 1 Example of simple pictogrammic expressions for the geometry and existence of a UML object class Accident
Modeling with Pictogrammic Languages |
719 |
temporal integrity constraints, user interfaces, and similar tasks of a system development workßow. They hide the complexity inherent to the description of geometric and temporal primitives and relationships as well as implementation and standard-related issues. In particular, they facilitate the building, editing, communication and validation of spatio-temporal database models as well as their translation into efÞcient data structures. In spite of such translation rules, the PVL are independent from commercial software and numerous standards.
The pictograms were Þrst created for spatial database modeling and are best described in such a context. Accord-
Modeling with Pictogrammic Languages, Table 3 Syntax for advanced 2D and 3D spatial pictogrammic expressions
Geometry |
Examples |
Examples of cases |
|
of syntax |
|
Aggregate geometry |
|
|
(complex) |
|
Hydrographic networks |
|
|
composed of 1D rivers and 2D |
|
|
lakes (i. e. aggregate of |
|
|
different geometries) |
(simple) |
1,N |
Some municipalities may |
|
|
include several 2D geometries |
|
|
such as islands (i. e. aggregate |
|
|
of similar geometries) |
Alternate geometry |
|
Buildings having a 0D shape if |
(on same line) |
|
area < 1 hectare OR a 2D |
|
|
shape if area > 1 hectare |
|
|
(Exclusive OR) |
Facultative |
0,1 |
Buildings in database may have |
geometry |
|
no geometry if area < 0.2 |
|
|
hectare, or a 0D shape if area |
|
|
> 0.2 hectare |
Multiple geometry |
|
Every municipality has a 2D |
(on different lines) |
|
shape AND a OD location (ex. |
|
|
downtown). See [1] for detailed |
|
|
examples. |
|
|
|
N.B. same syntax for 2D and 3D pictograms
ingly, the present chapter describes the pictograms implemented as UML stereotypes in Perceptory object class model. In such a context, the PVL allows the analyst or designer to describe the spatial and temporal properties of the elements depicted in an object class schema. Perceptory pictograms support 0D, 1D, 2D and 3D geometries for objects located in 2D or 3D universes (see Table 1). Supported temporalities are 0D (instant) and 1D (period) (see Table 2). Supported combinations are simple, complex (aggregate), alternate (exclusive OR), multiple (AND), spatio-temporal and hybrid (combinations of any of the above) (see Tables 3, 4 and 5). Supported minimum multiplicities include facultative (0), mandatory (1), speciÞc number, and many (N), while maximum multiplicities include the three latter. Special cases are Òany possibilityÓ, Ònot yet deÞnedÓ and ÒcomplicatedÓ, the latter pointing to a textual description in the repository (when easier to read). All geometries and temporalities can be indicated
M
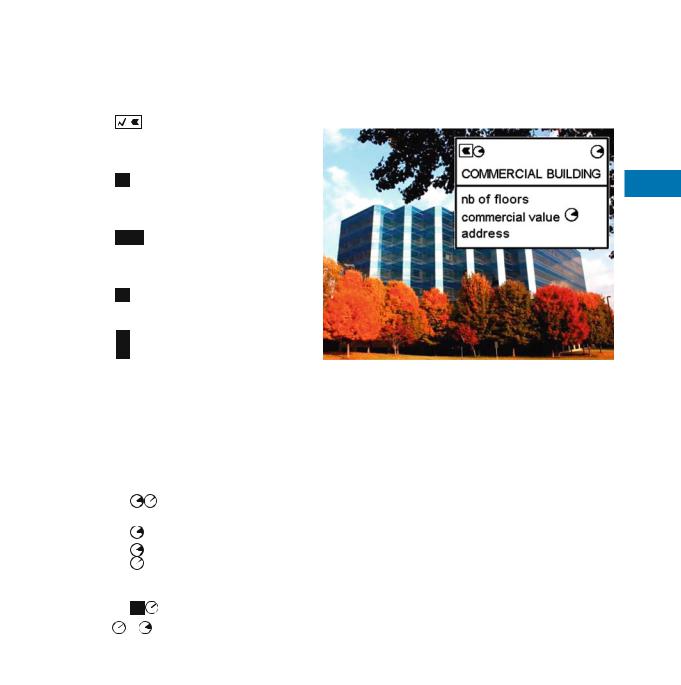
Modeling with Pictogrammic Languages, Figure 2 Example of a spatio temporal pictogrammic expression, a temporal expression for the existence of the UML object class and of another one to keep track of the evolution of one attribute
Modeling with Pictogrammic Languages, Table 4 Syntax for advanced temporal and spatio-temporal pictogrammic expressions
Temporality |
Examples |
Examples of cases for feature existence and states |
||
|
of syntax |
|
||
Alternate temporality |
|
|
|
Forest Þres lasting several days OR 1 day (if temporal resolution is 1 day); water level data varying |
(on same line) |
|
|
|
continuously when opening/closing the dam OR remaining stable for a period once a level is reached |
Facultative temporality |
|
0,1 |
Houses in database may need NO construction and demolition dates IF area < 0.2 hectare |
|
Multiple temporality |
|
|
|
Hurricane existence deÞned by a date of beginning and a duration for some purposes, AND by a unique |
(on different lines) |
|
|
|
date of maximum peek for other purposes. Buildings commercial value considered stable for the whole |
|
|
|
|
year for tax purposes but as being valid only the day when the building was assessed for market analysis |
|
|
|
|
purposes. |
Spatio-temporality |
|
|
|
Position of a moving vehicle. The temporal pictogram affects the spatial pictogram on its left |
N.B. Selecting between |
or |
|
depends on the temporal granularity deÞned into the repository for each class, attribute and geometry. |
|
720 |
Modeling with Pictogrammic Languages |
||||||
Modeling with Pictogrammic Languages, Table 5 |
Syntax and pictograms for special cases |
||||||
|
|
|
|
|
|
|
|
Derived geometry or |
|
|
|
|
|
Municipality centroids derived from their polygons; 3D buildings derived from 2D buildings with |
|
temporality Òitalic |
|
|
|
|
|
number of ßoors; duration of commercial use derived from permits |
|
pictogramÓ |
|
|
|
|
|
|
|
Hybrid expression (combi- |
|
|
1,N |
A set of individual cyclists continuously moving during a race or forming a group that changes its |
|||
nation of any pictos above) |
|
|
|
|
|
size during the race |
|
|
|
|
|
|
|
||
Default multiplicity |
If no multiplicity is written immediately after a pictogram, the 1,1 multiplicity is implied |
||||||
Any possibility |
|
|
|
|
|
Òwildcard pictogramÓ meaning no predeÞned shape or temporality, and no restriction on the |
|
|
|
|
|
|
|
|
geometry or temporality |
Complicated |
|
|
|
|
|
Better explained textually in the dictionary than using a complicated PVL expression in |
|
|
|
|
|
|
|
|
a schema. Replaces a long hybrid expression if desired. |
Not yet deÞned |
|
|
|
|
|
During the process of designing a database, one may anticipate a need for geometry or |
|
|
|
|
|
|
|
|
temporality, but ignore which one and will replace it later by a regular pictogram |
|
|
|
|
|
|
|
|
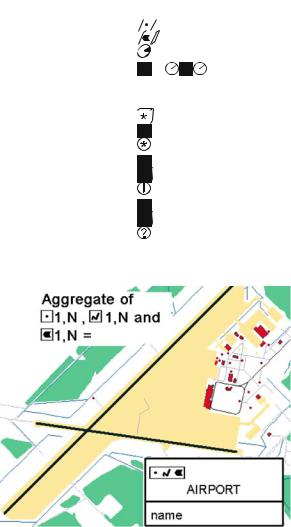
Modeling with Pictogrammic Languages, Figure 3 Example of a complex aggregate geometry for Airport object class, that is an aggregate of points, lines ans polygons (Data from minist•re des Ressources naturelles et de la faune du QuŽbec)
as ÒmeasuredÓ or Òderived from other attributes, objects, relationship using calculations, spatial or temporal analysisÓ. Having no geometry or temporality is also accepted. Pictogrammic expressions may describe object classes, association classes, attributes, and may be used within operations.
Examples of the use of pictogrammic expressions for UML object classes are presented hereafter. Figure 1 describes an accident as a an instantaneous event with a geometry deÞned as a point. Figure 2 shows a case where users want to keep information about the existence of commercial buildings (dates of construction and destruction),
about the evolution of their commercial value (attribute data with their period of validity) and about the evolution of its polygonal representation if it is enlarged or modiÞed. Figure 3 illustrates a case of aggregated complex geometry while Fig. 4 shows cases of simple and of alternate geometries. At last, Fig. 5 shows a case of multiple geometry where the Þrst pictogram expresses the fact that every building is represented by simple polygon at large scales and the second line of pictograms indicates that some (but not all) buildings may have a second geometry, either a point or a line, depending on their size, for small scale maps (usually to properly place symbolic representations). See [2] for more details.
From a UML point of view, these pictogrammic expressions are implemented as stereotypes (a formal way of extending UML) and are built on-the-ßy in Perceptory. Using such pictogrammic expressions has also proved to be useful to model spatial multidimensional databases (or datacubes) as used in spatial data warehousing and SOLAP (Spatial On-Line Analytical Processing). These datacubes
pictogrammic expressions include datacube  , data
dimension  , member
  , measure
  and are compatible with the previous spatial and temporal pictograms. They are all supported by Perceptory.
Key Applications
Pictogrammic languages, if sufÞciently expressive and usable, can serve several purposes. The following paragraphs further describe the primary key application, i. e. spatial database modeling, plus other applications of interest.