

Quantum Chemistry of Solids / 23-Modeling and LCAO Calculations of Point Defects in Crystals
.pdf10.3 Point Defects in Perovskites |
449 |
Table 10.15. E ective charges q of ions obtained in the HF band-structure calculations with a Monkhorst–Pack k-set 6 ×6 ×6 and di erent cyclic clusters modeling perfect and defective SrTiO3. The lengths in the first column are lattice constants of the relevant supercells the distances R given above the e ective charges are calculated with respect to the supercell coordinate origin where the Fe ion is placed
˚ |
0.00 |
1.95 |
3.38 |
3.90 |
4.37 |
5.52 |
5.86 |
6.48 |
6.76 |
7.04 |
7.81 |
R (A) |
|||||||||||
˚ |
q(Fe) |
q(O) |
q(Sr) |
q(Ti) |
q(O) |
q(Ti) |
q(O) |
q(Sr) |
q(Ti) |
q(O) |
q(Ti) |
Lattice const.(A) |
|||||||||||
3.90 (band struct.) |
|
–1.458 |
1.837 |
2.538 |
|
|
|
|
|
|
|
15.62 (S64) |
|
–1.459 |
1.837 |
2.540 |
–1.459 |
2.540 |
–1.459 |
1.837 |
2.540 |
–1.459 |
2.540 |
(perfect cryst.) |
|
||||||||||
|
|
|
|
|
|
|
|
|
|
|
|
7.81 (S8) |
2.583 |
–1.464 |
1.835 |
2.406 |
|
|
|
|
|
|
|
11.04 (S16) |
2.571 |
–1.464 |
1.840 |
2.536 |
–1.460 |
2.543 |
|
|
|
|
|
13.53 (S32) |
2.570 |
–1.464 |
1.838 |
2.534 |
–1.458 |
2.540 |
–1.459 |
1.837 |
2.540 |
|
|
15.62 (S64) |
2.570 |
–1.463 |
1.838 |
2.534 |
–1.458 |
2.540 |
–1.459 |
1.837 |
2.540 |
–1.459 |
2.539 |
cluster, the e ective charges of atoms close to its boundary are the same as in the perfect crystal. This confirms that the chosen cyclic cluster is large enough.
The S32-UHF supercell calculations for the zero-spin and high-spin (S=2) states show that the latter is much lower in energy (by 5.4 eV) (after lattice relaxation). In the perovskite crystalline field a fivefold degenerate Fe 3d state splits into eg and t2g states (see Fig. 10.6) separated by 2.1 eV (for an undistorted lattice).
Fig. 10.6. (a) Schematic view of the Fe impurity with asymmetric eg relaxation of the six nearest O atoms. (b) The relevant energy levels before and after relaxation
In the high spin state with S=2 the upper level is occupied by one α electron and three other α electrons occupy t2g states. As is well known in this case an Eg eg Jahn–Teller e ect takes place. This means that an orbital degeneracy is lifted by an asymmetrical displacement of six O ions, as shown in Fig. 10.6: four equatorial O

450 10 Modeling and LCAO Calculations of Point Defects in Crystals
atoms lying in the xy-plane relax towards the impurity, whereas the two other O atoms relax outwards along the z axis. This results in two nondegenerate levels close to the valence-band top: the eg level at 0.5 eV above the band edge, and a virtual nondegenerate b2g level lying much higher (Table 10.16).
Table 10.16. Positions of one-electron Fe levels (in eV) with respect to the valence-band top calculated by means of HF method for S16 (80 atoms) and S32 (160 atoms) cyclic clusters with and without lattice relaxation
Cyclic |
Before relaxation |
After relaxation |
|||||
cluster |
|||||||
|
|
|
|
|
|
||
|
t2g |
eg |
a1g |
b1g |
eg |
b2g |
|
80 atoms |
0.36 |
2.31 |
0.02 |
0.03 |
0.5 |
5.4 |
|
160 atoms |
0.25 |
2.50 |
0.02 |
0.05 |
0.5 |
5.0 |
|
If we assume that x, y, z displacements have equal magnitudes, pure HF and HF-PWGGA calculations with the “standard” basis set give practically the same magnitude of the six O displacements δ =0.04 ˚A, a quite flat minimum and an energy gain of 1.40 eV. This means that we have a combination of the Jahn–Teller and breathing modes of surrounding O-atom dsplacements. With the optimized basis set a slightly smaller energy gain 1.33 eV was obtained. It was checked also whether the magnitudes of the O-atom displacements along the x, y and the z axes could be different and indeed a small additional energy gain, down to 1.42 eV for the following asymmetrical dispacements in the latter case was found: 0.028 ˚A along the x,y axis and –0.052 ˚A along the z axis, i.e. outward displacements of two O atoms are twice larger than those for four equatorial O atoms. Note that UHF calculation e ectively incorporates the spin-dependent electron-correlation e ects during the self-consistent loops and thus gives nearly the same results as HF with a posteriori (nonself-consistent) corrections for electron correlations. The total valence of the iron impurity VFe=3.3 correlates much better with the Fe4+ model than with the calculated Mulliken effective charge of +2.59. These e ective charges q of atoms collected in Table 10.17 demonstrate considerable covalency e ects, well known for ABO3 perovskites.
Table 10.17. The e ective Mulliken charges of atoms q and bond orders W (in e) for S32 HF cyclic cluster with unrelaxed and relaxed lattices
SrTiO3 q(Ti) q(Ox,y ) q(Oz ) W (Ti–Ox) W (Ti–Oz )
Pure 2.540 –1.459 –1.459 0.375 |
0.375 |
Fe-doped q(Fe) q(Ox,y ) q(Oz ) W (Fe–Ox) W (Fe–Oz )
Unrelaxed 2.570 |
–1.464 |
–1.464 |
0.164 |
0.164 |
Relaxed 2.594 |
–1.440 |
–1.534 |
0.235 |
0.154 |

10.3 Point Defects in Perovskites |
451 |
In particular, in pure SrTiO3 the e ective charges are q(Ti)=+2.54, q(Sr)=+1.84, and q(O)=–1.46. The Ti–O bond order in a pure crystal is 0.375. When the two O atoms are displaced outwards from the Fe impurity along the z axis and thus approach the nearest Ti atoms, the Ti–O bond order increases to 0.489. The combination of a large lattice relaxation energy and relatively small O displacements is not surprising in the light of a considerable covalent bonding between the unpaired iron electrons occupying Fe 3d orbitals and 2p orbitals of four equatorial oxygen ions: the Fe–Ox,y bond orders (Table 10.17) increase upon mutual approach of these atoms from 0.164 to 0.235.
Fig. 10.7. (a) The electronic-density plots for the (010) cross section of Fe and nearest ions in SrTiO3 as calculated by means of the HF method for the cyclic cluster of 160 atoms. Isodensity curves are drawn from 20.8 to 0.8 e a.u.−3 with an increment of 0.0022 e a.u.−3, b) the same as (a) for the (001) section, (c) the same for the (110) section. Left panels are HF di erence electron densities, right panels are spin densities.
Analysis of the total electron-density and spin-density distribution (Fig. 10.7) shows that in the HF calculation four unpaired electrons are well localized on the Fe ion.
Lastly, a comparison of the band structures for the cyclic cluster containing the Fe impurity with that for a pure crystal clearly demonstrates that the Fe impurity induces additional energy levels below the valence band (in the region around –20 eV) and above the valence band, at around –2 eV. These bands have practically no dispersion over the BZ, which demonstrates that the defect is almost isolated from its periodic images.
Any method is not completely universal, and the approach described also has its limitations. In particular, it does not work when incorporation of the lattice relaxation qualitatively changes the electron localization (e.g. , for free electron and hole polarons). On the other hand, it could be very e cient for many impurities in insulators characterized by high symmetry and when calculating forces is computationally expensive.
452 10 Modeling and LCAO Calculations of Point Defects in Crystals
It was demonstrated that the size of the cyclic cluster large enough for a correct reproduction of the perfect crystal depends on the particular quantum-mechanical method; for SrTiO3 this means 80-atom cyclic clusters for the HF but 320 atoms for the DFT-PWGGA. In the HF defect calculations for the single Fe+ impurity the cyclic cluster should not be smaller than 160 atoms. This is in contrast with many previous supercell calculations on perovskites where supercells as small as S8 were used without convergence analysis.
It was already mentioned in Chap. 9 that the HF method typically overestimates the optical gap, whereas DFT underestimates it. This can a ect the electronic-density distribution (chemical-bond covalency) and defect-level positions within the gap (even determined with respect to the valence-band top). In this respect, the hybrid HFDFT methods widely used in the molecular chemistry, e.g. , B3LYP, seem to be more promising tools.
The calculations [680] have demonstrated the strong covalent bonding between unpaired electrons of Fe impurity and four nearest O ions relaxed towards an impurity. The positions of Fe energy levels in a SrTiO3 gap are very sensitive to the lattice relaxation that was neglected in previous studies. The predicted positions of the Fe energy levels with respect to the valence-band top could be checked by means of UPS spectroscopy whereas the local lattice relaxation around iron and its spin state was checked by means of EXAFS. The results of the calculations under consideration are important since the single Fe4+ ions were not detected by ESR (only Fe4+-O vacancy complexes were experimentally studied) and their optical absorption bands at 2.1 and 2.8 eV [749] are tentative. Note that the high-spin state of Fe4+ impurity predicted in ab-initio calculations contradicts previous semiempirical and nonself-consistent calculations (Xα − FeO6 cluster calculation [742] and tight-binding calculation [743]).On the other hand, a high spin state is indirectly supported by its observation for host Fe ions in SrFeO3 perovskite.
We conclude this chapter by discussion of the supercell use for the solid-solution modeling. In this case the supercells of di erent size allow di erent percentages of doping in solid solution to be modeled.
10.3.3 Modeling of Solid Solutions of LacSr1−cMnO3
One of the extensively studied perovskite-type materials, LacSr1−cMnO3 (LSM), is of special interest due to numerous applications, particularly as the cathode for solid oxide fuel cells [750].
LSM was investigated both theoretically [751, 752] and experimentally [753] with a focus on the chemical-bonding nature, magnetic properties, metal–insulator transitions, structural transformations and surface properties.
Numerous e orts were undertaken to study the phase transformations and phase stability in LSM in a wide range of solid solutions. These materials exhibit a complicated dependence of the properties on the concentration of the Sr dopant and oxygen nonstoichiometry. Nowadays, it is well recognized that the dielectric, piezoelectric and other LSM properties are entirely related to the phase equilibrium and the phase separation that occurs under di erent thermodynamic conditions.
In what follows we discuss the results of ab-initio supercell studies of the relative stability of di erent LSM phases [754]. To perform the ab-initio calculations the program packages WIEN-2k [378] and CRYSTAL-03 [23] were used.
10.3 Point Defects in Perovskites |
453 |
The spin-polarized DFT FPLAPW and LCAO electronic and atomic-structure calculations [754] use the exchange-correlation PBE functional.
The basis set of augmented plane waves combined with local orbitals (APW+lo) is used in the WIEN-2k code for solving the Kohn–Sham equations. In this method the unit-cell volume is divided into two regions: (I) nonoverlapping atomic spheres centered at the atomic sites and (II) an interstitial region. In the two types of regions di erent basis sets are used. Inside atomic sphere i of radius Ri, where electrons behave as they were in a free atom, a linear combination of radial functions times spherical harmonics is used. In the interstitial region between these atomic spheres, where the electrons are more or less “free,” a plane-wave expansion is used. On the sphere boundary the wavefunctions of both regions are matched by a value. The APW+lo basis set has a significantly smaller size than the basis set in the LAPW method and thus the computational time is drastically reduced. Nevertheless, these two schemes converge practically to identical results. The convergence of the method is controlled by a cuto parameter RmtKmax, where Rmt is the smallest atomic sphere radius in the unit cell and Kmax is the magnitude of the largest k-vector in the reciprocal space. To improve the convergence of the calculations it is necessary to increase this product. A reasonably large Rmt can significantly reduce the computational time. A value of Rmt =1.7 a.u. was chosen and a plane-wave cuto RmtKmax = 9.
The calculations [754] are performed for the high-temperature cubic phase of LaMnO3 (LMO)-based crystals doped with Sr, substituting for La atoms in di erent fractions. This substitution results in a charge-compensating hole formation. The formation of other defects like oxygen or metal vacancies is neglected.
To model the LaMnO3 doped by Sr (LSM), a 2 × 2 × 2 supercell is used, which consists of eight primitive unit cells and thus contains 40 atoms. The WIEN-2k code generates the k-mesh in the irreducible wedge of the Brillouin zone (BZ) on a specialpoint grid that is used in a modified tetrahedron integration scheme (500 k-points were used). The accuracy in total-energy calculations was 10−4 Ry. Di erent configurations of Sr atoms substituting for La atoms allow ordered LSM solid solutions to be modeled. In particular, La0.875Sr0.125MnO3 is typically used in fuel cells and thus is the subject of detailed thermodynamic study. The calculations are carried out for the ferromagnetic spin alignment (all Mn spins in the supercells are oriented in parallel), which results in a metallic character of the resistivity [753]. However, the resistivity of this phase is larger by three orders of magnitude than that of a typical metal. This is confirmed by FP LAPW band-structure calculations: a very small density of states (DOS) in the vicinity of the Fermi level is observed. The model used is in agreement with the calculations [752] where the ferromagnetic state was revealed for layers of a cubic La0.7Sr0.3MnO3.
In [754] DFT B3LYP LCAO calculations for LacSr(1−c)MnO3 mixed crystals (c =0, 0.125, 0.5, 1.0) were performed, see Fig. 10.8. La, Sr and Mn core electrons were described by Hay–Wadt small-core (HWSC) pseudopotentials [483]. For the oxygen atoms an all-electron 8-411(1d)G basis was taken from previous MnO calculations [628], performed with basis-set (BS) optimization. For La, Mn and Sr ions BSs 411(1d)G, 411(311d)G and 311(1d)G were taken from La2CuO4 [755] calculations, the CRYSTAL web site [23] and SrTiO3 calculations [606], respectively.
To achieve a high numerical accuracy in the lattice and in the BZ summations, the cuto threshold parameters of the CRYSTAL03 code for Coulomb and exchange
454 10 Modeling and LCAO Calculations of Point Defects in Crystals
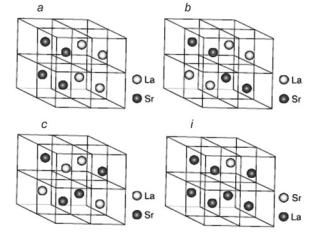
Fig. 10.8. Four structures used in calculations of LacSr1−cMnO3
integrals evaluation to 7, 7, 7, 7 and 14, respectively, were taken. The integration over the BZ has been carried out on the Monkhorst–Pack grid of shrinking factor 8 (its increase up to 16 gave only a small change in the total energy per unit cell). The self-consistent procedure was considered as converged when the total energy in the two successive steps di ers by less than 10−6 a.u.
As the first step, B3LYP spin-polarized LCAO calculations for the cubic LaMnO3 and SrMnO3 (with one formula unit per primitive cell) are performed, using the maximal spin projection Sz = 2 for four d-electrons of the Mn3+ ion. As we have seen in Chap. 9, such a spin projection ensures the lowest total energy compared with Sz = 0, 1. The optimized cubic lattice constants are a=3.967 ˚A and a=3.840 ˚A for LaMnO3 and SrMnO3, respectively. These values are in a reasonable agreement with the experimental lattice constants a=3.947 ˚A and a=3.846 ˚A, respectively. The two optimized cubic lattice constants for LaMnO3 and SrMnO3 were used for calculating the lattice constants of their solid solutions according to Vegard’s law (linear dependence of the lattice parameters on the composition). As follows from the WIEN-2k calculations, this is fulfilled quite well in this system.
To predict the relative stability of di erent phases, which might appear in the quasibinary phase diagram of LSM solid solutions in a wide range of dopant concentrations, the statistical thermodynamic approach combined with the ab-initio calculations was used. Such an approach has been successfully applied to di erent systems (see, e.g. , [756–758] and references therein).
The standard periodic ab-initio approach could be used only for ground-state energy calculations and ordered structures and thus does not allow prediction of thermodynamic stability of these phases as the temperature grows. This forces the problem to be reformulated so as to permit the extraction of the necessary energy parameters from the calculations for the ordered phases, and to apply these parameters to the study of the disordered or partly ordered solid solutions, in order to get information on the thermodynamic behavior of LSM solid solutions. From the exper-
10.3 Point Defects in Perovskites |
455 |
imental data [759] it follows that in these solid solutions Sr atoms substitute for La at all atomic fractions, 0 < c < 1. Therefore, it is possible to consider the LSM solid solution as formed by La and Sr atom arrays occupying the sites of a simple cubic lattice immersed in the external field of the remaining lattice of Mn and O ions. The thermodynamics of such solid solutions can be formulated in terms of the e ective interatomic mixing potential, which describes the interaction of La and Sr atoms embedded into the field of the remaining lattice. The study is based on the calculation of the relative stabilities of di erent ordered LSM cubic phases.
Figure 10.8 illustrates four phases: three of them (a, b, c) correspond to c =0.5, the last one (i) with c =7/8 corresponds to 12.5% Sr-doped LaMnO3. The remaining phases in Table 10.18 are the same as those used in BacSr(1−c)O3 calculations [756].
Table 10.18. Total energies Etot per 2 × 2 × 2 cell, for LacSr1−cMnO3 compositions and equilibrium lattice parameters aeq for di erent structures, see [754] and Fig. 10.8.
|
|
WIEN-2k |
Crystal-03 |
||
Structure |
c |
Etot (Ry) |
˚ |
Etot (Ry) |
˚ |
aeq (A) |
aeq (A) |
||||
a |
0.5 |
–115574.4034 |
3.881 |
–5771.8383 |
3.903 |
b |
0.5 |
–115574.4248 |
3.881 |
–5771.8688 |
3.903 |
c |
0.5 |
–115574.4178 |
3.879 |
–5771.8812 |
3.903 |
d |
0.25 |
–94302.8877 |
3.862 |
|
|
e |
0.75 |
–136845.8880 |
3.901 |
|
|
f |
0.25 |
–94302.8725 |
3.865 |
|
|
g |
0.75 |
–136845.8763 |
3.901 |
|
|
h |
0.125 |
–83667.1051 |
3.855(3.828) |
|
|
i |
0.875 |
–147481.5822 |
3.914 |
–5776.8921 |
3.951 |
LaMnO3 |
|
–158117.2795 |
3.921(3.947) |
–5778.3816 |
3.967 |
SrMnO3 |
|
–73031.3269 |
3.848(3.806) |
–5764.9568 |
3.840 |
*For the references to these experimental data see in [754].
In the concentration wave (CW) theory [760] the distribution of atoms A in a binary A–B alloy is described by a single occupancy probability function n(r). This is the probability to find the atom A (La) at the site r of the crystalline lattice. The configurational part of the free energy of solid-solution formation (per atom) includes the internal formation energy ∆U , the function n(r), a concentration of particles La(A), the e ective interatomic potentials between La atoms (A) and Sr atoms (B), for details see [754].
To find the internal formation energies, which are di erences between total energies of superstructures and the reference-state energy, the energy of a heterogeneous mixture, cLaMnO3 + (1-c)SrMnO3, has been chosen for the reference state. This energy is calculated as the sum of weighted (according to the atomic fractions) total energies of the two pure limiting phases, LaMnO3 and SrMnO3. From ab-initio calculations the total energies Etot and equilibrium lattice constant for all superstructures are obtained, Table 10.18. The internal formation energies for ordered phases (Table 10.19) are calculated by the definition
456 10 Modeling and LCAO Calculations of Point Defects in Crystals |
|
∆U = Etot − cEtotLaMnO3 + (1 − c)EtotSrMnO3 |
(10.17) |
Table 10.19. Formation energies of di erent superstructures (in eV per atom on La/Sr sublattice) as calculated by means of the WIEN-2k (FPLAPW) and CRYSTAL-03 (LCAO) codes, [754]
Configuration |
FPLAPW |
LCAO |
a |
0.170 |
0.288 |
b |
0.207 |
0.339 |
c |
0.195 |
0.360 |
i |
0.080 |
0.320 |
All these energies calculated using two very di erent DFT methods (FPLAPW and LCAO) are negative, i.e. the formation of these ordered phases is energetically favorable with respect to their decomposition at T =0 K into a heterogeneous mixture of LaMnO3 and SrMnO3 phases. It is easy to see from Table 10.18 that at the stoichiometric composition c=1/2 the ordered phases a, b, c (which have di erent local impurity arrangements in the supercell) are energetically more favorable than other phases. Also, these three phases di er slightly between themselves in the formation energies.
The absolute values for formation energies, given in Table 10.19, are larger in LCAO calculations than those from FPLAPW calculations, especially for the “i” configuration. In order to check this point, additional LCAO calculations were performed using two di erent hybrid exchange-correlation functionals (B3LYP and B3PW) and optimized lattice constants in all four configurations. However, the results are very close to those obtained by using Vegard’s law. Therefore, the only reason for the energy discrepancy is the use of di erent computational schemes. However the use of two di erent methods allows more reliable information to be obtained. In this particular case, both methods give qualitatively similar results. Using these formation energies it is possible to calculate the temperature evolution of the long-range order (LRO) parameters of the superlattices. The LRO parameters characterize the atomic ordering in sublattices of the ABO3-type perovskite. Their values were taken to be equal to unity (which corresponds to completely ordered phases at stoichiometric compositions). The concentration was taken to be equal to the stoichiometric compositions of the corresponding phases. Finally, the free energy of formation of the phase La0.875Sr0.125MnO3 was calculated (we refer the reader to [754] for details).
The calculations of LSM solid solution considered here demonstrate the e ciency of use of thermodynamic formalism based on combination of the ab-initio electronicstructure calculations as developed in [754,756–758].The main feature of this approach is the treatment of ordered superstructures presenting the La-Sr sublattice immersed in the field of the remaining lattice formed by Mn and O atoms. The total-energy calculations allow the formation energies of these superstructures for di erent compositions to be found and their competition at T =0 K to be analyzed. These calculations for a series of ordered structures permit extraction of the key energy parameters – the
10.3 Point Defects in Perovskites |
457 |
Fourier transforms of the mixing potential and thus the free energy for temperature induced partly disordered structures to be determined. Using the 12.5% Sr-doped LaMnO3 a thermodynamic analysis was performed [754]. It was predicted, in particular, that disordering of this phase with respect to the decomposition into the heterogeneous mixture of LaMnO3 and SrMnO3 can occur only at temperatures above the melting point. This is in contrast to a similar study of isostructural BacSr(1−c)TiO3 solid solution where below a certain temperature Ba impurities in SrTiO3 tend to form BaTiO3 nanoclusters.
In this chapter we have seen that in modern quantum chemistry of solids the firstprinciples periodic calculations are successfully extended to formally aperiodic systems
– defective crystals and solid solutions. In the next chapter we consider the application of periodic models in the calculations of crystalline surfaces and adsorption.