


4.3 Geometry
1. Lines
In geometry, the word “line” refers to a straight line that extends without end in both directions.
The line above can be referred to as line PQ or line  . The part of the line from P to Q is called a line segment. P and Q are the endpoints of the segment. The notation
  is used to denote line segment PQ and PQ is used to denote the length of the segment.
2. Intersecting Lines and Angles
If two lines intersect, the opposite angles are called vertical angles and have the same measure. In the figure
 and
and  are vertical angles and
  and
and  are vertical angles. Also,
  since PRS is a straight line.
3. Perpendicular Lines
An angle that has a measure of  is a right angle. If two lines intersect at right angles, the lines are perpendicular. For example:
 and
and  above are perpendicular, denoted by
  . A right angle symbol in an angle of intersection indicates that the lines are perpendicular.
4. Parallel Lines
If two lines that are in the same plane do not intersect, the two lines are parallel. In the figure
lines  and
and  are parallel, denoted by
  . If two parallel lines are intersected by a third line, as shown below, then the angle measures are related as indicated, where
  .
.

5. Polygons (Convex)
A polygon is a closed plane figure formed by three or more line segments, called the sides of the polygon. Each side intersects exactly two other sides at their endpoints. The points of intersection of the sides are vertices. The term “polygon” will be used to mean a convex polygon, that is, a polygon in which each interior angle has a measure of less than  .
.
The following figures are polygons:
The following figures are not polygons:
A polygon with three sides is a triangle; with four sides, a quadrilateral; with five sides, a pentagon; and with six sides, a hexagon.
The sum of the interior angle measures of a triangle is  . In general, the sum of the interior angle measures of a polygon with n sides is equal to
  . For example, this sum for a pentagon is
  .
.
Note that a pentagon can be partitioned into three triangles and therefore the sum of the angle measures can be found by adding the sum of the angle measures of three triangles.
The perimeter of a polygon is the sum of the lengths of its sides.
The commonly used phrase “area of a triangle” (or any other plane figure) is used to mean the area of the region enclosed by that figure.
6. Triangles
There are several special types of triangles with important properties. But one property that all triangles share is that the sum of the lengths of any two of the sides is greater than the length of the third side, as illustrated below.

An equilateral triangle has all sides of equal length. All angles of an equilateral triangle have equal measure. An isosceles triangle has at least two sides of the same length. If two sides of a triangle have the same length, then the two angles opposite those sides have the same measure. Conversely, if two angles of a triangle have the same measure, then the sides opposite those angles have the same length. In isosceles triangle PQR below,  since
since  .
.
A triangle that has a right angle is a right triangle. In a right triangle, the side opposite the right angle is the hypotenuse, and the other two sides are the legs. An important theorem concerning right triangles is the Pythagorean theorem, which states: In a right triangle, the square of the length of the hypotenuse is equal to the sum of the squares of the lengths of the legs.
In the figure above,  is a right triangle, so
  . Here,
  and
and  , so
, so  , since
  and
and  . Any triangle in which the lengths of the sides are in the ratio 3:4:5 is a right triangle. In general, if a, b, and c are the lengths of the sides of a triangle and
  , then the triangle is a right triangle.
In  triangles, the lengths of the sides are in the ratio
  . For example, in
  , if
, if  , then
  and
and  . In
. In  triangles, the lengths of the sides are in the ratio
  . For example, in
  , if
, if  , then
  and
and  .
.
The altitude of a triangle is the segment drawn from a vertex perpendicular to the side opposite that vertex. Relative to that vertex and altitude, the opposite side is called the base.
The area of a triangle is equal to:
In  ,
,  is the altitude to base
  and
and  is the altitude to base
  . The area of
  is equal to
 .
.
The area is also equal to  . If
. If  above is isosceles and
  , then altitude
  bisects the base; that is,
  . Similarly, any altitude of an equilateral triangle bisects the side to which it is drawn.
In equilateral triangle DEF, if  , then
  and
and  . The area of
  is equal to
  .
.
7. Quadrilaterals
A polygon with four sides is a quadrilateral. A quadrilateral in which both pairs of opposite sides are parallel is a parallelogram. The opposite sides of a parallelogram also have equal length.
In parallelogram JKLM,  and
and  ;
;  and
and  .
.
The diagonals of a parallelogram bisect each other (that is,  and
and  ). The area of a parallelogram is equal to
 . The area of JKLM is equal to
  .
.
A parallelogram with right angles is a rectangle, and a rectangle with all sides of equal length is a square.
The perimeter of  and the area of WXYZ is equal to
  . The diagonals of a rectangle are equal; therefore
  .
.
A quadrilateral with two sides that are parallel, as shown above, is a trapezoid. The area of trapezoid PQRS may be calculated as follows:
 .
.
8. Circles
A circle is a set of points in a plane that are all located the same distance from a fixed point (the center of the circle).
A chord of a circle is a line segment that has its endpoints on the circle. A chord that passes through the center of the circle is a diameter of the circle. A radius of a circle is a segment from the center of the circle to a point on the circle. The words “diameter” and “radius” are also used to refer to the lengths of these segments.
The circumference of a circle is the distance around the circle. If r is the radius of the circle, then the circumference is equal to  , where
  is approximately
  or 3.14. The area of a circle of radius r is equal to
  .
.
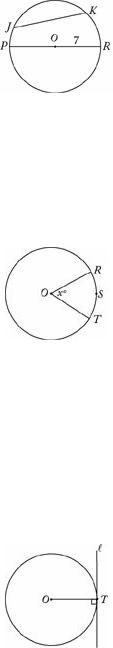
In the circle above, O is the center of the circle and  and
and  are chords.
  is a diameter and
  is a radius. If
  , then the circumference of the circle is
  and the area of the circle is
  .
.
The number of degrees of arc in a circle (or the number of degrees in a complete revolution) is 360.
In the circle with center O above, the length of arc RST is  of the circumference of the circle; for example, if
  , then arc RST has length
  of the circumference of the circle.
A line that has exactly one point in common with a circle is said to be tangent to the circle, and that common point is called the point of tangency. A radius or diameter with an endpoint at the point of tangency is perpendicular to the tangent line, and, conversely, a line that is perpendicular to a radius or diameter at one of its endpoints is tangent to the circle at that endpoint.

The line  above is tangent to the circle and radius
  is perpendicular to
  .
.
If each vertex of a polygon lies on a circle, then the polygon is inscribed in the circle and the circle is circumscribed about the polygon. If each side of a polygon is tangent to a circle, then the polygon is circumscribed about the circle and the circle is inscribed in the polygon.
In the figure above, quadrilateral PQRS is inscribed in a circle and hexagon ABCDEF is circumscribed about a circle.
If a triangle is inscribed in a circle so that one of its sides is a diameter of the circle, then the triangle is a right triangle.
In the circle above,  is a diameter and the measure of
  is
is  .
.
9. Rectangular Solids and Cylinders
A rectangular solid is a three-dimensional figure formed by 6 rectangular surfaces, as shown below. Each rectangular surface is a face. Each solid or dotted line segment is an edge, and each point at which the edges meet is a vertex. A rectangular solid has 6 faces, 12 edges, and 8 vertices. Opposite faces are parallel rectangles that have the same dimensions. A rectangular solid in which all edges are of equal length is a cube.
The surface area of a rectangular solid is equal to the sum of the areas of all the faces. The volume is equal to
 .
.
In the rectangular solid above, the dimensions are 3, 4, and 8. The surface area is equal to  . The volume is equal to
  .
.

The figure above is a right circular cylinder. The two bases are circles of the same size with centers O and P, respectively, and altitude (height)  is perpendicular to the bases. The surface area of a right circular cylinder with a base of radius r and height h is equal to
  (the sum of the areas of the two bases plus the area of the curved surface).
The volume of a cylinder is equal to  , that is,
.
In the cylinder above, the surface area is equal to
 ,
,
and the volume is equal to
 .
.
10. Coordinate Geometry
The figure above shows the (rectangular) coordinate plane. The horizontal line is called the x-axis and the perpendicular vertical line is called the y-axis. The point at which these two axes intersect, designated O, is called the origin. The axes divide the plane into four quadrants, I, II, III, and IV, as shown.
Each point in the plane has an x-coordinate and a y-coordinate. A point is identified by an ordered pair (x,y) of numbers in which the x-coordinate is the first number and the y- coordinate is the second number.
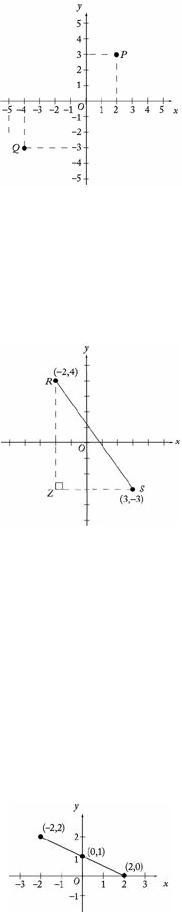
In the graph above, the (x,y) coordinates of point P are (2,3) since P is 2 units to the right of the y-axis (that is,  ) and 3 units above the x-axis (that is,
  ). Similarly, the (x,y) coordinates of point Q are (−4,−3). The origin O has coordinates (0,0).
One way to find the distance between two points in the coordinate plane is to use the Pythagorean theorem.
To find the distance between points R and S using the Pythagorean theorem, draw the triangle as shown. Note that Z has (x,y) coordinates (−2,−3),  , and
, and  . Therefore, the distance between R and S is equal to
 .
.
For a line in the coordinate plane, the coordinates of each point on the line satisfy a linear equation of the form  (or the form
  if the line is vertical). For example, each point on the line on the next page satisfies the equation
  . One can verify this for the points (–2,2), (2,0), and (0,1) by substituting the respective coordinates for x and y in the equation.
In the equation  of a line, the coefficient m is the slope of the line and the constant term b is the y-intercept of the line. For any two points on the line, the slope is defined to be the ratio of the difference in the y-coordinates to the difference in the x-coordinates. Using (–2, 2) and (2, 0) above, the slope is

 .
.
The y-intercept is the y-coordinate of the point at which the line intersects the y-axis. For the line above, the y-intercept is 1, and this is the resulting value of y when x is set equal to 0 in the equation  . The x-intercept is the x-coordinate of the point at which the line intersects the x-axis. The x-intercept can be found by setting
  and solving for x. For the line
  , this gives
Thus, the x-intercept is 2.
Given any two points (x1,y1) and (x2,y2) with  , the equation of the line passing through
these points can be found by applying the definition of slope. Since the slope is  , then using a point known to be on the line, say (x1,y1), any point (x,y) on the line must
satisfy  , or
, or  . (Using (x2,y2) as the known point would yield an equivalent equation.) For example, consider the points (–2,4) and (3,−3) on the line below.
The slope of this line is  , so an equation of this line can be found using the point (3, −3) as follows:
The y-intercept is  . The x-intercept can be found as follows:
Both of these intercepts can be seen on the graph.
If the slope of a line is negative, the line slants downward from left to right; if the slope is positive, the line slants upward. If the slope is 0, the line is horizontal; the equation of

such a line is of the form equation is of the form
 since
since  . For a vertical line, slope is not defined, and the , where a is the x-intercept.
There is a connection between graphs of lines in the coordinate plane and solutions of two linear equations with two unknowns. If two linear equations with unknowns x and y have a unique solution, then the graphs of the equations are two lines that intersect in one point, which is the solution. If the equations are equivalent, then they represent the same line with infinitely many points or solutions. If the equations have no solution, then they represent parallel lines, which do not intersect.
There is also a connection between functions (see section 4.2.10) and the coordinate plane. If a function is graphed in the coordinate plane, the function can be understood in different and useful ways. Consider the function defined by
 .
.
If the value of the function, f (x), is equated with the variable y, then the graph of the function in the xy-coordinate plane is simply the graph of the equation
shown above. Similarly, any function f (x) can be graphed by equating y with the value of the function:
 .
.
So for any x in the domain of the function f, the point with coordinates (x, f (x)) is on the graph of f, and the graph consists entirely of these points.
As another example, consider a quadratic polynomial function defined by  . One can plot several points (x, f (x)) on the graph to understand the connection between a function and its graph:
x |
f(x) |
−2 |
3 |
−1 |
0 |
0 |
−1 |
1 |
0 |
2 |
3 |
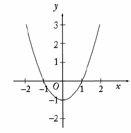
If all the points were graphed for  , then the graph would appear as follows.
The graph of a quadratic function is called a parabola and always has the shape of the curve above, although it may be upside down or have a greater or lesser width. Note that the roots of the equation  are
are  and
and  ; these coincide with the x-intercepts since x-intercepts are found by setting
  and solving for x. Also, the y-intercept is
  because this is the value of y corresponding to
  . For any function f, the x-intercepts are the solutions of the equation
  and the y-intercept is the value f (0).