

СЭГ Мира / 1 семестр / ПРАКТИКУМ СЭГ мира,часть 1 / ХРЕСТОМАТИЯ электронная / 08 CХ+УДОБРЕНИЯ / УДОБРЕНИЯ ДОКЛАД ФАО
.pdfCurrent world fertilizer trends and outlook to 2013
FOOD & AGRICULTURE ORGANIZATION OF THE UNITED NATIONS
Rome, 2009
World fertilizer trends and outlook to 2013 |
2 |
|
|
The designations employed and the presentation of material in this information product do not imply the expression of any opinion whatsoever on the part of the Food and Agriculture Organization of the United Nations (FAO) concerning the legal or development status of any country, territory, city or area or of its authorities, or concerning the delimitation of its frontiers or boundaries. The mention of specific companies or products of manufacturers, whether or not these have been patented, does not imply that these have been endorsed or recommended by FAO in preference to others of a similar nature that are not mentioned.
All rights reserved. Reproduction and dissemination of material in this information product for educational or other non-commercial purposes are authorized without any prior written permission from the copyright holders provided the source is fully acknowledged. Reproduction of material in this information product for resale or other commercial purposes is prohibited without written permission of the copyright holders.
Applications for such permission should be addressed to: Chief
Electronic Publishing Policy and Support Branch Communication Division
FAO
Viale delle Terme di Caracalla, 00153 Rome, Italy or by e-mail to:
copyright@fao.org © FAO 2009
______
|
Table of contents |
Preface................................................................................................................................................. |
3 |
Executive summary.............................................................................................................................. |
4 |
The agricultural context........................................................................................................................ |
5 |
Demand................................................................................................................................................ |
5 |
Supply ................................................................................................................................................ |
10 |
Nitrogen .......................................................................................................................................... |
10 |
Phosphate ...................................................................................................................................... |
10 |
Potash ............................................................................................................................................ |
10 |
Supply and demand balances ........................................................................................................... |
11 |
The regional fertilizer situation ........................................................................................................... |
12 |
Africa .............................................................................................................................................. |
12 |
Latin America ................................................................................................................................. |
12 |
North America ................................................................................................................................ |
12 |
East Asia ........................................................................................................................................ |
13 |
South Asia ...................................................................................................................................... |
13 |
West Asia ....................................................................................................................................... |
13 |
Eastern Europe & Central Asia ...................................................................................................... |
13 |
Western & Central Europe ............................................................................................................. |
14 |
Oceania .......................................................................................................................................... |
14 |
World fertilizer trends and outlook to 2013 |
3 |
|
|
Preface
This report presents the world nitrogen, phosphate and potassium fertilizer medium-term supply and demand projections for the period 2008–2013.
In June 2009, FAO issued its annual invitation to the Working Group of Fertilizer Organizations to review the prospects for fertilizer demand, supply and balances through to 2013.
The Working Group comprised:
EFMA |
European Fertilizer Manufacturers’ Association |
FAI |
Fertiliser Association of India |
IFA |
International Fertilizer Industry Association |
IFDC |
An International Center for Soil Fertility and Agricultural Development |
Imphos |
World Phosphate Institute |
K+S |
K+S KALI GmbH |
TFI |
The Fertilizer Institute |
FAO |
Food and Agriculture Organization of the United Nations |
In October 2006, the FAO/Fertilizer Organizations Working Group adopted a new protocol for the preparation of nutrient supply/demand balances based on the work of the IFA Production and International Trade Committee in 2005/06. The main objectives of the revised protocol were to take into account the resilient surplus between production and consumption and to update the parameters used for the computation of supply and losses.
Definitions of the terms used and their relative criteria are listed below:
•Supply: effective capacity, representing the maximum achievable production. Supply is computed from the “nameplate capacity” (theoretical capacity), multiplied by the highest operating rate achieved in the previous 5 years. For new plants, a ramp up of the operating rates was established for the first 3 years of operation, ranging from 85 to 100 percent. Supply represents maximum potential production, also referred to as effective capacity.
•Fertilizer demand: the ability or the willingness of farmers to buy fertilizer at a given point in time. It is calculated on the basis of the probable consumption in one calendar year, taking into account the merge between two agricultural years.
•Non-fertilizer demand: consumption for non-fertilizer use, referred to as industrial use.
•Losses: the unavoidable losses during the life cycle of a product, from production to final consumption. The extent of loss is estimated as a percentage of total fertilizer and nonfertilizer demand.
•Balance: the difference between supply and demand (fertilizer demand + non-fertilizer demand). Balance is a medium-term indicator of potential changes in fertilizer nutrient demand and supply by region. Changes in installed supply capacity, operating rates and demand vary annually.
•Balance/demand ratio: the percentage of surplus or deficit reported in relation to the demand.
All fertilizer references are in terms of plant nutrients: nitrogen (N), phosphate (P2O5) and potash (K2O). On the graphs, nutrients may be referred to as N, P and K.
Fertilizer demand and supply data refer to the calendar year.
The contribution made by the Working Group of Fertilizer Organizations and the special efforts made by Philippe Dugast in bringing this publication to press are gratefully acknowledged.
World fertilizer trends and outlook to 2013 |
4 |
|
|
Executive summary
Following several years of continuous growth, the global economy entered a recession.
In 2008, attention focused on soaring food prices and food security. These issues are now partially concealed by the economic crisis, but this does not mean that the problem of undernourishment has been solved.
With respect to fertilizers, after 5 years of sustained demand and sometimes limited supply, world fertilizer is likely to have a large potential surplus through 2013, unless demand rises beyond expectations. Demand is forecast to increase by 24 million tonnes (compared with 2008).
The nitrogen sector will profit from new capacities announced for 2012. The global balance/demand ratio will double, increasing from 5 percent (at present) to 9 percent (in 2013). Some regions, such as West Asia, Africa and Latin America, will reinforce their export position, but others will remain in deficit (South Asia) or even increase their deficit (North America).
Phosphate sector: the global balance/demand ratio will remain stable at around 8 percent, until 2013, but some regions will remain in deficit (Latin America) or even increase their deficit (South Asia and Western and Central Europe).
Potash sector: the global balance/demand ratio will increase from 25 percent (at present) to
35 percent (in 2013), thanks to the contribution of North America and Eastern Europe and Central Asia (EECA), while some regions will remain in deficit (Africa, Latin America, East Asia and Oceania) or even increase their deficit (South Asia).
Note that the increase in global nutrient potential surpluses within the period does not mean that regions can afford fertilizers according to their real needs.
|
|
Potential nutrient balance (thousand tonnes) |
|
|
|||
Region |
|
2008 |
2009 |
2010 |
2011 |
2012 |
2013 |
|
|
|
|
|
|
|
|
Africa |
N |
1 448 |
1 957 |
1 963 |
2 537 |
2 749 |
3 729 |
|
P2O5 |
4 580 |
4 274 |
4 390 |
4 836 |
5 374 |
5 714 |
|
K2O |
- 454 |
- 472 |
- 500 |
- 527 |
- 545 |
- 382 |
East Asia |
N |
- 1 939 |
- 1 120 |
- 471 |
- 78 |
943 |
662 |
|
P2O5 |
133 |
507 |
1 205 |
1 692 |
1 890 |
2 049 |
|
K2O |
- 7 319 |
- 6 958 |
- 7 426 |
- 7 642 |
- 7 651 |
- 7 492 |
East Europe |
N |
14 060 |
13 883 |
13 805 |
13 563 |
14 095 |
14 308 |
and Central Asia |
P2O5 |
2 323 |
2 306 |
2 285 |
2 343 |
2 298 |
2 235 |
|
K2O |
10 082 |
10 316 |
10 748 |
11 397 |
12 151 |
12 702 |
Latin America |
N |
1 087 |
984 |
602 |
509 |
1 574 |
2 342 |
and the Caribbean |
P2O5 |
- 2 931 |
- 2 680 |
- 3 018 |
- 3 090 |
- 3 104 |
- 3 099 |
|
K2O |
- 3 770 |
- 3 660 |
- 3 939 |
- 4 195 |
- 4 486 |
- 4 452 |
North America |
N |
- 6 024 |
- 6 841 |
- 7 354 |
- 7 645 |
- 7 935 |
- 8 226 |
|
P2O5 |
4 682 |
4 591 |
4 277 |
4 152 |
4 055 |
3 959 |
|
K2O |
8 935 |
9 484 |
9 435 |
10 100 |
11 350 |
12 127 |
Oceania |
N |
- 119 |
- 128 |
- 168 |
- 206 |
- 167 |
- 294 |
|
P2O5 |
- 162 |
- 114 |
- 122 |
- 151 |
- 174 |
- 194 |
|
K2O |
- 336 |
- 302 |
- 320 |
- 335 |
- 350 |
- 359 |
South Asia |
N |
- 6 209 |
- 6 369 |
- 6 234 |
- 6 722 |
- 6 753 |
- 6 753 |
|
P2O5 |
- 5 236 |
- 5 681 |
- 5 815 |
- 6 182 |
- 6 553 |
- 6 941 |
|
K2O |
- 3 653 |
- 3 482 |
- 3 598 |
- 3 826 |
- 4 050 |
- 4 275 |
West Asia |
N |
5 793 |
6 267 |
6 602 |
8 781 |
9 560 |
10 919 |
|
P2O5 |
679 |
570 |
527 |
647 |
1 275 |
1 450 |
|
K2O |
3 024 |
3 051 |
3 268 |
3 392 |
3 495 |
3 467 |
West and |
N |
- 1 789 |
- 1 624 |
- 2 170 |
- 2 509 |
- 2 902 |
- 3 259 |
Central Europe |
P2O5 |
- 1 498 |
- 1 150 |
- 1 370 |
- 1 527 |
- 1 682 |
- 1 769 |
|
K2O |
859 |
1 557 |
1 320 |
1 120 |
912 |
790 |
World |
N |
6 309 |
7 010 |
6 576 |
8 231 |
11 163 |
13 429 |
|
P2O5 |
2 570 |
2 624 |
2 360 |
2 721 |
3 381 |
3 404 |
|
K2O |
7 370 |
9 534 |
8 989 |
9 484 |
10 827 |
12 126 |
|
|
|
|
|
|
|
|
Table 1 World and regional balances 2008 to 2013
World fertilizer trends and outlook to 2013 |
5 |
|
|
The agricultural context
Following several years of good health, the world economy entered a severe recession. What began as a financial crisis during the summer of 2008 had become a serious worldwide
economic crisis by the end of the year. All the advanced economies fell into recession during the first half of 2009, and it is likely that this situation will continue until the end of the year, even if there are some signs of a slight improvement. Emerging economies have also been severely hit by the depression.
According to the OECD-FAO Agricultural Outlook 2009, despite the significant impact of the global crisis on all sectors of the economy, agriculture should come off relatively lightly, thanks to the recent period of relatively high incomes and the relatively income-inelastic demand for food.
The average prices of agricultural commodities for the next 10 years are still projected at the levels of the previous decade at least (crop prices are projected to be 10–20% higher in real terms relative to 1997–2006, while for vegetable oils real prices are expected to be over 30% higher).
Following an economic recovery, most of the growth in agricultural production and consumption will continue to come from developing countries. This is the case particularly for livestock products where the driving forces are income and population growth, and considering the trend towards higher animal protein diets and continuing urbanization.
Furthermore, according to a recent FAO study based on longer-term population and income projections, global food production needs to increase more than 40% by 2030 and 70% by 2050 (nearly 100% in developing countries), compared to average 2005–07 levels, in order to meet the challenge of a 40 percent increase in the world population and to raise average food consumption to 3 130 kcal per person per day by 2050.
Of the growth in crop production, 90% (80% in developing countries) is due to come from higher yields and increased cropping intensity with adequate use of fertilizers, the remainder from land expansion.
Demand
The soaring prices of commodities in 2008 highlighted that the fertilizer-to-crop price ratio is a key factor in determining the behaviour of farmers purchasing fertilizers. Though the ratio between international fertilizer prices (urea and di-ammonium phosphate as major indicators) and grain prices is currently lower than in 2007, farmers are exhibiting a wait-and-see attitude.
Given the high fertilizer prices of mid-2008, some farmers used greater amounts of organic nutrient sources, with potentially long-term impacts on crop nutrition practices.
Farmers who do wish to use fertilizers may be constrained in some countries by the lack of affordable credit.
Fertilizers, like other commodities, have been affected by the economic crisis. According to IFA, aggregate world fertilizer demand in 2008/09 is estimated to be down by 5 percent compared with the previous year: from 168 to 160 million tonnes of nutrients.
Nitrogen is least affected, because drastic reductions in N fertilizer application rates have immediate negative consequences for yield; this is not the case with P and K fertilizers.
Drops in consumption have been registered in all regions except Africa, South Asia and EECA (in these latter two regions farmers benefit from strong government support for increased fertilizer use). The most significant drops in volume are in Western and Central Europe, North America and Latin America.
World fertilizer trends and outlook to 2013 |
6 |
|
|
This study is based on the assumption of a recovery beginning in 2009/10.
Given the 2-year decline, it is difficult to express average rates of increase; they depend on the point of reference. Two sets of data are therefore presented, according to the reference year.
First method -
Comparing 2013 (end of forecast period) with 2007 (the reference year).
Global NPK nutrients consumption (Mt)
190 |
|
|
|
|
|
|
180 |
|
|
|
|
|
|
170 |
|
|
|
|
|
|
160 |
|
|
|
|
|
|
150 |
|
|
|
|
|
|
2007 |
2008 |
2009 |
2010 |
2011 |
2012 |
2013 |
8%
6%
4%
2%
0%
-2%
-4%
-6%
Table 2
|
|
|
annual increase rate |
N |
|
|
|
|
|
|
|
|
|
|
|
|
|
|
|||
|
|
|
annual increase rate |
P |
|
|
|
|
|
|
|
|
|
|
|
|
|
|
|||
|
|
|
annual increase rate |
K |
|
|
|
|
|
|
|
|
|
|
|
|
|
|
|||
A |
a |
|
|
n |
ica |
|
ia |
|
ia |
|
|
|
t |
|
|
|
Asia |
|
eania |
d |
|
ric |
|
b |
|
|
|
|
|
|
|
|
|
Worl |
|||||||||
|
|
|
ea |
|
|
|
|
|
|
ia |
|
|
|
|
|
|
|
||||
f |
|
rib |
Amer |
|
As |
|
As |
|
|
|
|
As |
|
|
|
|
|
Oc |
|
||
|
|
|
|
East |
outh |
|
|
|
s |
|
|
ntral |
Europe |
|
|||||||
|
ic |
a |
|
h |
|
We |
|
|
|
|
|
||||||||||
|
C |
|
No |
|
|
S |
|
|
|
|
C |
|
|
|
|
||||||
Amer |
a |
|
|
|
|
|
|
|
|
|
|
|
rope |
& |
|
|
n |
|
|
|
|
|
|
|
|
|
|
|
|
|
|
|
|
|
|
|
|
|
al |
|
|
||
|
|
|
|
|
|
|
|
|
|
|
|
|
|
|
|
|
|
r |
|
|
|
|
|
|
|
|
|
|
|
|
|
|
|
|
|
|
|
|
|
t |
|
|
|
tin |
|
|
|
|
|
|
|
|
|
|
|
|
|
u |
|
|
|
Ce |
|
|
|
a |
|
|
|
|
|
|
|
|
|
|
n |
E |
|
|
& |
|
|
|
|
||
L |
|
|
|
|
|
|
|
|
|
|
|
|
|
|
|
|
|
|
|
||
|
|
|
|
|
|
|
|
|
|
r |
|
|
|
|
tern |
|
|
|
|
|
|
|
|
|
|
|
|
|
|
|
Easte |
|
|
|
|
|
|
|
|
|
|
||
|
|
|
|
|
|
|
|
|
|
|
|
|
s |
|
|
|
|
|
|||
|
|
|
|
|
|
|
|
|
|
|
|
|
|
We |
|
|
|
|
|
|
|
|
|
|
|
|
|
|
|
|
|
|
|
|
|
|
|
|
|
|
|
annual increase rate |
|
Continent |
|
Region |
|
|
|
|
|
|
|
|
|
|
|
|
|
N |
P2O5 |
K2O |
|||
Africa |
Africa |
3.8% |
4.3% |
3.3% |
America |
Latin America Caribbean |
1.2% |
0.9% |
1.4% |
|
North America |
0.5% |
0.8% |
0.2% |
Asia |
East Asia |
1.5% |
1.9% |
1.5% |
|
South Asia |
3.4% |
6.0% |
7.5% |
|
West Asia |
1.2% |
-0.2% |
0.4% |
Europe |
Eastern Europe & Central Asia |
5.6% |
6.5% |
5.1% |
|
Western & Central Europe |
-0.7% |
-3.1% |
-2.5% |
Oceania |
Oceania |
0.0% |
-2.1% |
-0.6% |
World |
|
1.7% |
2.8% |
3.2% |
|
|
|
|
|
|
|
|
|
|
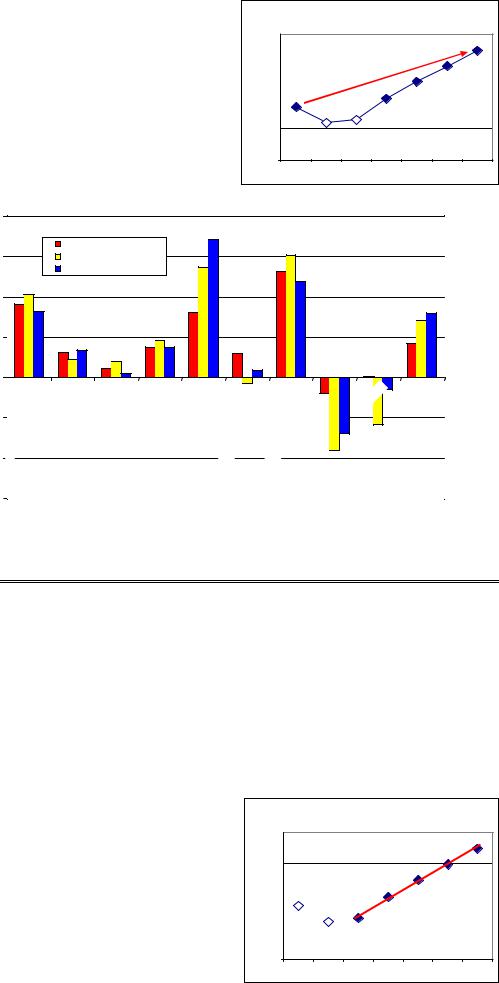
Second method -
Taking 2010 as the start of the recovery period, the rates of increase represent the slope of the fitting curve from 2009 onwards.
The figures are as follows:
Global NPK nutrients consumption (Mt)
190
180
170
160
150
2007 |
2008 |
2009 |
2010 |
2011 |
2012 |
2013 |
World fertilizer trends and outlook to 2013 |
7 |
|
|
8% |
|
|
|
|
|
|
|
annual increase rate |
N |
|
|
|
|
|
|
|
|
|
|
|
|
|
|
||||
|
|
|
|
|
|
|
|
|
|
|
|
|
|
|
|
|
|
|
|
|
|
||||||
|
|
|
|
|
|
|
|
annual increase rate |
P |
|
|
|
|
|
|
|
|
|
|
|
|
|
|
||||
|
|
|
|
|
|
|
|
annual increase rate |
K |
|
|
|
|
|
|
|
|
|
|
|
|
|
|
||||
6% |
|
|
|
|
|
|
|
|
|
|
|
|
|
|
|
|
|
|
|
|
|
|
|
|
|
|
|
4% |
|
|
|
|
|
|
|
|
|
|
|
|
|
|
|
|
|
|
|
|
|
|
|
|
|
|
|
2% |
|
|
|
|
|
|
|
|
|
|
|
|
|
|
|
|
|
|
|
|
|
|
|
|
|
|
|
0% |
|
|
|
|
|
|
|
|
|
|
|
|
|
|
|
|
|
|
|
|
|
|
|
|
|
|
|
|
|
ica |
|
|
ean |
|
America |
|
|
a |
|
Asia |
|
|
Asia |
|
|
|
sia |
|
|
|
|
ope |
Oceania |
ld |
|
|
fr |
|
|
|
|
|
Asi |
|
|
|
|
|
lA |
|
|
|
|
Wor |
|||||||||
|
A |
|
|
ibb |
|
|
|
ast |
|
South |
|
|
t |
|
|
|
|
|
|
|
ur |
|
|||||
|
|
|
|
|
|
|
|
|
|
s |
|
|
Centra |
|
|
|
E |
|
|
||||||||
|
|
|
|
ar |
|
|
E |
|
|
e |
|
|
|
|
al |
|
|
|
|||||||||
|
|
|
C |
|
rth |
|
|
|
|
W |
|
|
|
|
|
|
|
|
|
|
|||||||
|
|
erica |
|
|
|
No |
|
|
|
|
|
|
|
|
|
e & |
|
|
|
& |
Cent |
|
|
|
|
|
|
|
|
Am |
|
|
|
|
|
|
|
|
|
|
|
|
p |
|
|
n |
|
|
|
|
|
|
|
||
|
in |
|
|
|
|
|
|
|
|
|
|
|
|
o |
|
|
|
|
|
|
|
|
|
|
|
||
|
|
|
|
|
|
|
|
|
|
|
|
|
Eur |
|
|
|
er |
|
|
|
|
|
|
|
|
||
t |
|
|
|
|
|
|
|
|
|
|
|
|
|
|
est |
|
|
|
|
|
|
|
|
||||
La |
|
|
|
|
|
|
|
|
|
|
|
Eastern |
|
|
|
W |
|
|
|
|
|
|
|
|
|
||
|
|
|
|
|
|
|
|
|
|
|
|
|
|
|
|
|
|
|
|
|
|
|
|
|
|||
|
|
|
|
|
|
|
|
|
|
|
|
|
|
|
|
|
|
|
|
|
|
|
|
|
|
||
Table 3
|
|
annual increase rate |
|
|
Continent |
Region |
N |
P2O5 |
K2O |
|
|
|
|
|
|
|
|
|
|
Africa |
Africa |
4.6% |
6.0% |
4.6% |
America |
Latin America Caribbean |
4.5% |
5.7% |
5.6% |
|
North America |
1.2% |
3.0% |
5.3% |
Asia |
East Asia |
1.6% |
2.5% |
5.3% |
|
South Asia |
2.6% |
4.2% |
5.3% |
|
West Asia |
2.8% |
4.0% |
5.8% |
Europe |
Eastern Europe & Central Asia |
5.8% |
7.5% |
3.8% |
|
Western & Central Europe |
1.8% |
6.4% |
6.2% |
Oceania |
Oceania |
2.5% |
3.2% |
4.3% |
World |
|
2.2% |
3.8% |
5.3% |
|
|
|
|
|
This approach takes into consideration the period of depression (2008–09) and the potential of a strong recovery beginning in 2010.
At global level, a comparison with last year’s forecast points to a sustained increase for P and K and a more moderate increase for N. The latter is the result of revised figures for East Asia as China approaches “mature” market status with regard to N fertilizers. The forecast for world consumption in 2013 is some 185 million tonnes of nutrients, compared with the 2008 forecast of 192 million tonnes for 2012 (from a starting figure of 175 million tonnes in 2008).
At regional level, most increase in demand during the next 5 years will continue to come from Asia and, to a lesser extent, from Latin America.
Fertilizer consumption in Africa is expected to pick up in some countries in response to government initiatives to establish fertilizer subsidy schemes, as well as in response to development initiatives reported by IFDC and FAO.
East Asia and South Asia together will account for over one-half of the total growth of global fertilizer consumption.
In East Asia, the growth in regional demand is expected to decline as China approaches “mature” market status for N and P fertilizers. Recycling nutrients from organic material is increasingly considered. Fertilization is more balanced than in the past. The increase in rate of fertilizer consumption is likely to be lower for the outlook period than for the past decade.
World fertilizer trends and outlook to 2013 |
8 |
|
|
Demand is forecast to remain high in South Asia, as large amounts of fertilizer are required to ensure food security through intensification. However, according to FAI, the forthcoming revision of the fertilizer subsidy scheme in India could impact the outlook.
Fertilizer demand in West Asia is only expected to rise modestly, since the potential for increasing crop production in the region is limited and conditioned by weather conditions and is thus very uncertain.
The expansion of fuel ethanol production from maize in North America remains the principal driving force behind regional agriculture capable of sustaining the overall fertilizer demand. According to TFI, the region is expected to recover relatively quickly from the significant drop recorded in 2008/09 (particularly with regard to P and K).
Fertilizer demand in Latin America is expected to remain depressed in 2009. Recovery is forecast to start in 2010, driven by South American countries (Brazil and Argentina) strengthening their position in the international agricultural market and, to a lesser extent, by Central America (Mexico) where there is a significant increase in fruit and vegetable production.
Thanks to the potential to convert large areas of idle land back to cropping, in the medium term Eastern Europe and Central Asia (CIS in general, Russia in particular) can provide cereals and oilseeds to the international market. Fertilizer consumption in the region is therefore forecast to increase steadily in response to a favourable policy context and to the potential for increasing production over a relatively short period.
In Oceania, agriculture has barely recovered from two consecutive drought-affected years. Consumption is expected to recover slowly (subject to drought conditions) and reach a level at the end of the outlook period comparable to the period 2007–08.
Table 4
|
Regional and subregional fertilizer consumption 2008-2013 (Mio t) |
|
||||
|
Region |
|
N |
P2O5 |
K2O |
Total |
|
|
|
|
|
|
|
Africa |
Africa |
2008 |
2.5 |
0.9 |
0.4 |
3.8 |
|
|
2013 |
3.3 |
1.2 |
0.5 |
4.9 |
America |
Latin America Caribbean |
2008 |
5.9 |
4.5 |
4.6 |
15.0 |
|
|
2013 |
7.2 |
5.7 |
5.7 |
18.5 |
|
North America |
2008 |
13.0 |
4.1 |
3.8 |
20.9 |
|
|
2013 |
14.0 |
4.7 |
4.9 |
23.6 |
Asia |
East Asia |
2008 |
40.0 |
14.1 |
8.1 |
62.2 |
|
|
2013 |
43.5 |
16.1 |
10.2 |
69.8 |
|
South Asia |
2008 |
19.5 |
7.5 |
3.5 |
30.5 |
|
|
2013 |
22.2 |
9.4 |
4.1 |
35.7 |
|
West Asia |
2008 |
2.9 |
1.0 |
0.3 |
4.2 |
|
|
2013 |
3.4 |
1.3 |
0.4 |
5.1 |
Europe |
East Europe & Central Asia |
2008 |
3.6 |
0.9 |
1.2 |
5.6 |
|
|
2013 |
4.6 |
1.2 |
1.4 |
7.2 |
|
West & Central Europe |
2008 |
11.2 |
3.0 |
3.5 |
17.7 |
|
|
2013 |
11.4 |
3.0 |
3.7 |
18.1 |
Oceania |
Oceania |
2008 |
1.1 |
1.1 |
0.3 |
2.6 |
|
|
2013 |
1.2 |
1.2 |
0.4 |
2.8 |
World |
|
2008 |
99.9 |
37.0 |
25.8 |
162.6 |
|
|
2013 |
110.6 |
44.0 |
31.2 |
185.8 |
|
|
|
|
|
|
|
World fertilizer trends and outlook to 2013 |
9 |
|
|
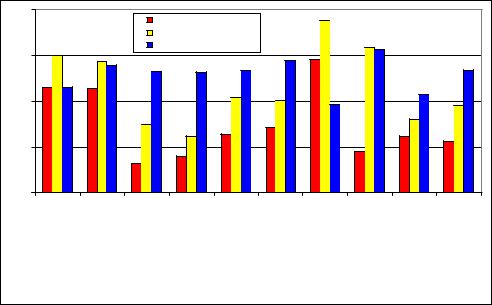
Regional and sub-regional change
in world Fertilizer consumption 2008-2013
Mt nutrients
70 |
|
|
|
|
|
|
|
|
|
|
|
|
|
|
|
|
|
|
|
60 |
|
|
|
|
|
|
|
|
|
|
|
|
|
variation 2008 to 2013 |
|||||
|
|
|
|
|
|
|
|
|
|
|
|
|
|
||||||
50 |
|
|
|
|
|
|
|
|
|
|
|
|
|
consumption 2008 |
|||||
40 |
|
|
|
|
|
|
|
|
|
|
|
|
|
|
|
|
|
|
|
30 |
|
|
|
|
|
|
|
|
|
|
|
|
|
|
|
|
|
|
|
20 |
|
|
|
|
|
|
|
|
|
|
|
|
|
|
|
|
|
|
|
10 |
|
|
|
|
|
|
|
|
|
|
|
|
|
|
|
|
|
|
|
0 |
ica |
|
|
|
|
n |
|
ica |
a |
ia |
|
a |
|
|
|
a |
e |
a |
|
|
|
|
|
|
|
|
|
|
|
||||||||||
|
|
|
|
a |
|
si |
h As |
si |
|
|
|
|
si |
urop |
Oceani |
||||
|
r |
|
|
e |
|
r |
tA |
tA |
|
|
|
lA |
|||||||
|
Af |
|
|
ibb |
|
|
me |
|
|
|
|
||||||||
|
|
|
r |
|
|
|
s |
out |
Wes |
|
entra |
|
al |
E |
|||||
|
|
a |
|
|
th |
A |
|
Ea |
|
|
|
||||||||
|
a |
C |
|
|
|
|
|
S |
|
|
r |
|
|
||||||
|
|
|
|
|
or |
|
|
|
|
|
& |
C |
|
|
|
ent |
|
|
|
|
meric |
|
|
|
|
N |
|
|
|
|
e |
|
|
|
& |
C |
|
|
|
|
|
|
|
|
|
|
|
|
|
|
|
|
|
|
|
|
|||
|
|
|
|
|
|
|
|
|
|
urop |
|
|
|
n |
|
|
|
||
|
A |
|
|
|
|
|
|
|
|
|
|
|
|
|
|
|
|
||
in |
|
|
|
|
|
|
|
|
|
|
|
r |
|
|
|
|
|||
|
|
|
|
|
|
|
|
|
|
|
|
te |
|
|
|
|
|
||
t |
|
|
|
|
|
|
|
|
|
n |
E |
Wes |
|
|
|
|
|
||
a |
|
|
|
|
|
|
|
|
|
|
|
|
|
|
|
||||
L |
|
|
|
|
|
|
|
|
|
aster |
|
|
|
|
|
|
|||
|
|
|
|
|
|
|
|
|
|
|
|
|
|
|
|
||||
|
|
|
|
|
|
|
|
|
|
|
|
|
|
|
|
|
|
|
|
|
|
|
|
|
|
|
|
|
|
E |
|
|
|
|
|
|
|
|
|
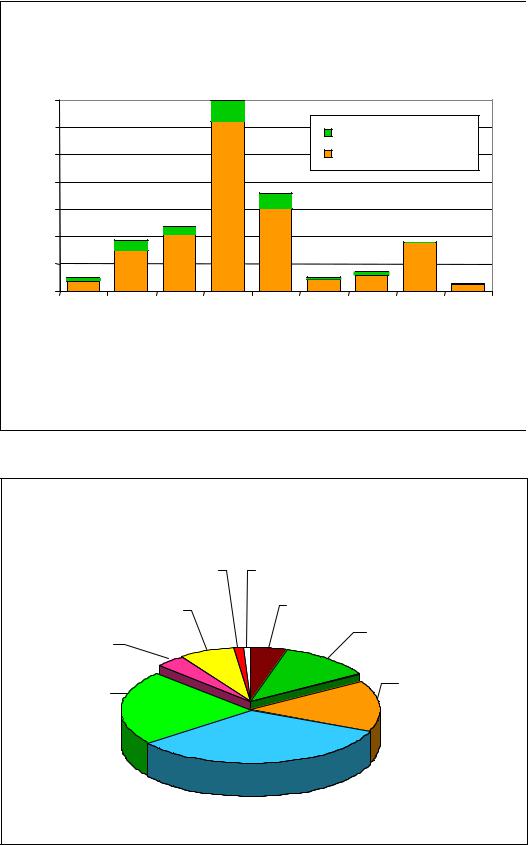
Regional and subregional contribution to change in world Fertilizer consumption 2008-2013
Western & Central |
|
Europe 2% |
Oceania 1% |
Eastern Europe & |
Africa 5% |
Central Asia 7% |
|
West Asia 4% |
North America 12% |
|
|
|
Latin America |
South Asia 22% |
& Caribbean 15% |
 East Asia 32%
Compared with last year’s outlook, less weight is given to East and South Asia (55% vs 65%), and more share is given to North America (12% vs 6%) and EECA (7% vs 4%).
World fertilizer trends and outlook to 2013 |
10 |
|
|
Supply
Figures for supply are provided by IFA for ammonia and potash, and by Imphos and IFA for phosphoric acid.
Note that Capacities are “nameplate” figures (theoretical capacities) officially given by producers, while Supply represents the maximum achievable production facing a new demand (taking into account the unavoidable dysfunctions in production, logistics adjustments etc.); in no case do they refer to the current production.
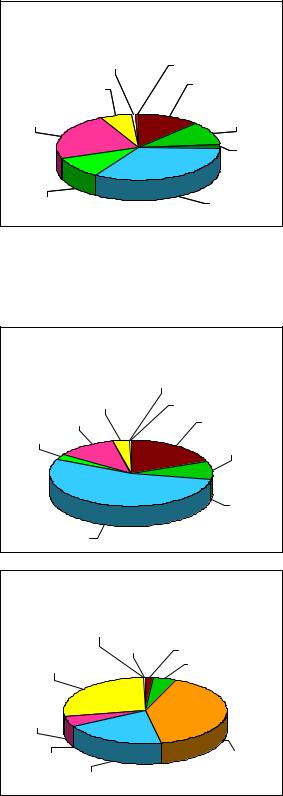
Nitrogen |
Regional and sub-regional contribution to change |
||
in global Ammonia supply 2008-2013 |
|||
According to IFA, global ammonia capacity is |
Western & Central |
|
|
projected to increase by 20 percent, from 149 million |
|
||
Europe 0% |
Oceania 0.5% |
||
tonnes of N in 2008 to 179 million tonnes in 2013. |
|
||
Eastern Europe & |
|
||
Two-thirds of this increase will come from new units, |
Africa 12% |
||
Central Asia 6% |
|
||
|
|
||
the remaining third will be the result of revamping |
|
Latin America |
|
activities. |
|
||
West Asia 23% |
Caribbean 12% |
||
Global ammonia capacity is expected to increase at |
|
|
|
an average rate of 6 million tonnes of N per year, but |
|
North |
|
the forecasted figure for 2012 alone is almost |
|
America 0% |
|
|
|
||
8 million tonnes. In terms of regional distribution, |
|
|
|
most of the growth in capacity will occur in East |
South Asia 10% |
East Asia 34% |
|
Asia, West Asia, Latin America and Africa. |
|||
|
|
||
Potash |
Regional and sub-regional contribution to change |
||
|
|||
Market conditions in recent years and strong |
in global Potash supply 2008-2013 |
||
|
|
||
demand prospects in the medium term have |
|
|
|
prompted many prospective producers to invest in |
Western & Central Europe 0% |
||
exploration and capacity development programmes. |
|
Oceania 0% Africa 2% |
|
According to IFA, there are numerous potash |
Eastern Europe & |
Latin America |
|
Central Asia 27% |
|||
|
Caribbean 4% |
||
projects in over 20 countries, but only a small |
|
||
|
|
||
number will be implemented during the next 5 years. |
|
|
|
Global potash capacity is forecast to increase from |
West |
|
|
|
|
||
40 million tonnes of K2O in 2008 to 54 million tonnes |
Asia 5% |
|
|
|
|
||
of K2O in 2013. This additional capacity will come |
|
|
|
mostly from Canada, Russia and China, and to a |
South Asia 0% |
North |
|
lesser extent from West Asia, Latin America and |
America 42% |
||
|
|||
|
|
||
Africa. |
East Asia 20% |
|
|
|
|
||