

СЭГ Мира / 1 семестр / ПРАКТИКУМ СЭГ мира,часть 1 / ХРЕСТОМАТИЯ электронная / 02 ТОПЛИВНО-ЭНЕРГЕТИЧ КОМПЛЕКС 2008 / ИНФОРМАЦИОННЫЙ БЮЛЛЕТЕНЬ SAIS
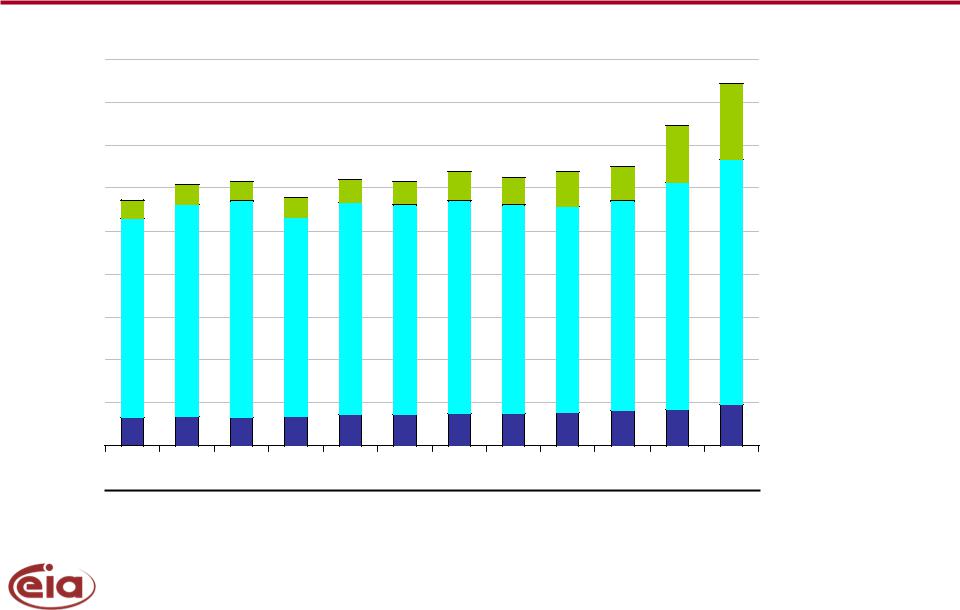
.pdfBiofuels grow, but fall short of the 36 billion gallon RFS target in 2022, exceed it in 2035
billion gallon-equivalents |
|
|
45 |
Legislated RFS in 2022 |
Renewable |
40 |
|
|
|
|
diesel |
|
|
|
|
||
|
|
|
|
||
|
|
|
|
|
35 |
RFS with |
|
|
|
Biomass-to- |
|
|
|
|
liquids |
|
||
30 |
adjustments under |
|
|
|
Biodiesel |
|
CAA Sec.211(o)(7) |
|
|
|
|
||
25 |
|
|
|
Net ethanol |
|
|
|
|
|
|
|
||
20 |
|
|
|
Other |
imports |
|
|
|
|
Cellulosic |
|
||
15 |
|
|
|
feedstocks |
|
|
|
|
|
|
ethanol |
|
|
10 |
|
|
|
|
|
|
5 |
|
|
|
|
Corn ethanol |
|
|
|
|
|
|
|
|
0 |
2008 |
2022 |
2022 in |
|
2035 |
|
|
|
|
||||
|
|
|
AEO2009 |
|
|
|
|
Richard Newell, SAIS, December 14, 2009 |
|
Source: Annual Energy Outlook 2010 |
11 |
||
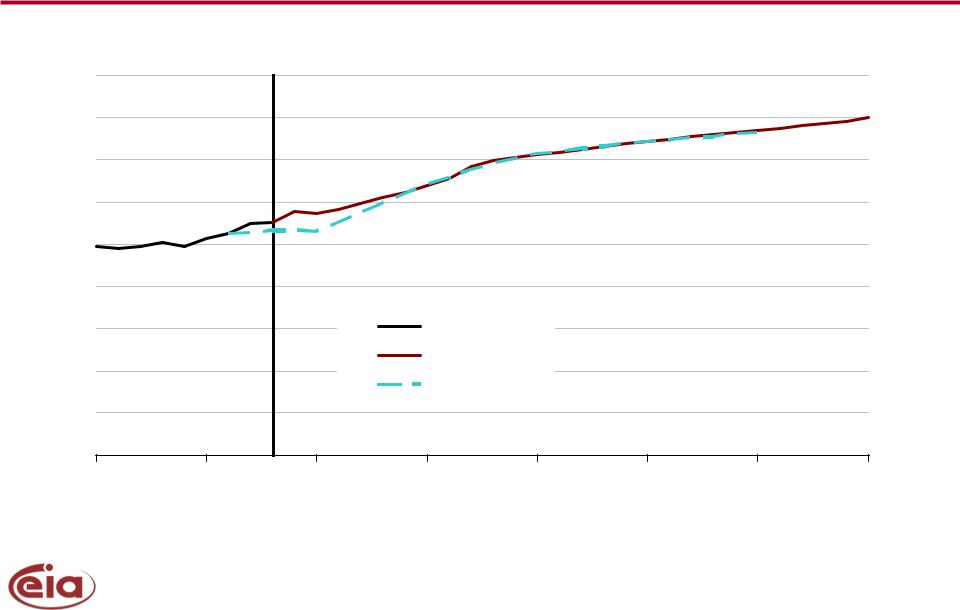
New light duty vehicle efficiency reaches 40 mpg by 2035
miles per gallon
45 |
|
|
|
|
|
|
|
40 |
|
|
|
|
|
|
|
35 |
|
|
|
|
|
|
|
30 |
|
|
|
|
|
|
|
25 |
|
|
|
|
|
|
|
20 |
|
|
|
|
|
|
|
15 |
|
|
History |
|
|
|
|
10 |
|
|
AEO2010 |
|
|
|
|
|
|
Updated AEO2009 reference case |
|
||||
5 |
|
|
|
||||
|
|
|
|
|
|
|
|
0 |
|
|
|
|
|
|
|
2000 |
2005 |
2010 |
2015 |
2020 |
2025 |
2030 |
2035 |
Richard Newell, SAIS, December 14, 2009 |
Source: Annual Energy Outlook 2010 |
12 |

Mild and full hybrid systems dominate new light-duty vehicle sales by 2035
millions |
|
History |
|
|
Projections |
|
|
10 |
|
|
|
|
|
||
|
|
|
|
|
|
|
|
9 |
Electric/fuel cell |
|
|
|
|
|
|
8 |
|
|
|
|
|
||
Plug-in hybrid electric |
|
|
|
|
|||
7 |
|
|
|
|
|||
Hybrid electric |
|
|
|
|
|
||
6 |
|
|
|
|
|
||
Mild hybrid electric |
|
|
|
|
|||
5 |
|
|
|
|
|||
Gaseous |
|
|
|
|
|
||
4 |
|
|
|
|
|
||
Flex fuel |
|
|
|
|
|
||
3 |
|
|
|
|
|
||
Diesel |
|
|
|
|
|
||
2 |
|
|
|
|
|
||
|
|
|
|
|
|
|
|
1 |
|
|
|
|
|
|
|
0 |
|
|
|
|
|
|
|
|
2000 |
2008 |
2015 |
2020 |
2025 |
2030 |
2035 |
Richard Newell, SAIS, December 14, 2009 |
Source: Annual Energy Outlook 2010 |
13 |
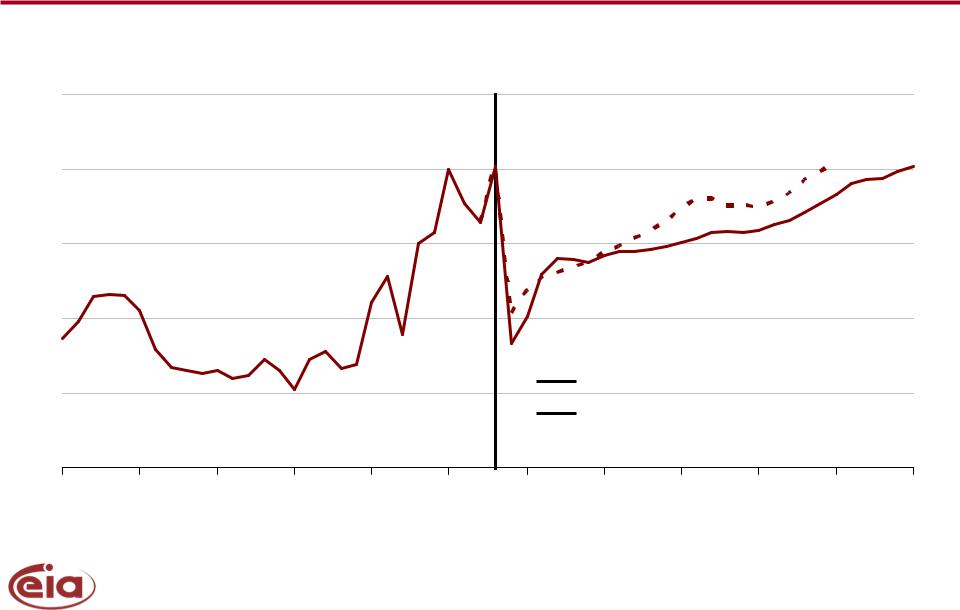
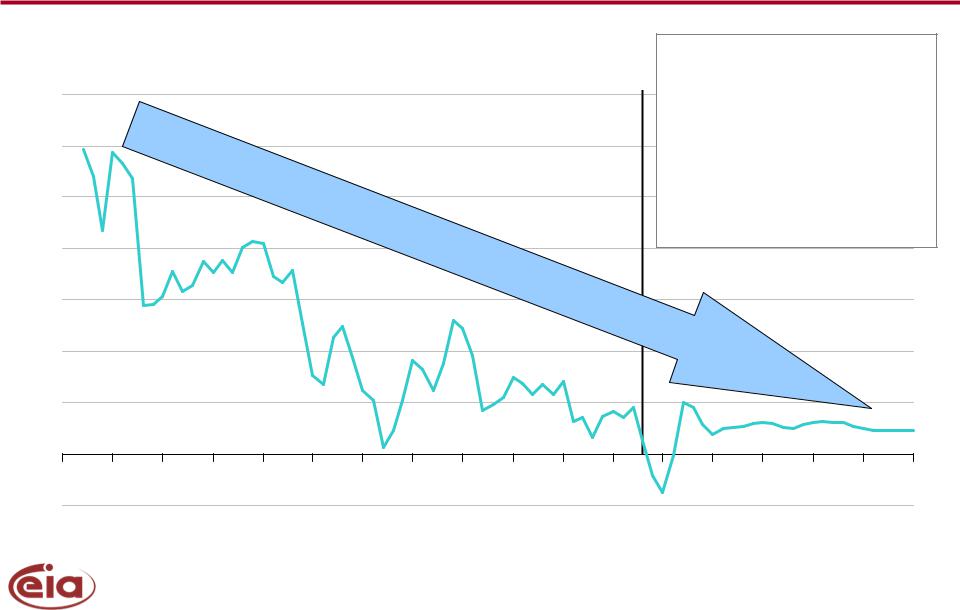
Natural gas wellhead price is projected to rise from low levels experienced during 2008-2009 recession
2008 dollars per thousand cubic feet
10 |
|
History |
|
|
|
|
Projections |
|
|
||
|
|
|
|
|
|
|
|
|
|
|
|
8 |
|
|
|
|
|
|
|
|
|
|
|
6 |
|
|
|
|
|
|
|
|
|
|
|
4 |
|
|
|
|
|
|
|
|
|
|
|
2 |
|
|
|
|
|
|
AEO2010 reference case |
|
|||
|
|
|
|
|
|
Updated AEO2009 reference case |
|||||
|
|
|
|
|
|
|
|||||
0 |
|
|
|
|
|
|
|
|
|
|
|
1980 |
1985 |
1990 |
1995 |
2000 |
2005 |
2010 |
2015 |
2020 |
2025 |
2030 |
2035 |
Richard Newell, SAIS, December 14, 2009 |
Source: Annual Energy Outlook 2010 |
14 |
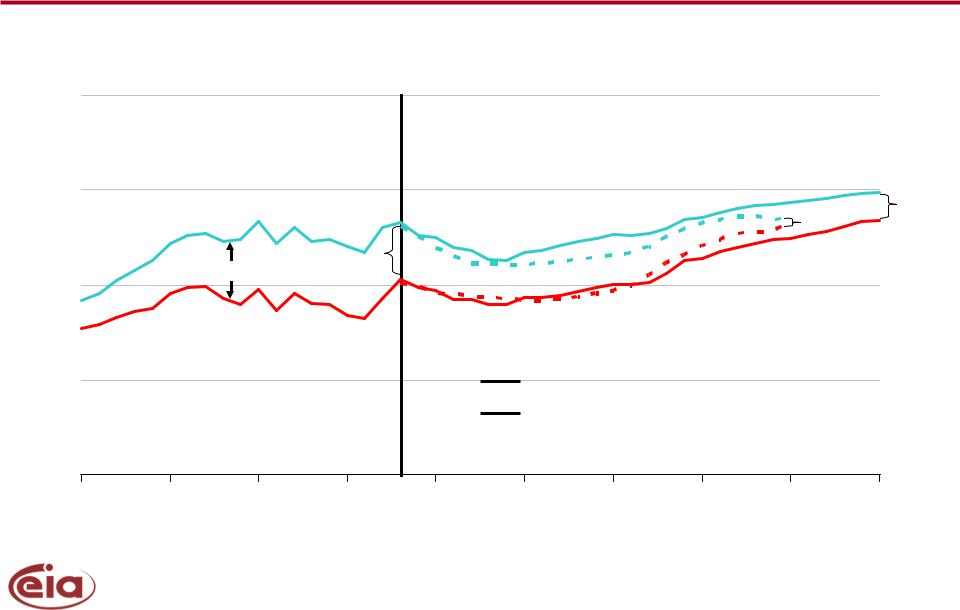
Import share of natural gas supply declines as domestic supply grows
trillion cubic feet
30 |
|
History |
|
|
|
|
Projections |
|
|
|
|
|
|
|
|
|
|
|
|
25 |
Consumption |
|
|
|
|
|
|
|
6% |
|
|
|
|
|
|
|
2% |
||
|
|
|
|
|
|
|
|
||
|
|
|
|
|
|
|
|
|
|
20 |
Net imports |
13% |
|
|
|
|
|
|
|
|
|
|
|
|
|
|
|
|
|
|
Domestic supply |
|
|
|
|
|
|
|
|
15 |
|
|
|
|
AEO2010 reference case |
|
|||
|
|
|
|
|
Updated AEO2009 reference case |
||||
10 |
|
|
|
|
|
|
|
|
|
1990 |
1995 |
2000 |
2005 |
2010 |
2015 |
2020 |
2025 |
2030 |
2035 |
Richard Newell, SAIS, December 14, 2009 |
Source: Annual Energy Outlook 2010 |
15 |
Shale gas has been the primary source of recent growth in
U.S. technically recoverable natural gas resources
trillion cubic feet
2250 |
|
|
|
|
|
|
|
|
|
|
|
2000 |
|
|
|
|
|
|
|
|
|
|
|
1750 |
|
|
|
|
|
|
|
|
|
|
|
1500 |
|
|
|
|
|
|
|
|
|
|
|
1250 |
|
|
|
|
|
|
|
|
|
|
|
1000 |
|
|
|
|
|
|
|
|
|
|
|
750 |
|
|
|
|
|
|
|
|
|
|
|
500 |
|
|
|
|
|
|
|
|
|
|
|
250 |
|
|
|
|
|
|
|
|
|
|
|
0 |
|
|
|
|
|
|
|
|
|
|
|
1999 |
2000 |
2001 |
2002 |
2003 |
2004 |
2005 |
2006 |
2007 |
2008 |
2009 |
2010 |
Unproved shale gas & other unconventional
Unproved conventional (including Alaska*)
Proved reserves
(all types & locations)
AEO edition
*Alaska resource estimates prior to AEO2009 reflect resources from the North Slope that were not included in previously published documentation.
Richard Newell, SAIS, December 14, 2009 |
Source: U.S. Geological Service, Mineral |
Management Service, private data, and EIA.16 |
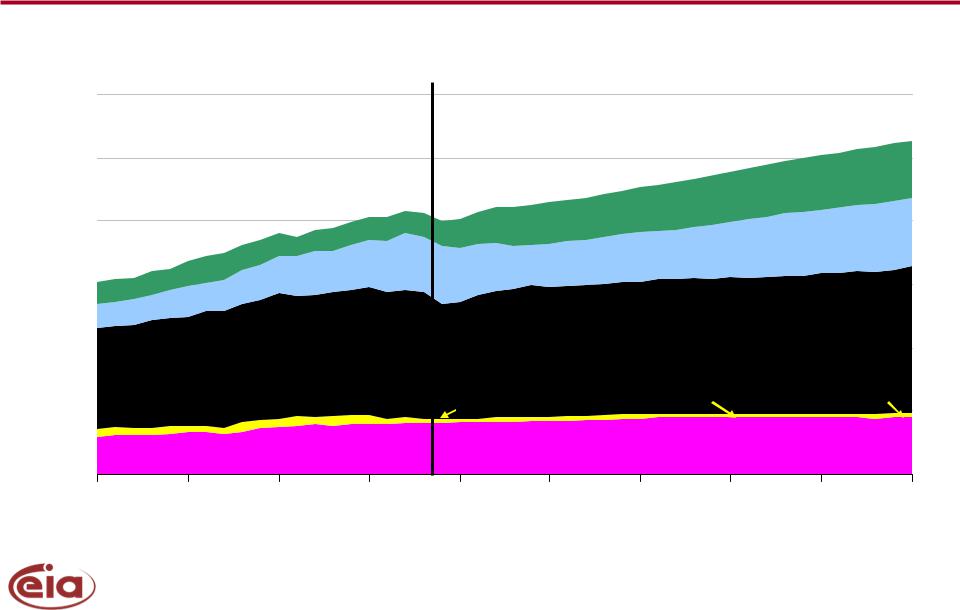
Shale gas and Alaska production offset declines in supply to meet consumption growth and lower import needs
trillion cubic feet
25 |
|
History |
|
|
|
Projections |
|
|
|
|
|
|
|
|
|
|
|
|
|
|
|
|
|
|
|
|
Alaska |
|
|
20 |
|
|
|
|
|
|
Shale gas |
|
|
15 |
|
|
|
|
|
|
Coalbed methane |
|
|
|
|
|
|
|
|
|
|
|
|
10 |
|
|
|
|
|
|
Non-associated onshore |
||
|
|
|
|
|
|
|
|
|
|
5 |
|
|
|
|
|
|
Non-associated offshore |
||
|
|
|
|
|
|
Associated with oil |
|
||
|
|
|
|
|
|
|
|
||
0 |
|
|
|
|
|
|
Net imports |
|
|
|
|
|
|
|
|
|
|
|
|
1990 |
1995 |
2000 |
2005 |
2010 |
2015 |
2020 |
2025 |
2030 |
2035 |
Richard Newell, SAIS, December 14, 2009 |
Source: Annual Energy Outlook 2010 |
17 |
Growth in electricity use continues to slow
3-year rolling average percent growth |
|
|
|
Period |
|
Annual Growth |
|||||||||
14 |
|
|
|
|
|
History |
|
|
1950s |
|
|
|
9.8 |
||
Str |
|
|
|
|
|
|
|
1960s |
|
|
|
7.3 |
|||
|
|
|
|
|
|
|
|
1970s |
|
|
|
4.7 |
|||
12 |
uct |
|
|
|
|
|
|
1980s |
|
|
|
2.9 |
|||
|
ural |
C |
|
|
|
|
|
|
|
|
|||||
|
|
|
han |
ge |
|
|
|
|
1990s |
|
|
|
2.4 |
||
|
|
|
|
|
|
|
|
|
|
|
|||||
|
|
|
|
i |
|
|
|
|
|
|
|
|
|
|
|
10 |
|
|
|
n |
E |
|
|
|
2000-2008 |
|
|
0.9 |
|||
|
|
|
|
|
conom |
|
|
|
|
|
|
|
|
|
|
|
|
|
|
|
y |
|
|
|
2008-2035 |
|
|
1.0 |
|||
|
|
|
|
|
- |
H |
|
|
|
|
|||||
8 |
|
|
|
|
|
i |
|
|
|
|
|
|
|
|
|
|
|
|
|
|
gher |
|
|
|
|
|
|
|
|
|
|
|
|
|
|
|
|
pr |
|
|
|
|
|
|
|
|
|
|
|
|
|
|
|
|
i |
|
|
|
|
Projections |
|||
|
|
|
|
|
|
|
ces - |
S |
|
|
|
||||
6 |
|
|
|
|
|
|
|
t |
|
|
|
|
|
|
|
|
|
|
|
|
|
|
an |
|
|
|
|
|
|
||
|
|
|
|
|
|
|
|
|
dar |
|
|
|
|
|
|
|
|
|
|
|
|
|
|
|
ds - |
|
|
|
|
|
|
|
|
|
|
|
|
|
|
|
I |
|
|
|
|
|
|
|
|
|
|
|
|
|
|
|
m |
|
|
|
|
|
|
|
|
|
|
|
|
|
|
|
p |
|
|
|
|
|
|
|
|
|
|
|
|
|
|
|
|
r |
|
|
|
|
|
4 |
|
|
|
|
|
|
|
|
|
o |
ved |
|
|
|
|
|
|
|
|
|
|
|
|
|
|
|
|
e |
|
|
|
|
|
|
|
|
|
|
|
|
|
|
|
|
f |
|
|
|
|
|
|
|
|
|
|
|
|
|
|
|
f |
|
|
|
|
|
|
|
|
|
|
|
|
|
|
|
i |
|
|
|
|
|
|
|
|
|
|
|
|
|
|
|
c |
|
|
|
|
|
|
|
|
|
|
|
|
|
|
|
i |
|
|
|
|
|
|
|
|
|
|
|
|
|
|
|
|
en |
|
2 |
|
|
|
|
|
|
|
|
|
|
|
|
|
cy |
|
|
|
|
|
|
|
|
|
|
|
|
|
|
|
|
|
0 |
|
|
|
|
|
|
|
|
|
|
|
|
|
|
|
-2 |
1960 |
1970 |
1980 |
1990 |
2000 |
2010 |
|
|
2020 |
|
2030 |
||||
1950 |
|
|
|
||||||||||||
Richard Newell, SAIS, December 14, 2009 |
Source: Annual Energy Outlook 2010 |
18 |

Natural gas and renewables account for the majority of capacity additions from 2008 to 2035
2008 capacity
Hydropower*
99 (10%)
Nuclear
101 (10%) Other
renewables |
1,008 |
||
40 |
(4%) |
||
gigawatts |
|||
|
|
||
Other 119 (12%)
|
|
|
Capacity additions |
||||
|
|
|
2008 to 2035 |
|
|||
|
|
|
|
Hydropower* |
|||
Coal |
|
Nuclear 1 (0.4%) |
|||||
|
8 |
(3%) |
|
Coal |
|||
312 |
(31%) |
31 |
(12%) |
||||
|
|
||||||
|
|
|
Other |
250 |
|
|
|
|
|
renewables |
|
|
|||
|
|
|
92 (37%) |
gigawatts |
|
|
|
|
|
Other |
Natural gas |
||
|
|
2 |
(1%) |
||
|
|
116 |
(46%) |
||
|
|
|
|
||
Natural gas |
|
|
|
|
|
338 |
(33%) |
* Includes pumped storage |
|||
|
|
||||
Richard Newell, SAIS, December 14, 2009 |
Source: Annual Energy Outlook 2010 |
19 |
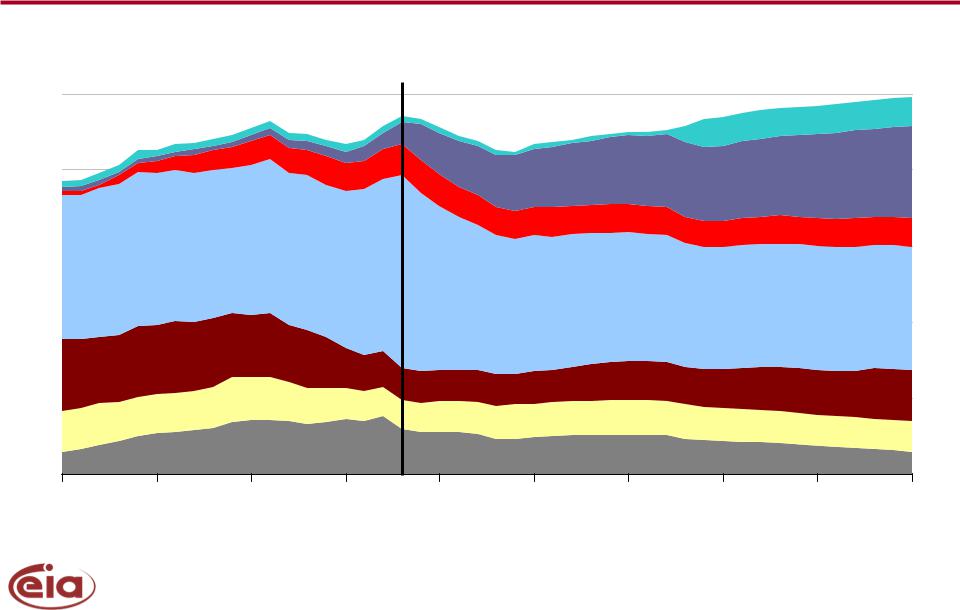
Renewables gain electricity market share; coal share declines
billion kilowatthours and percent shares
6,000 |
|
History |
|
|
|
Projections |
|
|
|
5,000 |
|
|
|
|
|
|
|
|
17.0 |
|
|
|
|
|
|
|
|
|
|
4,000 |
|
|
|
9.1 |
|
Renewable |
|
|
20.8 |
|
|
|
|
|
|
|
|
||
3,000 |
|
|
|
21.4 |
|
Natural gas |
|
|
|
|
|
|
|
|
|
|
|
||
|
|
|
|
|
|
|
|
|
|
2,000 |
|
|
|
48.5 |
|
Coal |
|
|
43.8 |
|
|
|
|
|
|
|
|
||
1,000 |
|
|
|
1.5 |
|
Oil and other |
|
1.4 |
|
|
|
|
|
|
|
|
|
|
|
0 |
|
|
|
19.6 |
|
Nuclear |
|
|
17.1 |
|
|
|
|
|
|
|
|
|
|
1990 |
1995 |
2000 |
2005 |
2010 |
2015 |
2020 |
2025 |
2030 |
2035 |
Richard Newell, SAIS, December 14, 2009 |
Source: Annual Energy Outlook 2010 |
20 |