

СЭГ Мира / 1 семестр / ПРАКТИКУМ СЭГ мира,часть 1 / ХРЕСТОМАТИЯ электронная / 02 ТОПЛИВНО-ЭНЕРГЕТИЧ КОМПЛЕКС 2008 / ИНФОРМАЦИОННЫЙ БЮЛЛЕТЕНЬ SAIS
.pdfNonhydropower renewable sources meet 41% of total electricity generation growth from 2008 to 2035
billion kilowatthours
600 |
|
History |
|
|
|
Projections |
|
|
|
500 |
|
|
|
|
|
|
|
|
|
400 |
|
|
|
|
|
|
Biomass |
|
|
|
|
|
|
|
|
|
|
||
300 |
|
|
|
|
|
|
|
|
|
200 |
|
|
|
|
|
|
Wind |
|
|
100 |
|
|
|
|
|
Solar |
|
Geothermal |
|
0 |
|
|
|
|
|
|
Waste |
|
|
1990 |
1995 |
2000 |
2005 |
2010 |
2015 |
2020 |
2025 |
2030 |
2035 |
Richard Newell, SAIS, December 14, 2009 |
Source: Annual Energy Outlook 2010 |
21 |
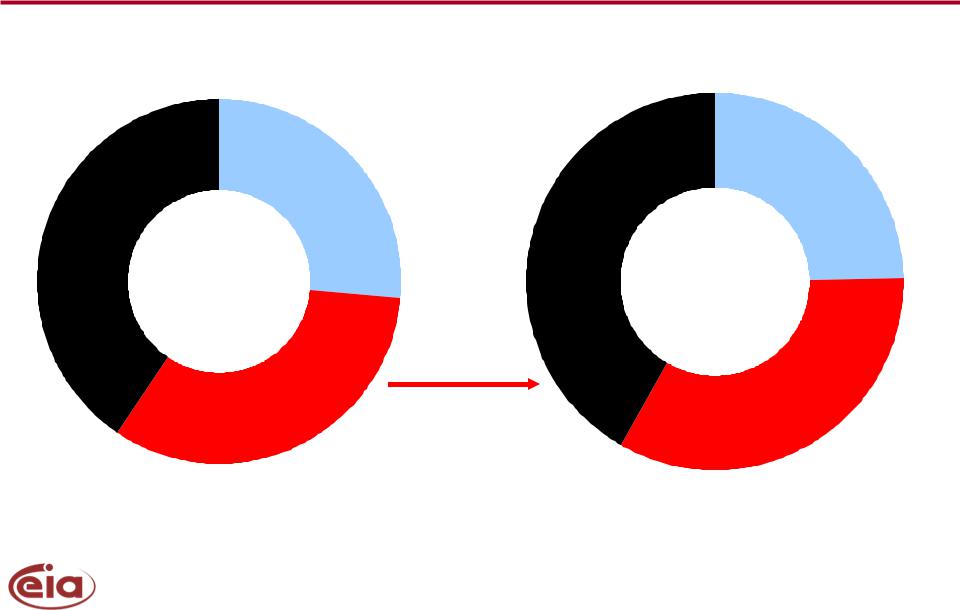
Assuming no new policies, growth in energy-related CO2 is driven by electricity and transportation fuel use
2008 |
|
|
Electric Power |
2035 |
Buildings and |
Electric Power |
|
|
|
||
Buildings and |
|
Industrial |
|||
2,359 (41%) |
2,634 (42%) |
|
1,571 (25%) |
||
Industrial |
|
||||
|
1,530 |
(26%) |
|
|
|
5,814 |
6,320 |
million metric |
million metric |
tons |
tons |
8.7% growth
0.3% per year
Transportation
1,925 (33%) Transportation
2,115 (33%)
Richard Newell, SAIS, December 14, 2009 |
Source: Annual Energy Outlook 2010 |
22 |

Key results from the AEO2010 reference case
•Recent Federal and State policies, and rising energy prices, moderate growth in energy consumption and shift it to renewable fuels
•U.S. oil use remains near its present level through 2035
–growth in overall liquids demand is met by biofuels, and ethanol accounts for >17% of gasoline consumption by 2035
–U.S. reliance on imported oil as a share of U.S. liquids use, declines to 45% over the next 25 years
•Shale gas provides the majority of growth in gas supply
•Energy-related CO2 emissions grow 0.3% per year, absent any new policies to limit emissions
Richard Newell, SAIS, December 14, 2009 |
23 |

For more information
U.S. Energy Information Administration home page |
www.eia.gov |
|
Short-Term Energy Outlook |
www.eia.gov/emeu/steo/pub/contents.html |
|
Annual Energy Outlook |
www.eia.gov/oiaf/aeo/index.html |
|
International Energy Outlook |
www.eia.gov/oiaf/ieo/index.html |
|
Monthly Energy Review |
www.eia.gov/emeu/mer/contents.html |
|
U.S. Energy Information Administration
www.eia.gov
Richard Newell, SAIS, December 14, 2009 |
24 |