

Статистика пожаров / National Fire Protection Association / Large-loss fires in the United States 2007
.pdfLARGE-LOSS FIRES IN THE UNITED STATES-2007
Stephen G. Badger
Fire Analysis and Research Division
National Fire Protection Association
November 2008
National Fire Protection Association, 1 Batterymarch Park, Quincy, MA 02169-7471
www.nfpa.org

LARGE-LOSS FIRES IN THE UNITED STATES-2007
Stephen G. Badger
Fire Analysis and Research Division
National Fire Protection Association
November 2008
National Fire Protection Association, 1 Batterymarch Park, Quincy, MA 02169-7471
www.nfpa.org
Acknowledgements
NFPA thanks the U.S. fire service for its contributions of data, without which this report would not be possible. In many cases, the fire departments were unable to contribute complete details to the NFPA because legal action is pending or ongoing, or they are unable to determine many pieces of information we need to make our study as complete as possible. The author wishes to thank Rita Fahy and Norma Candeloro for providing the support this study requires.
For more information about the National Fire Protection Association, visit www.nfpa.org or call 617-770-3000. To learn more about the One-Stop Data Shop go to www.nfpa.org/osds or call 617-984-7443.
Copies of this analysis are available from:
National Fire Protection Association One-Stop Data Shop
1 Batterymarch Park Quincy, MA 02169-7471 www.nfpa.org
e-mail: osds@nfpa.org phone: 617-984-7443
NFPA No. LLS07
Copyright © 2008, National Fire Protection Association, Quincy, MA
Introduction
In mid-October, Southern California was in a drought, with only five inches (12.7 centimeters) of rain since January. Santa Ana winds were forecast for a wide area. The winds, along with temperatures in the nineties F (low thirties C), created the scenario that led to one of the costliest fire seasons in recent memory. At approximately 9:42 pm on October 20th, the first fire erupted. Within a week, at least 23 named fires broke out. These fires would became known, collectively, as the Southern California Firestorm of 2007. The governor issued a state of emergency for several of the hardest-hit counties. The Fire Districts Association of California estimated that approximately a million people were evacuated or fled the approaching fires, heading to emergency shelters or to relatives and friends. Firefighters set up unified command systems at all the fires and directed operations. Several of the named fires burned together to form larger fires. Resources were strained for fire suppression crews.
Officials reported there were several different sources of ignition, including incendiary acts, power lines damaged by the Santa Ana winds, a vehicle crash, and a youngster playing with matches. Mother Nature played a large role in these fires as well: a deficit in rainfall, temperatures well over 90 degrees F (32 degrees C), relative humidity as low at 10 to 15 percent, and hurricane-strength Santa Ana winds, over 75 mph (121 kph) with gusts of over 100 mph (161 kph).
By the time the week ended, the fires had burned over 518,000 acres (210,000 hectares) and destroyed over 3,108 structures, including 2,180 residential properties. More than 500 other structures suffered damage and 239 vehicles were destroyed. It has been estimated that damage to agriculture in the area was over $47 million.
At the time these major fires were burning, over 250 additional fires broke out. These fires were contained to less than 10 acres (4 hectares) each. More than 1,100 fire departments throughout California and across the United States, as well as several countries around the world, sent aid. Police departments, specially trained fire crews of prison inmates, and county and state officials also responded.
Loss estimates have varied, but the most reliable reported figure is $1.8 billion in property damage. Tragically, the fires claimed at least 10 lives. Four additional deaths not involving fire effects occurred during evacuation.
NFPA reports each year on large-loss fires and explosions in the United States, defined as any event that results in property damage of at least $5 million. In 2007, fire departments
Large-Loss Fires-2007, 11/08 |
1 |
NFPA, Fire Analysis and Research, Quincy, MA |

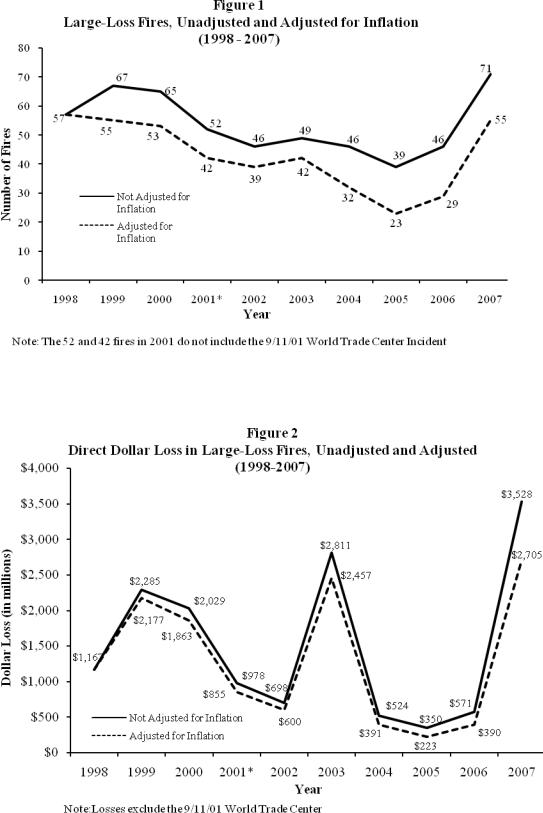
responded to an estimated 1,557,500 fires that caused an estimated loss of $14.6 billion.1 Many of these fires were small or had little or no property damage reported; however, 71 fires resulted in losses of $5 million or more each. Together these large-loss fires resulted in over $3.5 billion in direct property loss, killed 19 civilians, and injured 168 firefighters and 67 civilians. These 71 fires accounted for only 0.005 percent of the estimated number of fires in 2007, but accounted for 24.1 percent of the total estimated dollar loss.
There were 25 more large-loss fires in 2007 than there were in 2006, an increase of over 54 percent in the number of large-loss fires. The total property loss in large-loss fires was up by almost $3 billion, which meant that the 2007 total was more than six times the total in 2006. Most of this increase, and half the large-loss total for 2007, occurred in the Southern California Firestorm alone. In fact, large-loss wildland fires excluding the Southern California Firestorm accounted for more total loss than the large-loss total for all of 2006.
When adjusted for inflation to 1998 dollars, the number of large-loss fires in 2007 was the highest since 1999. Adjusted total loss in those fires was the highest since 2001, when the September 11 attacks on the World Trade Center occurred. (See Table 1, Figures 1 and 2).
The Southern California Firestorm of 2007 was one of 20 fires that caused more than $20 million in property damage. (See Table 2). Of these 20 fires, 13 were structure fires, six were wildland fires and one was a vehicle fire. Together they resulted in a combined loss of $3 billion, which represents 85.7 percent of the total large-loss fire losses, and 20.5 percent of the total fire losses in 2007. The Southern California Firestorm was also one of five fires in 2007 with a loss of over $100 million. The combined losses for these fires was $2.5 billion, or 61.4 percent of the large-loss losses and 17.1 percent of the total fire losses in 2007.
From 1998 to 2006, there was a generally downward trend in the number of large-loss fires and explosions, but the 2007 total was a sharp departure from that trend. Total loss in largeloss fires is too sensitive to the specific loss in the costliest incidents each year to show any clear trend.
Where fires occurred
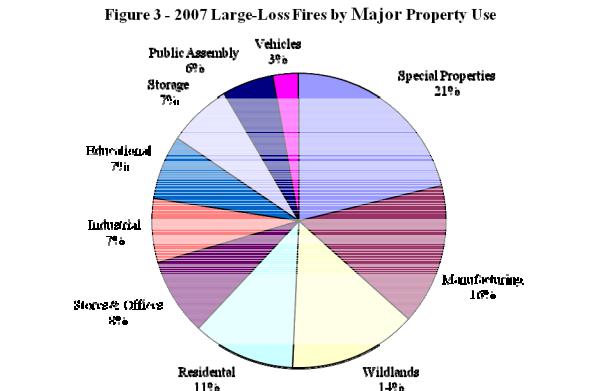
In 2007, 71 large-loss fires occurred in all major property categories, except healthcare and correctional facilities. (See Table 3 and Figure 3). Fifty-nine of the 71 fires occurred in structures, causing a total loss of $946.7 million. Ten wildland fires resulted in losses of $2.4 billion. There were two vehicle fires, resulting in losses of $107.5 million. One of these fires involved a gasoline tanker truck crash and fire that affected a series of roadway overpasses.
1 Michael J. Karter Jr., ”Fire Loss in the United States During 2007,” NFPA Journal, September/October 2008.
Large-Loss Fires-2007, 11/08 2 NFPA, Fire Analysis and Research, Quincy, MA
Fifteen of the 59 structure fires occurred in special structures, including 10 buildings under construction, three vacant or idle properties, a pier, and a boardwalk. These fires resulted in $211 million in losses.
Eleven fires occurred in manufacturing plants, resulting in losses of $269.8 million.
Eight fires in residential structures resulted in losses of $78.5 million. Of these eight fires, five occurred in apartment buildings, two in single-family homes, and one in a lodging or rooming house.
Six fires in stores and office properties resulted in losses of $100.1 million. Five of these six fires were in stores and one occurred in an office building)
Five fires each occurred in industrial properties, educational properties (including two high schools, two elementary schools and a college building), and storage properties, resulting in losses of $100.0 million, $75.3 million, and $71.5 million, respectively.
Four fires occurred in public assembly properties -- two churches, a library and a country club clubhouse -- resulting in losses of $30.5 million.
Information on operating status was reported for 49 of the 59 structure fires. Twenty-seven were operating to some extent. Twenty-two were at full operation or occupancy, three had construction workers on site, one was partially operating, and one had security present.
Twenty-two properties were closed or were not known to have anyone on site when the fire broke out.
The cause was reported for 33 of the structure fires, three of the wildland fires, and one of the vehicle fires. Ten of the structure fires were confirmed as incendiary and two others were suspected incendiary. The 10 incendiary fires were responsible for five of the 19 deaths; there were no deaths in the two suspicious fires.
Twenty-four of the fires broke out between 11:00 pm and 7:00 am. Twenty-one of these were in structures, one in wildlands, and two in vehicles. The cause was known in 12 of these fires, with five being confirmed incendiary. Of these five, four occurred in closed properties and one in a property that was operating.
Detection and suppression systems
Information about smoke detection equipment was reported for 41 of the 59 structure fires. Twenty-one of these 41 properties (51 percent) had some type of automatic detection equipment present. Twenty fires occurred in properties with no automatic detection equipment. Of the 21 properties that had equipment, five had complete coverage systems -- three with smoke detection and two with automatic detection of an unreported type. Two were partially covered with smoke detection systems. Five other structures had smoke
Large-Loss Fires-2007, 11/08 |
3 |
NFPA, Fire Analysis and Research, Quincy, MA |
detection equipment, but the coverage of these systems was not reported. Eleven of the 21 systems operated effectively, while four systems failed to operate -- three were not operational yet and one had been shut down prior to the fire because the building was vacant. The operation or effectiveness of six of the system was not reported.
Information on automatic suppression equipment was reported for 48 of the 59 structure fires. Twenty-eight structures had no suppression equipment at all. For the 20 structures with systems, all were sprinkler systems. Of the 20, 10 were wet-pipe systems, two were dry-pipe systems, and two were combination wet and dry-pipe sprinkler systems. The other six were reported simply as sprinkler systems, with no type reported.
Five sprinkler systems were complete coverage. Of these, two were wet-pipe systems, two were combination systems, and one system type was not specified. Five systems had partial coverage. Of these, two were wet-pipe systems, one was a dry-pipe system and two were not specified. The coverage of 10 systems was not reported.
Ten of the 20 systems operated. Two of those 10 were partial-coverage systems that operated as designed, keeping the fire out of the protected area. Eight systems operated but were not effective -- one because sprinklers were not in the area of the fire, one due to poor maintenance, another due to poor head clearance, one due to a lack of enough agent available (no explanation was given), one because the main valve in the part of the system in the area of origin was padlocked shut, and three for unreported reasons. Eight systems did not operate. Four of these had been shut off prior to the fire for various reasons, three systems were being installed and not yet operable, and no reason was given in the eighth case.
Complete information on both detection and suppression equipment was reported for 39 of the 59 structure fires. Eleven had only detection equipment, seven had only suppression equipment, eight had both detection and suppression, and 13 properties (22 percent of all structures) had no coverage.
What we can learn
Each year’s large-loss study focuses on the relatively small number of fires that account for a significant portion of the dollar loss that year. In the case of 2007, 71 fires accounted for approximately a quarter of the year’s losses. Details on all 71 large-loss fires in 2007 can be found in Table 4.
As stated earlier, the number of large-loss fires increased by over 50 percent, and the property loss increased by over $3 billion, over half of which was the result of one fire incident. In seven of the past 10 years, at least one fire has caused a loss of over $100 million. In 2007, there were five such incidents, resulting in a total loss of $2.5 billion. In the past 10 years, there have been eight wildland fires that each resulted in more than $100 million in losses.
Large-Loss Fires-2007, 11/08 |
4 |
NFPA, Fire Analysis and Research, Quincy, MA |
Adherence to the fire protection principles reflected in NFPA's codes and standards is essential if we are to succeed in reducing the occurrence of large-loss fires and explosions in the United States. A range of ignition causes and factors were reported among the large-loss fires in 2007, including incendiary, abandoned or discarded smoking materials, mechanical or part failures, short circuits, combustibles too close and unattended candle. Proper design, maintenance and operation of fire protection systems and features can keep a fire from becoming a large-loss fire. Proper construction, storage methods, and housecleaning will make fires less likely and help control or limit the fire spread, if fire occurs.
Financial and economic losses are one thing, but the emotional toll of losing your dreams and future hopes cannot be calculated in dollars. That is one thing all the fires in this report have in common.
Where we get our data
NFPA identifies potential large-loss fires and explosions by reviewing national and local news media, including fire service publications. A clipping service reads all U.S. daily newspapers and notifies NFPA's Fire Analysis and Research Division of major large-loss fires. The NFPA's annual survey of the U.S. fire experience is an additional data source, although not the principal one. Once an incident has been identified, we request information on the fire from the fire department or the agency having jurisdiction. We also contact federal agencies that have participated in investigations, the state fire marshal's offices, and military sources.
The diversity and redundancy of these data sources enables NFPA to collect the most complete data available on large-loss fires.
About the author
Stephen G. Badger is a member of the NFPA Fire Analysis and Research Division, and is also a retired firefighter from the Quincy, Massachusetts, Fire Department.
Large-Loss Fires-2007, 11/08 |
5 |
NFPA, Fire Analysis and Research, Quincy, MA |
Large-Loss Fires-2007, 11/08 |
6 |
NFPA, Fire Analysis and Research, Quincy, MA |
Large-Loss Fires-2007, 11/08 |
7 |
NFPA, Fire Analysis and Research, Quincy, MA |