

металлы экономика
.pdfvk.com/id446425943C O N T R I B U T O R S
|
Editorial-board member |
|
|
External contributor |
|
||||||
|
|
|
|
||||||||
|
|
|
|
|
|
|
|
|
|
|
|
|
|
|
|
|
|
|
|
|
|
|
|
|
|
|
|
|
|
|
|
|
|
|
|
Anita Balchandani |
Achim Berg |
Peter Breuer |
|
Verena Dellago |
Mark Dziersk |
|||
Partner |
Senior partner |
Senior partner |
|
Practice manager |
Partner |
|||
London |
Frankfurt |
Cologne |
|
Munich |
Chicago |
|||
|
|
|
|
|
|
|
|
|
|
|
|
|
|
|
|
|
|
|
|
|
|
|
|
|
|
|
Tracy Francis |
Stacey Haas |
Saskia Hedrich |
|
Jan Henrich |
|
Miriam Heyn |
||
Senior partner |
Partner |
Senior expert |
|
Senior partner |
|
Partner |
||
Sao Paulo |
Detroit |
Munich |
|
Chicago |
|
Berlin |
||
|
|
|
|
|
|
|
|
|
|
|
|
|
|
|
|
|
|
|
|
|
|
|
|
|
|
|
Steve Hoffman |
Jess Huang |
Daniel Hui |
|
Greg Kelly |
Sajal Kohli |
|||
Partner |
Partner |
Partner |
|
Senior partner |
Senior partner |
|||
Chicago |
Silicon Valley |
Hong Kong |
|
Atlanta |
Chicago |
|||
|
|
|
|
|
|
|
|
|
|
|
|
|
|
|
|
|
|
|
|
|
|
|
|
|
|
|
Udo Kopka |
Dymfke Kuijpers |
Christoph Kuntze |
Jörn Küpper |
Shruti Lal |
|||||
Senior partner |
Senior partner |
Partner |
Senior partner |
Senior practice manager |
|||||
Chicago |
Singapore |
Miami |
Cologne |
Chicago |
|||||
|
|
|
|
|
|
|
|
|
|
|
|
|
|
|
|
|
|
|
|
|
|
|
|
|
|
|
|
|
|
Daniel Läubli |
Ed Little |
Max Magni |
Clarisse Magnin |
Adrian Martin |
Partner |
Senior partner |
Senior partner |
Senior partner |
Associate partner |
Zurich |
Dallas |
New Jersey |
Paris |
Chicago |
88 |
Perspectives on retail and consumer goods Number 7, January 2019 |

vk.com/id446425943
|
|
|
|
|
|
|
|
|
|
|
|
|
|
|
|
|
|
Anne Martinez |
Jon McClain |
Paul McInerney |
Jessica Moulton |
Nora Ottink |
||||
Knowledge expert |
Associate partner |
Senior partner |
Partner |
Partner |
||||
Stamford |
Washington, DC |
Tokyo |
London |
Amsterdam |
||||
|
|
|
|
|
|
|
|
|
|
|
|
|
|
|
|
|
|
|
|
|
|
|
|
|
|
|
Kevin Ozan |
Alana Podreciks |
Felix Poh |
Brian Quinn |
Colin Regnier |
||||
CFO |
Solution manager |
Partner |
Partner |
Consultant |
||||
McDonald’s |
New York |
Shanghai |
Chicago |
Stamford |
||||
|
|
|
|
|
|
|
|
|
|
|
|
|
|
|
|
|
|
Alex Rodriguez |
|
Felix Rölkens |
Alex Sawaya |
Kandarp Shah |
Bernardo Sichel |
|||
Partner |
|
Associate partner |
Partner |
Partner |
Partner |
|||
Miami |
|
Berlin |
Hong Kong |
New Jersey |
Chicago |
|||
|
|
|
|
|
|
|
|
|
|
|
|
|
|
|
|
|
|
Patrik Silén |
|
Ildefonso Silva |
Virginia Simmons |
Patrick Simon |
Nathan Uhlenbrock |
||
Partner |
|
Partner |
Partner |
Partner |
Senior expert |
||
London |
|
Chicago |
Chicago |
Munich |
Waltham |
||
|
|
|
|
|
|
|
|
|
|
|
|
|
|
|
|
|
|
|
|
|
|
|
|
Kelly Ungerman |
Jasper van Wamelen |
Tobias Wachinger |
Simon Wintels |
Partner |
Associate partner |
Senior partner |
Partner |
Dallas |
New Jersey |
Munich |
Singapore |
Contributors |
89 |

vk.com/id446425943R E G I O N A L L E A D E R S
Global |
• Middle East |
• United Kingdom and Ireland |
Greg Kelly |
Gemma D’Auria |
Jessica Moulton |
Greg_Kelly@McKinsey.com |
Gemma_DAuria@McKinsey.com |
Jessica_Moulton@McKinsey.com |
|
• Turkey |
|
Asia |
Ilke Bigan |
Latin America |
Paul McInerney |
Ilke_Bigan@McKinsey.com |
Tracy Francis |
Paul_McInerney@McKinsey.com |
|
Tracy_Francis@McKinsey.com |
• Australia |
Europe |
• Brazil |
Jenny Cermak |
Jörn Küpper |
Tracy Francis |
Jenny_Cermak@McKinsey.com |
Joern_Kuepper@McKinsey.com |
Tracy_Francis@McKinsey.com |
Joseph Tesvic |
• Consumer Goods |
• Spanish Latin America |
Joseph_Tesvic@McKinsey.com |
Clarisse Magnin |
Rogerio Hirose |
|
Clarisse_Magnin@McKinsey.com |
Rogerio_Hirose@McKinsey.com |
• Greater China |
|
|
Daniel Zipser |
• Retail |
|
Daniel_Zipser@McKinsey.com |
Tobias Wachinger |
North America |
|
Tobias_Wachinger@McKinsey.com |
|
• India |
|
Consumer Goods |
Vikash Daga |
• Austria, Germany, |
Jan Henrich |
Vikash_Daga@McKinsey.com |
and Switzerland |
Jan_Henrich@McKinsey.com |
|
Tobias Wachinger |
|
• Japan and Korea |
Tobias_Wachinger@McKinsey.com |
Retail |
Naoyuki Iwatani |
|
Sajal Kohli |
Naoyuki_Iwatani@McKinsey.com |
• Central Europe |
Sajal_Kohli@McKinsey.com |
|
Wojtek Bogdan |
|
• Southeast Asia |
Wojtek_Bogdan@McKinsey.com |
• Mexico |
Rohit Razdan |
|
Eduardo Malpica |
Rohit_Razdan@McKinsey.com |
Jurica Novak |
Eduardo_Malpica@McKinsey.com |
|
Jurica_Novak@McKinsey.com |
|
|
|
• Midwest |
Eastern Europe, Middle East, |
• France |
Kristi Weaver |
and Africa |
Clarisse Magnin |
Kristi_Weaver@McKinsey.com |
Peter Breuer |
Clarisse_Magnin@McKinsey.com |
|
Peter_Breuer@McKinsey.com |
|
• Northeast/Mid-Atlantic |
|
• Iberia |
Danielle Bozarth |
• Africa |
Ignacio Marcos |
Danielle_Bozarth@McKinsey.com |
Damian Hattingh |
Ignacio_Marcos@McKinsey.com |
|
Damian_Hattingh@McKinsey.com |
|
• South |
|
• Northern Europe |
Duncan Miller |
• Commonwealth of |
Philip Christiani |
Duncan_Miller@McKinsey.com |
Independent States |
Philip_Christiani@McKinsey.com |
|
Alex Sukharevsky |
|
• West Coast |
Alex_Sukharevsky@McKinsey.com |
• Mediterranean |
David Brown |
|
Antonio Achille |
David_Brown@McKinsey.com |
|
Antonio_Achille@McKinsey.com |
|
90 |
Perspectives on retail and consumer goods Number 7, January 2019 |

vk.com/id446425943

vk.com/id446425943

vk.com/id446425943
vk.com/id446425943
January 2019
Designed by Global Editorial Services Copyright © McKinsey & Company
This McKinsey Practice Publication meets the Forest Stewardship Council® (FSC®) chain-of-custody standards. The paper used in
this publication is certified as being produced in an environmentally responsible, socially beneficial, and economically viable way.
Printed in the United States of America.

vk.com/id446425943
Industry Top Trends 2019
Metals and Mining
November 12, 2018
Key Takeaways
–Ratings Outlook: The outlook for upstream producers largely improved in 2018, with a modestly positive rating bias. We expect the focus on financial prudence--particularly among the largest globally diversified miners--to continue in 2019 amid what we assume will be a continuing generally supportive price environment. For global downstream producers, we expect stable conditions, with upgrades now likely to reflect financial policies and resilience to future downturns as much as strong metrics.
–Forecasts: Our base assumptions result in credit measures improving modestly in 2019 for upstream and downstream producers. Lower net debt is primary cause for the improvement, given our relatively flat price and output expectations for next year. However, we haven't factored in any potential negative impact from the U.S.-China trade war on global demand and prices, which could lead to deviations from our base-case projections.
–Assumptions: Generally stable prices for most metals and mining commodities over the next two years; reflecting our assumption of balanced global supply/demand conditions. We also expect the debt reduction cycle to continue, which should build issuers’ resilience to potential downturns, assuming judicious use of discretionary cash flow for investments and shareholder-friendly initiatives, at least in 2019.
–Risks: China remains the primary force behind the fundamentals of the metals and mining industry. Slowing demand from China or an unexpected ramp-up of steel and aluminum output remain key risks that could disrupt relatively balanced conditions for most metals and mining commodity markets. However, ongoing supply-side reforms could also lead to stronger-than-expected market fundamentals for certain commodities. Additionally, foreign currency becomes a greater risk, given the historical negative correlation between the U.S. dollar and metals prices, and as U.S. coal producers’ shift to export markets to offset domestic thermal decline. Overall, we expect prices to remain volatile, with fluctuations likely related to developments in China and potentially due to other government policies and geopolitical risks.
–Industry Trends: We expect the prevailing mood of balance sheet conservatism to continue into 2019 for most upstream and downstream producers. However, we believe shareholder remuneration will start to increase--in some cases because of financial policy frameworks--and could emerge as a possible risk to financial profiles. That said, prudent financial policy implementation should support ratings, provided that cash generation funds shareholder returns to ensure that balance sheets have cushion for future downturns.
S&P Global Ratings
Authors
Vania Dimova
New York
+1 212 438 0447 vania.dimova@spglobal.com
Jarrett Bilous
Toronto
+1 416 507 2593 jarrett.bilous@spglobal.com
William Ferara
New York
+1 212 438 1776 bill.ferara@spglobal.com
Sergei Gorin
Moscow
+ 7 49 5783 4132 sergei.gorin@spglobal.com
Danny Huang
Hong Kong +852 2532 8078
danny.huang@spglobal.com
Elad Jelasko
London
+44 207 176 7013 elad.jelasko@spglobal.com
Donald Marleau
Toronto
+1 416 507 2526 donald.marleau@spglobal.com
Diego Ocampo
Buenos Aires +5411 4891 2116
diego.ocampo@spglobal.com
Simon Redmond
London
+44 (0)207 176 3683 simon.redmond@spglobal.com
Chiza Vitta
Dallas
+1 214 765 5864 chiza.vitta@spglobal.com
May Zhong
Melbourne 613-9631-2164 may.zhong@spglobal.com
1
vk.com/id446425943
Industry Top Trends 2019: Metals and Mining
Ratings trends and outlook
Global Metals and Mining
Chart 1 |
|
|
|
|
|
Chart 2 |
|
|
|
|
|
|
|
|
|
|
|
|
|
|
|
|
||||||||||||||||||||
Ratings distribution |
|
|
|
|
|
Ratings distribution by region |
|
|
|
|
|
|
|
|||||||||||||||||||||||||||||
|
|
|
|
Metals & Mining |
|
|
|
|
|
|
|
|
North America |
|
W.Europe |
|
|
|||||||||||||||||||||||||
|
|
|
|
|
|
|
|
|
|
|
|
|
|
|
||||||||||||||||||||||||||||
50 |
|
|
|
50 |
|
|
|
|
|
Asia-Pacific |
|
Latin America |
||||||||||||||||||||||||||||||
|
|
|
|
|
|
|
|
|
|
|
|
|
|
|
|
|
|
|
|
|||||||||||||||||||||||
|
|
|
|
|
|
|
|
|
|
|
|
|
|
|
|
|
|
|
|
|||||||||||||||||||||||
|
|
|
|
|
|
|
|
|
|
|
|
|
|
|
|
|
|
|
|
|||||||||||||||||||||||
|
|
|
|
|
|
|
|
|
|
|
|
|
|
|
|
|
|
|
|
|
|
|
|
|
|
|
|
|
|
|
|
|
|
|
|
|
|
|
||||
40 |
|
|
|
|
|
|
|
|
|
|
|
|
|
|
40 |
|
|
|
|
|
|
|
|
|
|
|
|
|
|
|
|
|
|
|
|
|
|
|
|
|
||
|
|
|
|
|
|
|
|
|
|
|
|
|
|
|
|
|
|
|
|
|
|
|
|
|
|
|
|
|
|
|
|
|
|
|
|
|
|
|
||||
30 |
|
|
|
|
|
|
|
|
|
|
|
|
|
|
30 |
|
|
|
|
|
|
|
|
|
|
|
|
|
|
|
|
|
|
|
|
|
|
|
|
|
||
|
|
|
|
|
|
|
|
|
|
|
|
|
|
|
|
|
|
|
|
|
|
|
|
|
|
|
|
|
|
|
|
|
|
|
|
|
|
|
||||
20 |
|
|
|
|
|
|
|
|
|
|
|
|
|
|
20 |
|
|
|
|
|
|
|
|
|
|
|
|
|
|
|
|
|
|
|
|
|
|
|
|
|
||
|
|
|
|
|
|
|
|
|
|
|
|
|
|
|
|
|
|
|
|
|
|
|
|
|
|
|
|
|
|
|
|
|
|
|
|
|
|
|
||||
10 |
|
|
|
|
|
|
|
|
|
|
|
|
|
|
10 |
|
|
|
|
|
|
|
|
|
|
|
|
|
|
|
|
|
|
|
|
|
|
|
|
|
||
|
|
|
|
|
|
|
|
|
|
|
|
|
|
|
|
|
|
|
|
|
|
|
|
|
|
|
|
|
|
|
|
|
|
|
|
|
|
|
||||
0 |
|
|
|
|
|
|
|
|
|
|
|
|
|
|
0 |
|
|
|
|
|
|
|
|
|
|
|
|
|
|
|
|
|
|
|
|
|
|
|
|
|
||
|
AAA AA+ AA AA- A+ A A- BBB+ BBB BBBBB+ BB BB- |
B+ B B- CCC+ CCC CCCCC C SD D |
|
AAA AA+ AA AA- A+ A A- BBB+ BBB BBBBB+ BB BB- B+ B B- CCC+ CCC CCCCC C SD D |
||||||||||||||||||||||||||||||||||||||
|
|
|
|
|
|
|||||||||||||||||||||||||||||||||||||
Chart 3 |
|
|
|
|
|
Chart 4 |
|
|
|
|
|
|
|
|
|
|
|
|
|
|
|
|
||||||||||||||||||||
Ratings outlooks |
|
|
|
|
|
Ratings outlooks by region |
|
|
|
|
|
|
|
|||||||||||||||||||||||||||||
|
|
Positive |
Negative |
|
|
Negative |
|
WatchNeg |
|
|
Stable |
|
|
WatchPos |
|
Positive |
||||||||||||||||||||||||||
15% |
|
|
|
|
|
|
9% |
|
|
|
|
|
|
|
|
|||||||||||||||||||||||||||
|
|
|
|
|
|
|
|
|
|
|
|
|
||||||||||||||||||||||||||||||
|
|
|
|
|
|
|
|
|
|
|
|
|
|
|
|
|
|
|
|
|
|
|
|
|
|
|
|
|
|
|
|
|
|
|
||||||||
|
|
WatchPos |
|
|
|
WatchNeg |
100% |
|
|
|
|
|
|
|
|
|
|
|
|
|
|
|
|
|
|
|
|
|
|
|
||||||||||||
|
|
2% |
|
|
|
|
|
|
|
|
|
|
|
|
|
|
|
|
|
|
|
|
|
|
|
|||||||||||||||||
|
|
|
|
|
|
|
|
|
|
|
|
|
|
|
|
|
|
|
|
|
|
|
|
|
|
|
|
|
|
|||||||||||||
1% |
|
|
|
|
|
|
|
|
|
|
|
|
80% |
|
|
|
|
|
|
|
|
|
|
|
|
|
|
|
|
|
|
|
|
|
|
|
||||||
|
|
|
|
|
|
|
|
|
|
|
|
|
|
|
|
|
|
|
|
|
|
|
|
|
|
|
|
|
|
|
|
|
|
|
||||||||
|
|
|
|
|
|
|
|
|
|
|
|
|
|
|
60% |
|
|
|
|
|
|
|
|
|
|
|
|
|
|
|
|
|
|
|
|
|
|
|
||||
|
|
|
|
|
|
|
|
|
|
|
|
|
|
|
|
|
|
|
|
|
|
|
|
|
|
|
|
|
|
|
|
|
|
|
|
|
|
|||||
|
|
|
|
|
|
|
|
|
|
|
|
|
|
|
40% |
|
|
|
|
|
|
|
|
|
|
|
|
|
|
|
|
|
|
|
|
|
|
|
||||
|
|
|
|
|
|
|
|
|
|
|
|
|
|
|
|
|
|
|
|
|
|
|
|
|
|
|
|
|
|
|
|
|
|
|
|
|
|
|||||
|
|
|
|
|
|
|
Stable |
|
|
|
|
|
20% |
|
|
|
|
|
|
|
|
|
|
|
|
|
|
|
|
|
|
|
|
|
|
|
||||||
|
|
|
|
|
|
|
|
|
|
|
|
|
|
|
|
|
|
|
|
|
|
|
|
|
|
|
|
|
|
|
|
|
|
|
||||||||
|
|
|
|
|
|
|
|
|
|
|
|
0% |
|
|
|
|
|
|
|
|
|
|
|
|
|
|
|
|
|
|
|
|
|
|
|
|||||||
|
|
|
|
|
|
|
|
|
|
|
|
|
|
|
|
|
|
|
|
|
|
|
|
|
|
|
|
|
|
|
|
|
|
|
||||||||
73% |
|
|
|
|
|
|
|
|
|
|
|
|
|
|
|
|
|
|
|
|
|
|
|
|
|
|
|
|
||||||||||||||
|
|
|
|
|
|
|
|
APAC |
LatAm N.America |
W.Eur |
||||||||||||||||||||||||||||||||
|
|
|
|
|
|
|
|
|
|
|
|
|
||||||||||||||||||||||||||||||
|
|
|
|
|
|
|
|
|
|
|
|
|
|
|
|
|
|
|
|
|
|
|
||||||||||||||||||||
Chart 5 |
|
|
|
|
|
Chart 6 |
|
|
|
|
|
|
|
|
|
|
|
|
|
|
|
|
||||||||||||||||||||
Ratings outlook net bias |
|
|
|
|
|
Ratings net outlook bias by region |
|
|
||||||||||||||||||||||||||||||||||
Net Outlook |
|
Metals & Mining |
|
|
Net Outlook |
|
N.America |
|
W.Europe |
||
Bias (%) |
|
|
|
Bias (%) |
|
Asia-Pacific |
|
Latin America |
|||
|
|
|
|
|
|
|
|||||
10 |
|
|
|
|
|
40 |
|
|
|
|
|
0 |
|
|
|
|
|
20 |
|
|
|
|
|
-10 |
|
|
|
|
|
0 |
|
|
|
|
|
-20 |
|
|
|
|
|
-20 |
|
|
|
|
|
-30 |
|
|
|
|
|
-40 |
|
|
|
|
|
-40 |
|
|
|
|
|
-60 |
|
|
|
|
|
-50 |
|
|
|
|
|
-80 |
|
|
|
|
|
13 |
14 |
15 |
16 |
17 |
18 |
13 |
14 |
15 |
16 |
17 |
18 |
Source: S&P Global Ratings. Ratings data measured quarterly with last shown quarter ending September 30, 2018
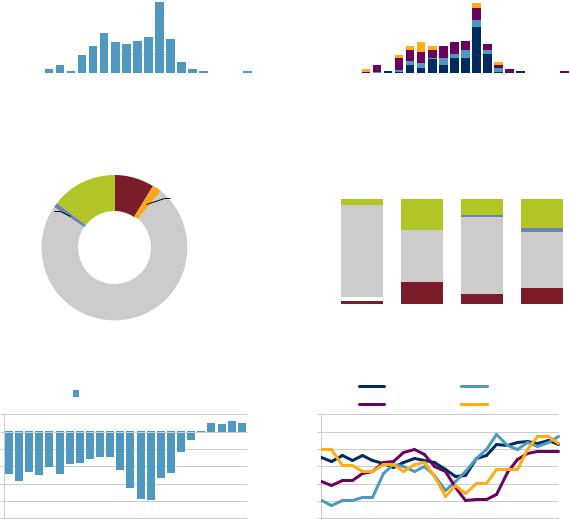
The outlook for ratings on metals and mining issuers is predominantly stable, and the rating bias has modestly improved relative to last year. As of third quarter 2018, close to three-quarters of mining and metals issuers had stable rating outlooks. The number of positive outlooks remains unchanged year-over-year (15%), but the share of negative outlooks has declined to about 9%. Ratings net bias improved modestly across all regions. In our view, this trend highlights the positive cash flow momentum for most mining and metals issuers over the past year. We also believe positive cash flow has contributed to an increase in new issuer ratings largely concentrated in the ‘B’ rating category.
S&P Global Ratings |
November 12, 2018 2 |

vk.com/id446425943
Industry Top Trends 2019: Metals and Mining
Industry forecasts
Global Metals and Mining
Chart 7 |
|
|
|
|
|
Chart 8 |
|
|
|
|
|
|
||||||
Revenue growth (local currency) |
|
|
Capex growth |
|
|
|
|
|
|
|||||||||
|
|
|
|
Metals & Mining Upstream |
|
|
|
|
|
|
Metals & Mining Upstream |
|
||||||
|
|
|
|
|
|
|
|
|
|
|||||||||
|
|
|
|
|
|
|
|
|
|
|||||||||
|
|
|
|
Metals & Mining Downstream |
|
|
|
|
|
|
Metals & Mining Downstream |
|
||||||
|
|
|
|
|
|
|
|
|
|
|||||||||
|
|
|
|
|
|
|
|
|
|
|||||||||
30% |
|
|
|
Global |
|
|
Forecast |
|
50% |
|
|
|
|
Global |
|
|
Forecast |
|
|
|
|
|
|
|
|
|
|
|
|
|
|
||||||
|
|
|
|
|
|
|
|
|
|
|
|
|
|
|
|
|
||
20% |
|
|
|
|
|
|
|
|
40% |
|
|
|
|
|
|
|
|
|
|
|
|
|
|
|
|
|
|
|
|
|
|
|
|
|
|
||
|
|
|
|
|
|
|
|
30% |
|
|
|
|
|
|
|
|
|
|
|
|
|
|
|
|
|
|
|
|
|
|
|
|
|
|
|
|
|
10% |
|
|
|
|
|
|
|
|
20% |
|
|
|
|
|
|
|
|
|
|
|
|
|
|
|
|
|
|
|
|
|
|
|
|
|
|
||
0% |
|
|
|
|
|
|
|
|
10% |
|
|
|
|
|
|
|
|
|
|
|
|
|
|
|
|
|
|
|
|
|
|
|
|
|
|
||
|
|
|
|
|
|
|
|
0% |
|
|
|
|
|
|
|
|
|
|
|
|
|
|
|
|
|
|
|
|
|
|
|
|
|
|
|
||
|
|
|
|
|
|
|
|
|
|
|
|
|
|
|
|
|
|
|
|
|
|
|
|
|
|
|
|
|
|
|
|
|
|
|
|
|
|
-10% |
|
|
|
|
|
|
|
|
-10% |
|
|
|
|
|
|
|
|
|
|
|
|
|
|
|
|
|
|
|
|
|
|
|
|
|
|
||
-20% |
|
|
|
|
|
|
|
|
-20% |
|
|
|
|
|
|
|
|
|
|
|
|
|
|
|
|
|
|
|
|
|
|
|
|
|
|
||
|
|
|
|
|
|
|
|
-30% |
|
|
|
|
|
|
|
|
|
|
|
|
|
|
|
|
|
|
|
|
|
|
|
|
|
|
|
||
-30% |
|
|
|
|
|
|
|
|
|
|
|
|
|
|
|
|
|
|
|
|
|
|
|
|
|
|
|
|
|
|
|
|
|
|
|
||
|
|
|
|
|
|
|
|
-40% |
|
|
|
|
|
|
|
|
|
|
|
|
|
|
|
|
|
|
|
|
|
|
|
|
|
|
|
||
2015 |
2016 |
2017 |
2018 |
2019 |
2020 |
2015 |
2016 |
2017 |
2018 |
2019 |
2020 |
|||||||
We expect relatively flat revenues across the upstream and downstream sectors in 2019 and 2020, albeit at favorable levels following the sharp increase in 2017. Our estimates mainly reflect relatively stable average metals and mining commodity price assumptions that for the most part reflect balanced supply/demand fundamentals. We also expect steady production across both segments of the industry, because we predict subdued investments in recent years to limit a material increase in output.
We expect the positive trend in capital expenditures (capex) over the past two years to stall in 2019. Both upstream and downstream producers began increasing their capex in 2017 in response to improved market conditions and the completion of restructurings and balance sheet repair. However, we believe producers are now becoming more cautious with capital allocation, due in part to increasingly uncertain demand—mainly in China--and the potential impact of a trade war between China and the U.S. The recent volatility in most mining commodity prices this year also likely plays a role.
Chart 9 |
Chart 10 |
Debt / EBITDA (median, adjusted)
 Metals & Mining Upstream
 Metals & Mining Downstream
6.0x |
|
|
|
|
Global |
|
|
Forecast |
|
|
|
|
|
|
|
|
|||
|
|
|
|
|
|
|
|
|
|
5.0x |
|
|
|
|
|
|
|
|
|
|
|
|
|
|
|
|
|
|
|
4.0x |
|
|
|
|
|
|
|
|
|
|
|
|
|
|
|
|
|
|
|
3.0x |
|
|
|
|
|
|
|
|
|
|
|
|
|
|
|
|
|
|
|
2.0x |
|
|
|
|
|
|
|
|
|
|
|
|
|
|
|
|
|
|
|
1.0x |
|
|
|
|
|
|
|
|
|
|
|
|
|
|
|
|
|
|
|
0.0x |
|
|
|
|
|
|
|
|
|
|
|
|
|
|
|
|
|
|
|
2015 |
2016 |
2017 |
2018 |
2019 |
2020 |
||||
EBITDA (absolute, adjusted)
|
|
|
|
|
Metals & Mining Downstream |
|
|||
|
|
|
|
|
|
||||
|
|
|
|
|
|
||||
|
|
|
|
|
Metals & Mining Upstream |
|
|||
|
|
|
|
|
|
||||
|
|
|
|
|
|
||||
400 |
|
USD Bn |
|
|
|
Forecast |
|
||
|
|
|
|
|
|
|
|
|
|
350 |
|
|
|
|
|
|
|
|
|
|
|
|
|
|
|
|
|
|
|
300 |
|
|
|
|
|
|
|
|
|
|
|
|
|
|
|
|
|
|
|
250 |
|
|
|
|
|
|
|
|
|
|
|
|
|
|
|
|
|
|
|
200 |
|
|
|
|
|
|
|
|
|
|
|
|
|
|
|
|
|
|
|
150 |
|
|
|
|
|
|
|
|
|
|
|
|
|
|
|
|
|
|
|
100 |
|
|
|
|
|
|
|
|
|
|
|
|
|
|
|
|
|
|
|
50 |
|
|
|
|
|
|
|
|
|
|
|
|
|
|
|
|
|
|
|
- |
|
|
|
|
|
|
|
|
|
2015 |
|
2016 |
2017 |
2018 |
2019 |
2020 |
|||
|
|
||||||||
We believe the steady deleveraging trend has mostly played itself out after an earnings upswing and significant debt reduction in recent years, particularly among larger upstream producers. We expect modest earnings growth will result in slightly reduced adjusted debt-to-EBITDA ratios across the industry, led by North America. Our estimates mainly reflect our relatively stable assumptions for prices, output, and debt levels across most regions, which builds some credit buffer against any potential downturn.
We expect relatively flat EBITDA across the upstream and downstream sectors in 2019 and 2020. Our estimates mainly account for stable average metals and mining commodity price assumptions which, for the most part, reflect balanced supply/demand fundamentals. The earnings growth in 2017 and 2018 largely resulted from higher prices and cost rationalization following two years of low prices.
Source: S&P Global Ratings. Revenue growth shows local currency growth weighted by prior-year common-currency revenue-share. All other figures are converted into U.S. Dollars using historic exchange rates. Forecasts are converted at the last financial year-end spot rate. FFO--Funds from operations.
Thanks to healthy demand and relatively low growth in supply, the metal and mining industry is about to close another strong year. Although prices recently softened, the
S&P Global Ratings |
November 12, 2018 3 |