

JPM European Media Internet 2019 Outlook_watermark
.pdfvk.com/id446425943

vk.com/id446425943

vk.com/id446425943

vk.com/id446425943
Daniel Kerven |
Europe Equity Research |
(44-20) 7134-3057 |
10 December 2018 |
daniel kerven@jpmorgan.com |
|
Appendix - Introducing MediaScreen
MediaScreen is a quant based overlay to our fundamental analysis. It tailors the JP Morgan Cycle Investing Framework to the media sector and provides an additional point of reference for our stock selection process.
Investment styles across the economic cycle
Our quantitative research team has identified a relationship between investment styles and the phase of the Economic Cycle, as defined by the level and direction of JPM’s “Quant Macro Index”.
Stage of the economic cycle is defined by the Quant Macro Index
The QMI is based upon 6 inputs: German business confidence; changes in European bond yields, ECB money supply; the OECD’s leading indicator; earnings revisions; and the SEK/USD exchange rate.
There are 4 phases to the cycle determined by both the level and second derivative of the QMI: “Recovery” – the QMI is below average but rising; “Expansion” – above average and rising; “Slowdown” – above average but declining; and “Contraction” – below average and declining.
Figure 33: JPM Quant ‘Cycle Investing’ – Linking the economic cycle with Style returns
Source: J P. Morgan Quantitative and Derivatives Strategies
Using the QMI to time and rotate investment style
Our quantitative team suggests that excess average returns can be achieved across the cycle following strategies that favour the following attributes:
Recovery: good Value, high Risk, low Quality, falling Momentum and smaller Size
Expansion: good Value, high Growth, rising Momentum, low Quality, high Risk and smaller Size
Slowdown: high Growth, rising Momentum, high Quality, low Risk and larger Size
Contraction: good Value, high Quality, low Risk, larger Size and rising Momentum
44
vk.com/id446425943
Daniel Kerven |
Europe Equity Research |
(44-20) 7134-3057 |
10 December 2018 |
daniel.kerven@jpmorgan.com |
|
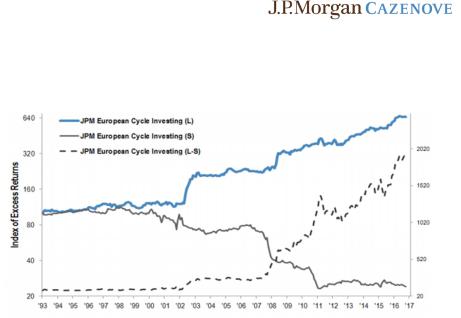
Figure 34: Returns for Investment Style Rotation using the European QMI
Source: J P. Morgan Quantitative and Derivatives Strategies.
MediaScreen leverages the Cycle Investing framework
We rank the stocks under our coverage in the media sector across a number of investment screens: Price and Earnings Momentum; Risk; Quality; Valuation; Growth; FX movements; Size; Strategic optionality and Macro risk.
The individual screen ranks are based on a range of underlying metrics that are relevant to the media sector and are based on JPM forecasts, consensus estimates or Bloomberg data (see the appendix for details regarding the underlying metrics / factors).
We then apply weightings to the investment screens depending on the phase of the economic cycle, with the weightings informed by the Cycle Investing framework.
MediaScreen is only one input into stock selection process
While we believe MediaScreen will be a useful tool for stock selection, rotation and timing, it is only one input and MediaScreen ranks may differ from our stock recommendations and price targets which also reflect our fundamental views, potential catalysts and are based on a 12m time horizon.
MediaScreen methodology & factor weightings
Investors will have their own views regarding screen weights, economic cycle
Further detail regarding individual screen factors, metrics are discussed below. While informed by the Cycle Investment framework, which in turn is supported by actual performance and back-testing, MediaScreen weightings, and the weightings applied to the factors that underpin the individual screen ranks, are subjective and can be refined over time based on our experience as to what is relevant to the performance of the media sector. Investors will likely have different views on the relevant factors, weightings and where we are in the economic cycle.
Price Momentum
Factor inputs include stock performance over 1 month and 12 months and the 30-day RSI. Stocks rank highly if they have outperformed over 12mos, underperformed over the past month and have a low RSI.
45

vk.com/id446425943
Daniel Kerven |
Europe Equity Research |
(44-20) 7134-3057 |
10 December 2018 |
daniel kerven@jpmorgan.com |
|
Earnings Momentum
Stocks are ranked on the basis of the 1-month and 3-month change in Bloomberg consensus earnings, the number of net Bloomberg consensus upgrades and downgrades to FY1 and FY2 earnings over the past 4 weeks and the difference between JP Morgan EPS and EBITA forecasts and consensus.
Market Capitalisation
Stocks are ranked on the basis of their free-float market capitalization in euros. In the slowdown and contraction phase, larger-cap stocks rank highest, and vice versa in the recovery and expansion phases.
Risk
Stocks are ranked on the basis of Net Debt / EBITDA, Net debt / Market Cap and Bloomberg betas relative to the wider European market (in USD). Lower-risk stocks have stronger balance sheets and lower betas.
Macro Risk
Stocks are ranked based on their sensitivity to the macro environment based on their revenue mix and operational gearing. We assume stocks with advertising and B2B revenues are more sensitive to the macro environment than companies with subscription-based revenues. Operational gearing depends on the incremental margin and base PBT margin.
Value
We always include a weighting for value, even if that weighting is smaller during the slowdown phase – effectively it is the price being paid for the other qualities / screen rankings. Value ranks are based on a range of metrics: PE, P/FCF, EV/EBITDA, Dividend yield, PE vs 5 yr average and EV / NOPAT.
Quality
We have defined quality on the basis of balance sheet strength, earnings dispersion, the volatility of earnings estimates over time, the variability of earnings growth, geographic diversification, and subscription vs advertising-based revenues.
Growth
Ranks are based on shortand longer-term revenue, EBITDA, EPS and FCF growth.
FX
Stocks are ranked on the basis of the earnings impact of FX movements over the prior month. The weighting of the FX screen depends on the scale of FX movements with a minimum weighting of 0% and a maximum of 7.5%. Given the weighting of FX will change depending on FX moves, all of the other screens will re-balance on a proportionate basis.
Strategic value
Stocks are ranked on our view of their potential to benefit from portfolio change, cash returns, convergence and consolidation opportunities. Stocks are ranked on the basis of financial flexibility vs an industry target leverage and ranked on the basis of the scope for industry consolidation.
46

vk.com/id446425943

vk.com/id446425943
Daniel Kerven (44-20) 7134-3057
daniel kerven@jpmorgan.com
Neutral
Company Data
Price (€) |
4.78 |
Date Of Price |
07 Dec 18 |
Price Target (€) |
5.50 |
Price Target End Date |
30-Sep-19 |
52-week Range (€) |
9.37-4.31 |
Market Cap (€ bn) |
1.08 |
Shares O/S (mn) |
225 |
Atresmedia DCF
Wacc (%) |
9.8% |
Terminal growth rate |
0.0% |
NPV |
|
Present Value of FCF (18-30) |
1,104 |
Present Value of Terminal Value |
444 |
Enterprise Value |
1,548 |
(Net Debt)/Net Cash |
-307 |
Equity Value |
1,241 |
Outstanding Shares (bl) |
225 |
Per share |
5.5 |
Source: J.P. Morgan estimates.
Europe Equity Research
10 December 2018
Atresmedia
Atresmedia Corp de Medios de Comunicaion S.A. (A3M.MC;A3M SM)
FYE Dec |
2017A |
2018E |
2018E |
2019E |
2019E |
|
|
(Prev) |
(Curr) |
(Prev) |
(Curr) |
Adj. EPS FY (€) |
0.63 |
0.64 |
0.61 |
0.70 |
0.62 |
Revenue FY (€ mn) |
1,052 |
1,064 |
1,046 |
1,090 |
1,045 |
EBITDA FY (€ mn) |
202 |
201 |
190 |
217 |
193 |
EBITDA Margin FY |
19.2% |
18.9% |
18.2% |
19.9% |
18.5% |
Net Profit FY (€ mn) |
142 |
145 |
137 |
158 |
139 |
Bloomberg EPS FY (€) |
0.64 |
- |
0.58 |
- |
0.59 |
Net Debt/EBITDA FY |
118.4% |
116.2% |
125.4% |
102.4% |
122.4% |
Net debt / (cash) FY (€ mn) |
240 |
233 |
239 |
223 |
236 |
Source: Company data, Bloomberg, J.P. Morgan estimates.
Investment Thesis, Valuation and Risks Atresmedia (Neutral; Price Target: €5.50)
Forecast Changes
We take a cautious view on the Spanish TV advertising outlook & reduce our 2018 / 19 NAR forecast from -1% / 2% to -3% / -1%. We expect A3M to underperform the wider market on a FY basis given the World Cup and loss of the Champions League in H2. Our 18E/19E EPS decreases by -6%/-12%.
Investment Thesis
We forecast medium-term revenue and EBIT growth of c1%. MediaScreen would also suggest that A3M may struggle to outperform during the slowdown phase of the economic cycle. With limited upside to our Price Target, we remain Neutral.
Valuation
We value Atresmedia through a DCF (WACC 9.8%, terminal growth of 0% vs. 8.8% / 1.0% respectively). We decrease our Sep-19 PT to €5.5 (from €8.1 previously) reflecting the downgrade to our forecasts.
Risks to Rating and Price Target
The main risks that we believe could prevent the stock from achieving our target price and rating are: 1) a lower-or higher-than-expected increase in TV advertising; 2) lower-or higher-than-expected audience share; 3) higher / lower programming costs.
48

vk.com/id446425943
Daniel Kerven |
Europe Equity Research |
(44-20) 7134-3057 |
10 December 2018 |
daniel kerven@jpmorgan.com |
|
Atresmedia: Summary of Financials
Income Statement |
FY16A |
FY17A |
FY18E |
FY19E |
FY20E |
|
Cash Flow Statement |
FY16A |
FY17A |
FY18E |
FY19E |
FY20E |
Revenue |
1,021 |
1,052 |
1,046 |
1,045 |
1,047 |
|
Cash flow from operating activities |
112 |
195 |
134 |
145 |
140 |
COGS |
- |
- |
- |
- |
- |
|
o/w Depreciation & amortization |
18 |
18 |
17 |
15 |
16 |
Gross profit |
- |
- |
- |
- |
- |
|
o/w Changes in working capital |
(52) |
36 |
(15) |
(5) |
(5) |
SG&A |
- |
- |
- |
- |
- |
|
|
|
|
|
|
|
Adj. EBITDA |
202 |
202 |
190 |
193 |
188 |
|
Cash flow from investing activities |
(10) |
(31) |
0 |
0 |
0 |
D&A |
(18) |
(18) |
(17) |
(16) |
(16) |
|
o/w Capital expenditure |
(10) |
(31) |
0 |
0 |
0 |
Adj. EBIT |
184 |
184 |
174 |
177 |
172 |
|
as % of sales |
1.0% |
2.9% |
0.0% |
0.0% |
0.0% |
Net Interest |
(3) |
(2) |
(5) |
(5) |
(5) |
|
|
|
|
|
|
|
Adj. PBT |
175 |
177 |
169 |
173 |
167 |
|
Cash flow from financing activities |
(78) |
(122) |
(128) |
(138) |
(138) |
Tax |
(46) |
(34) |
(32) |
(33) |
(32) |
|
o/w Dividends paid |
(90) |
(207) |
(128) |
(138) |
(138) |
Minority Interest |
0 |
0 |
0 |
0 |
0 |
|
o/w Shares issued/(repurchased) |
(9) |
0 |
0 |
0 |
0 |
Adj. Net Income |
129 |
142 |
137 |
139 |
135 |
|
o/w Net debt issued/(repaid) |
21 |
84 |
0 |
0 |
0 |
Reported EPS |
0 57 |
0.63 |
0.61 |
0.62 |
0.60 |
|
Net change in cash |
24 |
42 |
6 |
7 |
3 |
Adj. EPS |
0.57 |
0.63 |
0.61 |
0.62 |
0.60 |
|
|
112 |
195 |
134 |
145 |
140 |
DPS |
0.52 |
0.97 |
0.61 |
0.62 |
0.60 |
|
Adj. Free cash flow to firm |
|||||
|
y/y Growth |
52.8% |
74.6% |
(31.3%) |
8.4% |
(3.6%) |
||||||
Payout ratio |
90.6% |
153.2% |
100.0% |
100.0% |
100.0% |
|
|
|
|
|
|
|
Shares outstanding |
225 |
225 |
225 |
225 |
225 |
|
|
|
|
|
|
|
Balance Sheet |
FY16A |
FY17A |
FY18E |
FY19E |
FY20E |
|
Ratio Analysis |
FY16A |
FY17A |
FY18E |
FY19E |
FY20E |
Cash and cash equivalents |
2 |
25 |
26 |
28 |
26 |
|
Gross margin |
- |
- |
- |
- |
- |
Accounts receivable |
292 |
302 |
311 |
309 |
308 |
|
EBITDA margin |
19.8% |
19.2% |
18.2% |
18 5% |
17.9% |
Inventories |
396 |
391 |
391 |
391 |
391 |
|
EBIT margin |
18.1% |
17.5% |
16.6% |
17.0% |
16.4% |
Other current assets |
0 |
0 |
0 |
0 |
0 |
|
Net profit margin |
12.6% |
13.5% |
13.1% |
13 3% |
12.9% |
Current assets |
689 |
718 |
728 |
729 |
725 |
|
Organic Revenue growth |
- |
- |
- |
- |
- |
PP&E |
621 |
631 |
630 |
631 |
631 |
|
Net debt/EBITDA |
88.2% |
118.4% |
125.4% |
122.4% |
127.1% |
LT investments |
|
|
|
|
- |
|
|
|
|
|
|
|
Other non current assets |
0 |
0 |
0 |
0 |
(0) |
|
Sales/Assets (x) |
0.8 |
0.8 |
0.8 |
0.8 |
0.8 |
Total assets |
1,310 |
1,349 |
1,358 |
1,359 |
1,357 |
|
Assets/Equity (x) |
2.6 |
2.8 |
3.0 |
3.0 |
3.0 |
|
|
|
|
|
|
|
Interest cover (x) |
77.3 |
102.6 |
39.6 |
40.5 |
39.6 |
|
|
|
|
|
|
|
||||||
Short term borrowings |
|
|
|
|
- |
|
Tax rate |
26.1% |
19.5% |
19.1% |
19 2% |
19.0% |
Payables |
612 |
639 |
639 |
639 |
639 |
|
|
|
|
|
|
|
Other short term liabilities |
0 |
0 |
0 |
0 |
0 |
|
Revenue y/y Growth |
5 2% |
3.0% |
(0.6%) |
(0.0%) |
0.1% |
Current liabilities |
612 |
639 |
639 |
639 |
639 |
|
EBITDA y/y Growth |
22.2% |
(0.0%) |
(5.9%) |
1 3% |
(2.8%) |
Long-term debt |
180 |
265 |
265 |
265 |
265 |
|
EPS y/y Growth |
25.3% |
10.1% |
(3.9%) |
2.1% |
(2.9%) |
Other long term liabilities |
0 |
0 |
0 |
0 |
0 |
|
|
|
|
|
|
|
Total liabilities |
792 |
903 |
903 |
903 |
903 |
|
|
|
|
|
|
|
|
|
|
|
|
|
|
Valuation |
FY16A |
FY17A |
FY18E |
FY19E |
FY20E |
Shareholders' equity |
518 |
446 |
454 |
456 |
454 |
|
P/E (x) |
8.3 |
7.6 |
7 9 |
7.7 |
8.0 |
Minority interests |
|
|
|
|
- |
|
FCFE Yield |
10.3% |
17.4% |
12.0% |
13.1% |
12.6% |
Total liabilities & equity |
1,310 |
1,349 |
1,358 |
1,359 |
1,357 |
|
EV/EBITDA (x) |
6.5 |
6 5 |
6.6 |
5.8 |
5.3 |
|
|
|
|
|
|
|
Dividend Yield |
10.9% |
20.2% |
12.7% |
13.0% |
12.6% |
Net debt/(cash) |
179 |
240 |
239 |
236 |
238 |
|
||||||
|
|
|
|
|
|
|
Source: Company reports and J.P. Morgan estimates.
Note: € in millions (except per-share data).Fiscal year ends Dec. o/w - out of which
49

vk.com/id446425943
Daniel Kerven |
Europe Equity Research |
(44-20) 7134-3057 |
10 December 2018 |
daniel kerven@jpmorgan.com |
|
Overweight
Company Data
Price (p) |
652 |
Date Of Price |
07 Dec 18 |
Price Target (p) |
812 |
Price Target End Date |
31-Dec-19 |
52-week Range (p) |
870-652 |
Market Cap (£ bn) |
6.91 |
Shares O/S (mn) |
1,060 |
Informa
Informa Plc (INF.L;INF LN)
FYE Dec |
2017A |
2018E |
2019E |
2020E |
Adj. EPS FY (p) |
46.11 |
47.46 |
52.40 |
55.34 |
Revenue FY (£ mn) |
1,758 |
2,393 |
2,875 |
2,969 |
EBITDA FY (£ mn) |
585 |
744 |
946 |
984 |
EBITA (Calc) FY (£ mn) |
546 |
711 |
911 |
947 |
EBITA Margin FY |
31.0% |
29.7% |
31.7% |
31.9% |
Pretax Profit Adjusted FY |
486 |
625 |
814 |
871 |
(£ mn) |
|
|
|
|
DPS (Gross) FY (p) |
20.45 |
21.27 |
22.12 |
23.00 |
Bloomberg EPS FY (p) |
46.00 |
48.10 |
52.20 |
55.70 |
Source: Company data, Bloomberg, J.P. Morgan estimates.
Informa: J.P. Morgan DCF analysis
£ million, as at 31 Dec 19E
WACC |
8.0% |
Terminal growth |
2.0% |
Terminal ROIC |
10% |
NPV of cash flows until 2027E |
3,966 |
NPV of Terminal Value |
7,946 |
Implied Enterprise Value |
11,912 |
Net Debt |
-1,757 |
Pensions liability / other |
6 |
Implied Equity Value |
10,161 |
Number of shares (m) |
1252 |
Fair value per share |
812p |
Source: J.P. Morgan estimates
Investment Thesis, Valuation and Risks Informa (Overweight; Price Target: 812p)
Investment Thesis
The events space (51% of Informa’s 18E revenues and 56% of profits) is one of our preferred subsectors in Media for us given 1) the limited impact from digital on the subsector (you can’t “Amazon” the events business); 2) upside potential from further consolidation in the space; 3) sustainable margins; 4) well-diversified portfolios with a high share of Emerging Markets exposure; and 5) a relatively manageable degree of cyclicality. We argue that Informa’s new events portfolio (Global Exhibitions plus UBM Events) is more defensive than the market anticipates given the high share of must attend events. In addition, we flag Informa’s remaining revenues are mostly subscription based. This makes Informa attractive in the current environment of macro uncertainty – the shares are attractive we believe after the recent weakness trading on 10.3x 2019E EV/EBITDA for a 2018-2021 EBITDA of +10% and we upgrade the shares to OW with an unchanged price target of 812p (+23% upside).
Valuation
We set our price target via DCF analysis (8.0% WACC, 2.0% terminal growth, both unchanged). Our Dec 2019 PT is 812p (unchanged).
Risks to Rating and Price Target
We see the following risks to our rating and price target: 1) USD depreciates against GBP; 2) the company finds further investment costs beyond the strategic plan or does not meet its targets; 3) Business Intelligence performs worse than expected; 4) any acquisitions are value-destroying and/or are not welcomed by the market; 5) cash returns are lower than anticipated; 6) margins prove less resilient and are lower than we currently anticipate; and 7) any macro or political impact on Knowledge & Networking or Exhibitions revenues and profit is worse than expected.
50