

vk.com/id446425943
Africa and Asia
Global Telecom Holding – GTHE
Pakistan continues to be GTHE’s strongest market with a significant opportunity to further develop its mobile money product. However, the Pakistani rupee’s (PKR) devaluation – it lost around 26% vs the dollar in 2018 – is the main drag on performance, with currency controls in place and the inability to upstream cash from the country.
The Bangladeshi and Algerian markets remain highly competitive, and in Algeria margins are likely to continue to be under pressure owing to competitive pricing in 2019 and a new Finance Law, effective from January 2018 and tax increases since mid-July 2018.
Subject to EGM approval, GTHE intends to proceed with a rights issue and to raise EGP11.8bn of new capital. If VEON participates in the capital rise, it could get to an 87% or even 92% stake in the company if no other shareholder participates. We think that getting approval for the rights issue will be tricky and VEON may revert to the stock buyback option in order to achieve its goal of taking GTHE private; prior to that, however, VEON might need to offer bridge financing to GTHE in order for the latter to honour its obligations to creditors.
We adjust our forecasts (mostly lower), incorporate a weaker exchange rate in Pakistan and reduce our TP to EGP5.2/sh (from EGP5.4/sh) while maintaining our HOLD rating.
Figure 64: GTHE – old estimates vs new, $mn (unless otherwise stated)
|
|
Old (October 2018) |
|
|
New |
Deviation |
|||
|
|
2018E |
2019E |
2018E |
2019E |
2018E |
|
2019E |
|
Revenue |
|
2,712 |
2,687 |
2,808 |
|
2,705 |
3.5% |
|
0.7% |
EBITDA |
1,223 |
1,181 |
1,215 |
|
1,159 |
-0.7% |
|
-1.9% |
|
EBITDA margin |
|
45.1% |
44.0% |
43.3% |
42.8% |
|
|
|
|
Net income |
(1) |
19 |
(3) |
|
19 |
na |
|
-1.7% |
|
Net debt |
|
2,440 |
2,376 |
2,399 |
|
2,384 |
-1.7% |
|
0.3% |
|
|
|
|
|
|
|
Source: Renaissance Capital estimates |
||
Figure 65: SoTP valuation of Global Telecom Holding, $mn (unless otherwise stated) – YE19 |
|
|
|||||||
|
|
|
|
Value |
Approach |
FX Used |
DCF |
WACC |
|
Algerian equity value |
|
|
827 |
|
@ 4x EV/EBITDA |
119 |
819 |
16.0% |
|
Pakistan equity value |
|
|
1,849 |
|
@ 4x EV/EBITDA |
139 |
2,217 |
15.5% |
|
Bangladesh equity value |
|
|
257 |
|
@ 4x EV/EBITDA |
84 |
82 |
14.3% |
|
|
|
|
|
|
|
|
|
|
|
Holding costs + withholding taxes |
|
|
(70) |
|
|
|
(70) |
|
|
Holding net debt |
|
|
1,429 |
|
|
|
1,429 |
|
|
Equity value |
|
|
1,435 |
|
|
|
1,619 |
|
|
|
|
|
|
|
|
|
|
|
|
Equity value, (50% multiple and 50% DCF SoTP), $mn |
1,527 |
|
|
|
|
|
|||
TP (50% multiple and 50% DCF SoTP and applying 10% |
5.2 |
|
|
|
|
|
|||
discount due to corp. governance), EGP/share |
|
|
|
|
|
|
|||
|
|
|
|
|
|
|
|||
|
|
|
|
|
|
|
Source: Renaissance Capital estimates |
||
Renaissance Capital
8 January 2019
EMEA telecoms
31

vk.com/id446425943
Renaissance Capital
8 January 2019
EMEA telecoms
Figure 66: Global Telecom Holding (GTHE) key financials, $mn (unless otherwise stated)*
Income statement |
2017 |
2018E |
2019E |
2020E |
Sales |
3,015 |
2,808 |
2,705 |
2,821 |
Cost of sales |
(1,670) |
(1,593) |
(1,546) |
(1,606) |
EBITDA |
1,344 |
1,215 |
1,159 |
1,215 |
EBITDA margin |
44.6% |
43.3% |
42.8% |
43.1% |
Depreciation & amortisation |
(580) |
(523) |
(496) |
(506) |
PBIT |
764 |
692 |
663 |
709 |
Net interest |
(379) |
(319) |
(292) |
(252) |
PBT |
316 |
351 |
351 |
447 |
Tax |
(358) |
(246) |
(228) |
(290) |
Tax rate |
113% |
70% |
65% |
65% |
Minorities |
(103) |
(108) |
(104) |
(112) |
PAT |
(144) |
(3) |
19 |
44 |
Shares, mn |
4,721 |
4,721 |
4,721 |
4,721 |
EPS per common share, $ |
(0.030) |
(0.001) |
0.004 |
0.009 |
DPS per common share, $ |
- |
- |
- |
- |
Balance sheet |
2017 |
2018E |
2019E |
2020E |
Non-current assets |
3,538 |
3,777 |
3,831 |
3,887 |
Current assets |
592 |
562 |
541 |
564 |
Monetary assets |
374 |
230 |
123 |
110 |
Other assets |
830 |
830 |
830 |
830 |
Total assets |
5,333 |
5,398 |
5,325 |
5,390 |
Current liabilities |
2,027 |
2,050 |
1,975 |
2,059 |
Indebtedness |
2,692 |
2,629 |
2,508 |
2,332 |
Minorities |
139 |
247 |
351 |
463 |
Other liabilities |
526 |
526 |
526 |
526 |
Equity |
(50) |
(53) |
(34) |
10 |
Total liabilities & shareholders' equity |
5,333 |
5,398 |
5,325 |
5,390 |
Net debt |
2,318 |
2,399 |
2,384 |
2,223 |
Cash flow |
2017 |
2018E |
2019E |
2020E |
PAT before minorities |
(41) |
105 |
123 |
156 |
Non-cash items |
580 |
523 |
496 |
506 |
Change in working capital |
(103) |
53 |
(54) |
61 |
Operating cash flow |
877 |
681 |
565 |
724 |
Capex |
(766) |
(761) |
(550) |
(562) |
Investing cash flow |
(766) |
(761) |
(550) |
(562) |
Free cash flow |
110 |
(81) |
14 |
161 |
Financing cash flow |
(157) |
(63) |
(121) |
(175) |
Note: *GTH is majority-owned by VEON and our GTH TP forms part of our valuation for VEON.
Source: Company data, Renaissance Capital estimates
32

vk.com/id446425943
Egypt – Telecom Egypt
Telecom Egypt (TE) has continued demonstrating positive dynamics in its recently launched mobile business and core fixed line segment, while the cable business provides additional opportunities.
The mobile business continued to ramp up in 3Q18 despite tax fees imposed on new SIMs in July 2018, contributing high single digit share in retail revenue. In 3Q18, TE’s mobile market share reached 3% with 3.6mn subs (+9% QoQ) that bodes well for our expectation of c. 3.7mn subs at YE18 and the company’s plan to reach 10-15% market share by YE22 with a breakeven level at YE20
The company expects to beat its 2018 revenue guidance (high singleto low-double digit growth) due to the MENA cable acquisition and Bharti deal and despite it generating high non-recurring revenue of c. EGP1.6bn, TE expect to continue to demonstrate strong topline growth in 2019 (see Figure 67). The company states that it would like to go back to paying EGP1/share in dividends from 2019, although that would grow ND/EBITDA to c. 2.4x on our estimates. We maintain out TP of EGP17 and reiterate our BUY rating.
Figure 67: Telecom Egypt's 2019 guidance vs our expectations
|
ETEL |
RenCap |
Revenue |
Mid-to-high single digit |
7.2% |
Revenue (excl. MENA cable) |
Mid double digit |
15.0% |
EBITDA margin |
Mid-to-high twenties |
27.6% |
Capex/Sales |
30% |
30.0% |
Source: Company data, Renaissance Capital estimates
Figure 68: Telecom Egypt financials, EGPmn (unless otherwise stated)
Income statement |
2017 |
2018E |
2019E |
2020E |
Sales |
18,876 |
23,878 |
25,591 |
28,838 |
Cash opex |
(13,692) |
(17,344) |
(18,535) |
(20,581) |
EBITDA |
5,184 |
6,534 |
7,057 |
8,257 |
EBITDA margin (%) |
27.5% |
27.4% |
27.6% |
28.6% |
Depreciation & amortisation |
(2,006) |
(2,823) |
(3,026) |
(3,409) |
EBIT |
2,122 |
3,145 |
3,389 |
3,962 |
Net interest |
(296) |
(1,041) |
(1,406) |
(1,429) |
Associates |
2,337 |
2,205 |
2,352 |
2,377 |
PBT |
3,813 |
4,309 |
4,334 |
4,910 |
Tax |
(520) |
(754) |
(758) |
(859) |
Net earnings after minorities |
3,150 |
3,544 |
3,565 |
4,038 |
Shares, mn |
1,707 |
1,707 |
1,707 |
1,707 |
EPS, EGP |
1.85 |
2.08 |
2.09 |
2.37 |
DPS per common share, EGP |
0.25 |
1.00 |
1.00 |
1.00 |
Balance sheet |
2017 |
2018E |
2019E |
2020E |
Non-current assets |
43,826 |
51,650 |
58,478 |
63,166 |
Current assets |
8,558 |
13,460 |
12,449 |
13,947 |
Monetary assets |
507 |
1,575 |
120 |
432 |
Total assets |
52,383 |
65,110 |
70,927 |
77,113 |
Current liabilities |
19,115 |
16,953 |
17,402 |
18,745 |
Indebtedness |
7,293 |
13,293 |
16,793 |
19,293 |
Minorities and other |
12 |
23 |
34 |
46 |
Equity |
30,576 |
33,694 |
35,551 |
37,883 |
Total liabilities & shareholders' equity |
52,383 |
65,110 |
70,927 |
77,113 |
Net debt |
6,786 |
11,718 |
16,673 |
18,861 |
Cash flow |
2017 |
2018E |
2019E |
2020E |
Net earnings |
3,150 |
3,544 |
3,565 |
4,038 |
Non-cash items |
2,006 |
2,823 |
3,026 |
3,409 |
Change in working capital |
8,839 |
(1,522) |
(2,346) |
(2,221) |
Other adjustments |
(9,346) |
11 |
11 |
12 |
Operating cash flow |
4,649 |
4,856 |
4,255 |
5,239 |
Capex |
(7,508) |
(7,641) |
(7,549) |
(5,768) |
Investing cash flows |
(7,360) |
(9,361) |
(7,502) |
(5,720) |
Free cash flow |
(2,858) |
(2,785) |
(3,295) |
(529) |
Financing cash flow |
2,190 |
5,573 |
1,793 |
793 |
Source: Company data, Renaissance Capital estimates
Renaissance Capital
8 January 2019
EMEA telecoms
33

vk.com/id446425943
Kenya – Safaricom
The stock’s performance in 2018 has been dismal and while we believe that c. KES22/sh is the ‘consolidation’ level for the share price, we would prefer to see the shares lower before adopting a more positive rating. Data revenues hardly grew in 1H19 and while that was explained by a need to reduce prices to counter Airtel’s aggressive expansion, we think 2H19 may be only slightly better, as Airtel continues with its aggressive pricing and to take market share away from Safaricom, as it has been doing, with its share now above 21%. The new excise duties on data services and increase of duties on telecom service to 15% may take a toll on ARPUs and subscriber usage as Safaricom opted to transfer those to the consumer. There is also a risk of corporate taxation increasing by 5 ppts to 35%.
We are more confident in MPESA, the revenues of which re-accelerated to 17% YoY in 1H19 and which we believe can reach 20% in 2H19. The still lowly penetrated market for e-cash payments between customers and mid-sized to smaller merchants is likely to grow, in our view, due to the better interface of Safaricom’s LIPA-na-MPESA product and its wider acceptance. Longer term, e-commerce remains an interesting opportunity, we believe.
We have adjusted (upwards mostly) our forecasts on the back of 1H19 numbers.
Safaricom’s growth profile is looking better now than it did six months ago, but the trading multiples of its peers in the fintech universe (PayPal, Square etc) have declined over the past three months, which challenges the idea of paying a premium to fintech multiples for Safaricom MPESA business which is denominated in KES and whose growth has fallen from 30%+ in 2016-17 to less than 20% in 2018. Thus, we maintain our HOLD rating with an unchanged TP of KES23.5. The one potential upside risk we see is the special dividend that Safaricom might decide to pay in 2019 – the company usually reconsiders its need for cash every three years and we believe the time has come for that.
Renaissance Capital
8 January 2019
EMEA telecoms
34

vk.com/id446425943
Renaissance Capital
8 January 2019
EMEA telecoms
Figure 69: SAFCOM financials, KESmn (unless otherwise stated), fiscal year March-March
Income statement |
2018 |
2019E |
2020E |
2021E |
Sales |
233,720 |
248,662 |
268,763 |
289,399 |
Cash opex |
(120,890) |
(124,790) |
(134,073) |
(143,393) |
EBITDA |
112,830 |
123,872 |
134,690 |
146,006 |
EBITDA margin (%) |
48.3% |
49.8% |
50.1% |
50.5% |
Depreciation & amortisation |
(33,560) |
(35,349) |
(37,442) |
(39,107) |
EBIT |
79,270 |
88,523 |
97,248 |
106,899 |
Net interest |
630 |
755 |
481 |
(115) |
Associates |
10 |
10 |
10 |
10 |
PBT |
79,910 |
89,289 |
97,739 |
106,793 |
Tax |
(24,620) |
(28,572) |
(34,209) |
(37,378) |
Tax rate |
31% |
32% |
35% |
35% |
Net earnings |
55,290 |
60,716 |
63,530 |
69,416 |
Shares, mn |
40,065 |
40,065 |
40,065 |
40,065 |
EPS, KES |
1.38 |
1.5 |
1.6 |
1.7 |
DPS, KES |
1.1 |
2.3* |
1.3 |
1.5 |
Balance sheet |
2018 |
2019E |
2020E |
2021E |
Non-current assets |
139,834 |
142,282 |
143,811 |
145,220 |
Current assets |
15,568 |
16,564 |
17,903 |
19,277 |
Monetary assets |
11,892 |
34,245 |
5,984 |
20,998 |
Associates |
146 |
156 |
166 |
176 |
Total assets |
167,440 |
193,247 |
167,864 |
185,671 |
Current liabilities |
43,530 |
52,691 |
55,386 |
57,778 |
Indebtedness |
4,040 |
11,040 |
11,040 |
11,040 |
Equity |
123,910 |
140,556 |
112,478 |
127,893 |
Total liabilities & shareholders’ equity |
167,440 |
193,247 |
167,864 |
185,671 |
Net debt |
(7,852) |
(23,205) |
5,056 |
(9,958) |
Cash flow |
2018 |
2019E |
2020E |
2021E |
Net earnings |
55,290 |
60,716 |
63,530 |
69,416 |
Non-cash items |
33,550 |
35,339 |
37,432 |
39,097 |
Change in working capital |
3,570 |
1,166 |
1,356 |
1,017 |
Other adjustments |
(450) |
(805) |
(381) |
215 |
Operating cash flow |
91,960 |
96,415 |
101,937 |
109,746 |
Capex |
(36,400) |
(37,797) |
(38,971) |
(40,516) |
Investing cash flows |
(36,400) |
(37,797) |
(38,971) |
(40,516) |
Free cash flow |
55,560 |
58,618 |
62,967 |
69,230 |
Financing cash flow |
(52,020) |
(36,265) |
(91,228) |
(54,216) |
Note: *Incl. KES1/sh special dividend
Source: Company data, Renaissance Capital estimates
35
vk.com/id446425943
West Africa – Sonatel
Renaissance Capital
8 January 2019
EMEA telecoms
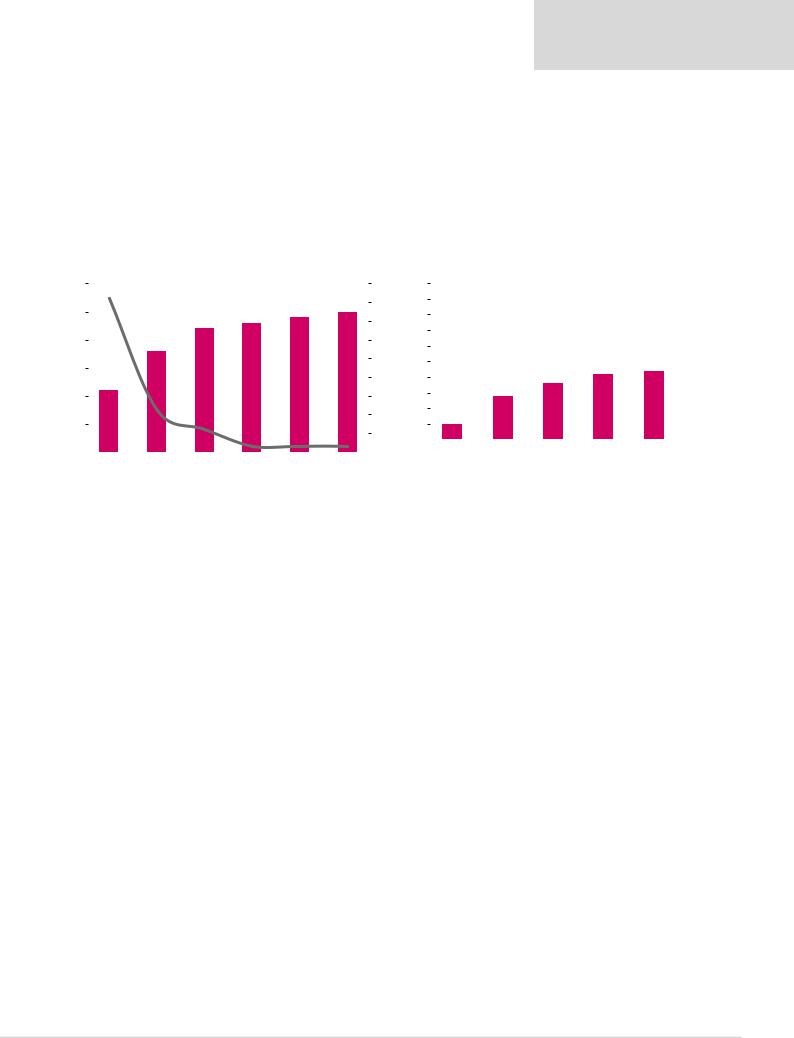
According to GSMA, mobile revenue growth in West Africa will remain weak at a 201722E CAGR of c. 1.7% as voice and messaging revenues continue to be under pressure on the back of heightened competition from OTT services. Meanwhile, despite the highly penetrated mobile market, mobile internet penetration remains low in the region (see Figure 71) compared with the global average, with c. 100mn of new additions expected by 2025, according to GSMA, which would be a long-term growth driver for the industry, we believe. GSMA expects total mobile additions to reach c. 72mn by 2025, though most of them will come from lower income groups that are likely to spend less on mobile services than early adopters.
Figure 70: West Africa mobile revenue dynamics |
|
|
|
Figure 71: Mobile internet penetration in West Africa |
|
|
|
|
|
|||||||||
17.5 |
|
|
Revenue, $bn |
|
|
YoY, % (RHS) |
|
18% 50% |
|
|
|
|
|
|
|
|
||
|
|
|
|
|
|
|
|
|
|
|
|
|
||||||
|
|
|
|
|
|
|
|
|
|
|
|
|
|
|
|
|||
17.0 |
|
|
|
|
|
|
|
|
16% 45% |
|
|
|
|
|
|
|
|
|
|
|
|
|
|
|
|
|
|
|
|
|
|
|
|
|
|||
|
|
|
|
|
|
|
|
|
|
|
|
|
|
|
|
|||
|
|
|
|
|
|
|
|
14% |
40% |
|
|
|
|
|
|
|
|
|
|
|
|
|
|
|
|
|
|
|
|
|
|
|
|
|
|
||
16.5 |
|
|
|
|
|
|
|
|
12% |
35% |
|
|
|
|
|
|
|
|
|
|
|
|
|
|
|
|
|
|
|
|
|
|
|
|
|||
|
|
|
|
|
|
|
|
30% |
|
|
|
|
|
|
|
|
||
|
|
|
|
|
|
|
|
|
|
|
|
|
|
|
|
|||
|
|
|
|
|
|
|
|
|
10% |
|
|
|
|
|
|
|
|
|
16.0 |
|
|
|
|
|
|
|
|
25% |
|
|
|
|
|
|
|
|
|
|
|
|
|
|
|
|
|
|
|
|
|
|
|
|
|
|||
|
|
|
|
|
|
|
|
8% |
20% |
|
|
|
|
|
|
|
|
|
|
|
|
|
|
|
|
|
|
|
|
|
|
|
|
|
|
||
|
|
|
|
|
|
|
|
|
|
|
|
|
|
|
|
|
||
15.5 |
|
|
|
|
|
|
|
|
6% |
15% |
|
|
|
|
|
|
|
|
|
|
|
|
|
|
|
|
|
|
|
|
|
|
|
|
|||
|
|
|
|
|
|
|
|
|
|
|
|
|
|
|
||||
15.0 |
|
|
|
|
|
|
|
|
4% |
10% |
|
|
|
|
|
|
|
|
|
|
|
|
|
|
|
|
|
|
|
|
|
|
|
|
|||
|
|
|
|
|
|
|
|
2% |
5% |
|
|
|
|
|
|
|
|
|
|
|
|
|
|
|
|
|
|
|
|
|
|
|
|
|
|||
|
|
|
|
|
|
|
|
|
0% |
|
|
|
|
|
|
|
|
|
14.5 |
|
|
|
|
|
|
|
|
0% |
Guinea- |
Guinea |
Mali Sierra Leone |
Senegal |
Global |
||||
|
|
|
|
|
|
|
|
|
||||||||||
|
|
|
|
|
|
|
|
|||||||||||
2017 |
2018E |
2019E |
2020E |
2021E |
2022E |
|
Bissau |
|
|
|
average |
|||||||
|
|
|
|
|
|
|
|
|
|
Note: Unique subscribers |
|
|
|
|
|
|
|
|
|
|
|
|
|
|
|
|
Source: GSMA Intelligence |
|
|
Source: GSMA Intelligence |
|||||||
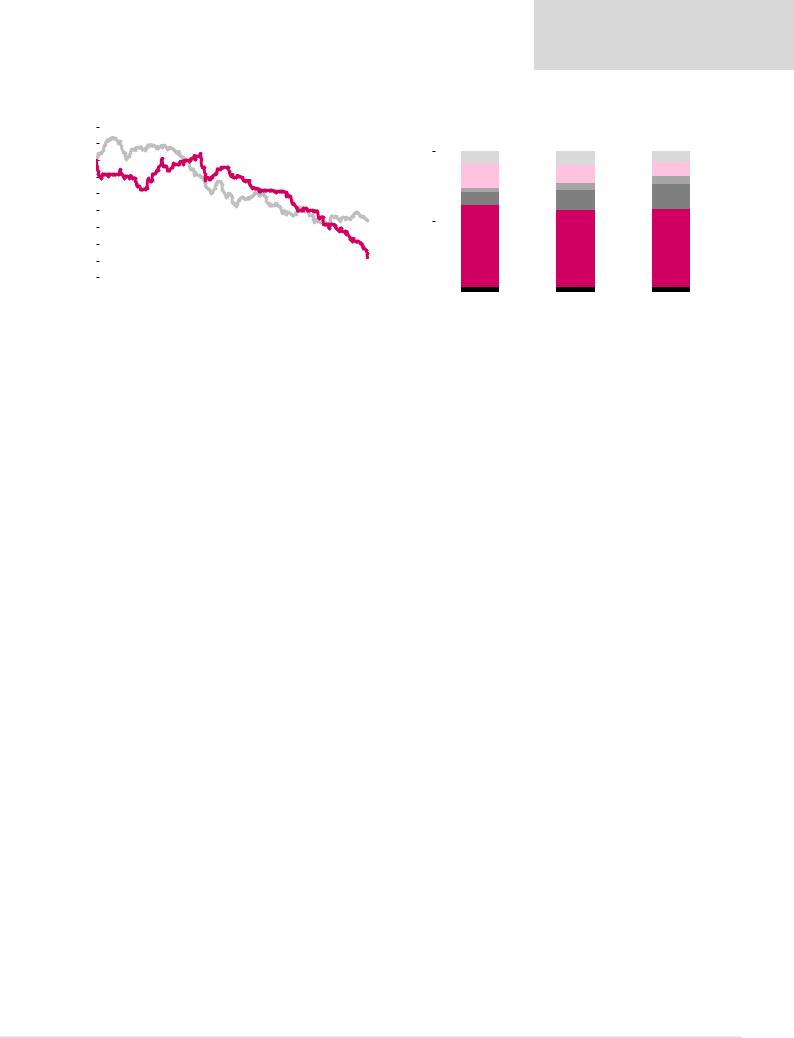
Sonatel’s share price decline by c. 25% in 2018, underperforming the MSCI frontier market index and, we believe, such a big decline was related to its unimpressive performance over the last 18 months on the back of high competition from both traditional telcos and OTT players along with the margin-dilutive Sierra Leone business acquired in 2016 (consolidated since 1H17).
In 1H18, revenue growth slowed to 4.7% YoY from 10.2% YoY (6.3% YoY excluding Sierra Leone) in 1H17, while the EBITDA margin shrank by 1.7ppts YoY to 46%, hovering around 50% before the acquisition. Additionally, pressure on margins was associated with lower mobile voice and international incoming revenue as OTTs continued to eat into them, while higher revenue from data had a margin-dilutive impact on the back of tough competition from other telcos.
36
vk.com/id446425943
Renaissance Capital
8 January 2019
EMEA telecoms
Figure 72: Sonatel vs MSCI FM index, % 2018 performance |
Figure 73: Sonatel’s revenue structure, % |
10.0%
5.0%
0.0% -5.0% -10.0% -15.0% -20.0% -25.0% -30.0% -35.0%
|
|
MSCI FM |
|
SNTC |
|
|
|
||
|
|
|
|
|
|
|
|
|
|
|
|
|
|
|
|
|
|
|
|
|
|
|
|
|
|
|
|
|
|
|
|
|
|
|
|
|
|
|
|
|
|
|
|
|
|
|
|
|
|
Jan-18 |
Feb-18 |
Mar-18 |
Apr-18 |
May-18 |
Jun-18 |
Jul-18 |
Aug-18 |
Sep-18 |
Oct-18 |
Nov-18 |
Dec-18 |
|
|
|
|
|
|
|
|
|
|
|
Source: Bloomberg |
|
|
Others |
|
|
International wholesale |
|||
|
|
|
||||||
|
|
|
||||||
|
|
Orange Money |
|
|
Mobile data |
|
||
|
|
|
|
|
||||
|
|
|
|
|
||||
|
|
Mobile (excl. data and Orange Money) |
|
Fix |
|
|||
|
|
|
|
|||||
|
|
|
|
|||||
100% |
|
|
|
|
|
|||
17.7% |
12.8% |
9.8% |
||||||
|
|
|
||||||
|
|
|
5.7% |
|||||
|
|
|
3.0% |
4.7% |
||||
|
|
|
|
|||||
|
|
|
9.1% |
13.9% |
17.8% |
|||
50% |
|
|
|
|
|
|||
58.1% |
55.0% |
55.3% |
||||||
|
|
|
||||||
|
|
|
|
|||||
0% |
|
|
|
|
|
|||
|
|
|
|
|
||||
2016 |
2017 |
1H18 |
||||||
Source: Company data
Upside risks:
▪Low mobile internet penetration across the countries of operation.
Sonatel continued to develop its 4G coverage in Senegal, Mali and GuineaBissau, contributing to an increase in data revenue of which the share in total revenue expanded to c. 18% in 1H18 vs 14% in 2017. We believe further extension of 4G coverage may represent a good opportunity for top-line growth given low mobile internet penetration among the operating footprint though competition remains high in this field.
▪Underpenetrated Guinea and Guinea-Bissau mobile markets
Mobile penetration remains low in these countries (c. 20% of total revenue in 2017) compared with regional peers, and this represents upside potential for the company, in our view. For instance, mobile penetration printed at c. 90% in Guinea and c. 70% in Guinea-Bissau vs 100-115% in Senegal and Mali in 2017.
▪Mobile financial services
Orange money continued to get traction with 5.1mn active users in 1H18 vs 3.1mn in 2016 (Safaricom’s M-PESA active users amounted to 21mn as of September 2018). Orange money is available in all of the company’s opcos and recorded a total of 467mn transactions across its markets in 2017, amounting to XOF5.2trn vs XOF1.8trn in 2015, but the contribution to total revenue was only 5.7% (M-PESA’s contribution to Safaricom’s revenue was 30% as of September18). Competition in terms of mobile financial services remains high in the SSA region, i.e. there were 57 live mobile deployments in West Africa and Orange money’s share in total active subscribers was c. 12%, while M-PESA’s was c. 28% in total active subscribers in East Africa. Aside from that, new players continued to enter the market, i.e. Expresso launched mobile money services in Senegal in February18 while Tigo and Orange already offer their services in the county. As a result, we think Orange money may be a growth driver for Sonatel in the long term, but we do not expect it to become a great contributor to the company’s revenue in the near future.
37

vk.com/id446425943
Renaissance Capital
8 January 2019
EMEA telecoms
Downside risks:
▪Increasing competition
Sonatel operates in historically highly competitive markets with several players across the countries and new entrants continuing to tap into them in 2018, i.e. Telcel started its operations in Mali in January 2018 and successfully covered the southern part of the country, while QCell received a licence to operate mobile services in Sierra Leone in 3Q18 and the process of establishing the company will be completed soon, according to management. On top of that, telcos actively invest in 4G – e.g. Tigo obtained a 4G licence in Senegal in December 2018, while Malitel started offering its LTE-based services in November 2018. Thus, we think the 4G rollout effect will be constrained by tight competition and ARPU will remain under pressure.
▪Unfavourable regulation
A new tax imposed on telecom sector by Senegal authority in 1H18 (the tax is required to be paid by any operator with a public telecoms network and has been set at 5% of an operator’s-tax turnover) maypreserve as an affordability barrier limiting top-line growth. Any further extension of the tax burden could be a significant risk for telcos, in our view.
▪Sierra Leone operations
Currently there are four players on Sierra Leone’s mobile market including Sonatel (c. 40% market share in 2017, according to the company) with one more new entrant (QCell) looming on the horizon. In 2018, Africell and Sierratel launched their LTE services, while obtaining 4G frequencies by Sonatel is currently under question, representing a risk to further expansion. In 2017, the EBITDA margin in Sierra-Leone was c. 17% vs a 40-60% range in the other countries historically. It will be challenging to ramp up quickly given high competition in the country and uncertainties around further growth.
Bottom line: We roll over our valuation to YE19, adjust our model on Sierra Leone operations and use lower multiples due to the muted growth outlook and sector derating. The company has a good dividend history and we expect a dividend yield of c. 9.5% at current prices. We lower our TP to XOF19,153 (from XOF22,593) following the lowering of our forecasts and maintain our HOLD rating.
Figure 74: Sonatel – YE19 TP calculation
WACC, % |
14% |
Perpetuity growth rate, % |
6% |
Target Mkt Cap, XOFbn |
1,814 |
DCF price per share, XOF |
18,143 |
|
|
Target EV/EBITDA, x |
4.5 |
Target EV, XOFbn |
2,173.14 |
Target Mkt Cap, XOFbn |
1,846 |
Price per share, XOF |
18,456 |
|
|
Target P/E, x |
10.5 |
Target Mkt Cap, XOFbn |
1,636 |
Price per share, XOF |
16,361 |
|
|
Target, blended (average DCF, EV/EBITDA, P/E), XOF |
17,653 |
DPS, FCFA |
1,500 |
Target price per share plus DPS, XOF |
19,153 |
Source: Renaissance Capital estimates
38

vk.com/id446425943
Renaissance Capital
8 January 2019
EMEA telecoms
Figure 75: Sonatel financials, XOFbn (unless otherwise stated)
Income statement |
2017 |
2018E |
2019E |
2020E |
Sales |
973 |
1,060 |
1,086 |
1,149 |
Cash opex |
(520) |
(588) |
(603) |
(644) |
EBITDA |
453 |
472 |
483 |
505 |
EBITDA margin (%) |
46.5% |
44.5% |
44.5% |
43.9% |
Depreciation & amortisation |
(180) |
(196) |
(201) |
(213) |
EBIT |
308 |
276 |
282 |
292 |
Net interest |
(9) |
(13) |
(13) |
(12) |
PBT |
297 |
263 |
269 |
280 |
Tax |
(95) |
(84) |
(86) |
(90) |
Tax rate (%) |
32% |
32% |
32% |
32% |
Minorities |
30 |
26 |
27 |
28 |
Net earnings |
172 |
152 |
156 |
163 |
Shares (mm) |
100 |
100 |
100 |
100 |
EPS, XOF |
1,725 |
1,522 |
1,558 |
1,626 |
DPS per common share, XOF |
1,500 |
1,500 |
1,500 |
1,500 |
Balance sheet |
2017 |
2018E |
2019 |
2020 |
Non-current assets |
1,107 |
1,127 |
1,148 |
1,170 |
Current assets |
489 |
534 |
547 |
592 |
Monetary assets |
231 |
254 |
260 |
288 |
Total assets |
1,596 |
1,661 |
1,695 |
1,761 |
Current liabilities |
661 |
715 |
733 |
775 |
Indebtedness |
305 |
305 |
305 |
305 |
Minorities and other |
90 |
116 |
143 |
171 |
Equity |
626 |
612 |
601 |
597 |
Total liabilities & shareholders' equity |
1,596 |
1,661 |
1,695 |
1,761 |
Net debt |
74 |
52 |
46 |
18 |
Cash flow |
2017 |
2018E |
2019 |
2020 |
Net earnings |
172 |
152 |
156 |
163 |
Non-cash Items |
161 |
196 |
201 |
213 |
Change in working capital |
98 |
31 |
11 |
26 |
Other adjustments |
30 |
26 |
27 |
28 |
Operating cash flow |
461 |
406 |
395 |
429 |
Capex |
(378) |
(217) |
(222) |
(235) |
Investing cash flows |
(368) |
(217) |
(222) |
(235) |
Free cash flow |
83 |
189 |
173 |
194 |
Financing cash flow |
(373) |
(167) |
(167) |
(167) |
Source: Company data, Renaissance Capital estimates
39

vk.com/id446425943
Renaissance Capital 8 January 2019
Telecoms
Figure 76: Telco valuation summary in $ terms
|
MktCap, |
EV/EBITDA |
EBITDA CAGR |
EV/(EBITDA – Capex – Tax) |
|
P/E |
EPS CAGR |
P/CE |
Div yield |
FCFF yield |
|||||
|
$mn |
2018E |
2019E |
2016-19E |
2018E |
2019E |
2018E |
2019E |
2016-19E |
2018E |
2019E |
2018E |
2019E |
2018E |
2019E |
Frontier |
|
|
|
|
|
|
|
|
|
|
|
|
|
|
|
Telecom Egypt |
1,203 |
2.7 |
3.2 |
-6.2% |
nm |
nm |
6.0 |
6.0 |
-15.9% |
3.4 |
3.3 |
8.0% |
7.9% |
-15.7% |
-14.6% |
Kcell |
1,000 |
7.2 |
7.0 |
-2.5% |
13.2 |
17.7 |
24.8 |
19.2 |
2.2% |
8.6 |
8.2 |
3.1% |
3.7% |
3.5% |
5.3% |
Global Telecom Holding |
1,012 |
3.6 |
3.8 |
-1.7% |
21.2 |
11.5 |
52.6 |
26.2 |
-32.6% |
1.9 |
1.9 |
0.0% |
0.0% |
0.3% |
2.7% |
Safaricom |
8,438 |
7.1 |
6.6 |
9.1% |
14.4 |
13.0 |
14.8 |
13.9 |
10.7% |
9.3 |
8.8 |
9.1% |
7.3% |
6.8% |
7.1% |
Sonatel |
2,962 |
4.0 |
3.9 |
5.4% |
6.8 |
6.8 |
11.0 |
10.7 |
-3.7% |
4.8 |
4.7 |
9.0% |
9.0% |
10.1% |
9.2% |
EM |
|
|
|
|
|
|
|
|
|
|
|
|
|
|
|
MTS ADR |
7,003 |
3.5 |
3.7 |
8.8% |
8.9 |
7.9 |
6.7 |
7.6 |
8.2% |
2.6 |
2.9 |
9.7% |
7.5% |
11.2% |
4.6% |
VEON |
4,392 |
3.4 |
3.3 |
-3.1% |
12.3 |
8.2 |
nm |
20.9 |
nm |
1.4 |
2.0 |
12.0% |
13.2% |
6.1% |
7.7% |
Rostelecom |
2,988 |
3.5 |
3.5 |
0.7% |
11.8 |
10.7 |
9.9 |
9.9 |
20.0% |
2.4 |
2.6 |
7.3% |
6.8% |
6.6% |
8.4% |
Turkey |
|
|
|
|
|
|
|
|
|
|
|
|
|
|
|
Turkcell ADR |
4,884 |
3.5 |
3.5 |
2.4% |
9.8 |
5.7 |
6.5 |
7.8 |
7.2% |
4.0 |
3.7 |
3.9% |
6.2% |
5.7% |
14.5% |
Turk Telekom |
2,433 |
3.4 |
3.4 |
-6.8% |
6.4 |
8.5 |
2.5 |
4.3 |
na |
14.0 |
2.5 |
0.0% |
11.3% |
13.2% |
10.8% |
Average |
|
4.7 |
4.6 |
1.0% |
11.9 |
10.3 |
15.5 |
13.3 |
3.0% |
5.6 |
4.5 |
5.8% |
6.8% |
7.2% |
8.1% |
*MTS dividend for the calendar year
Source: Bloomberg, Renaissance Capital estimates
40