

vk.com/id446425943
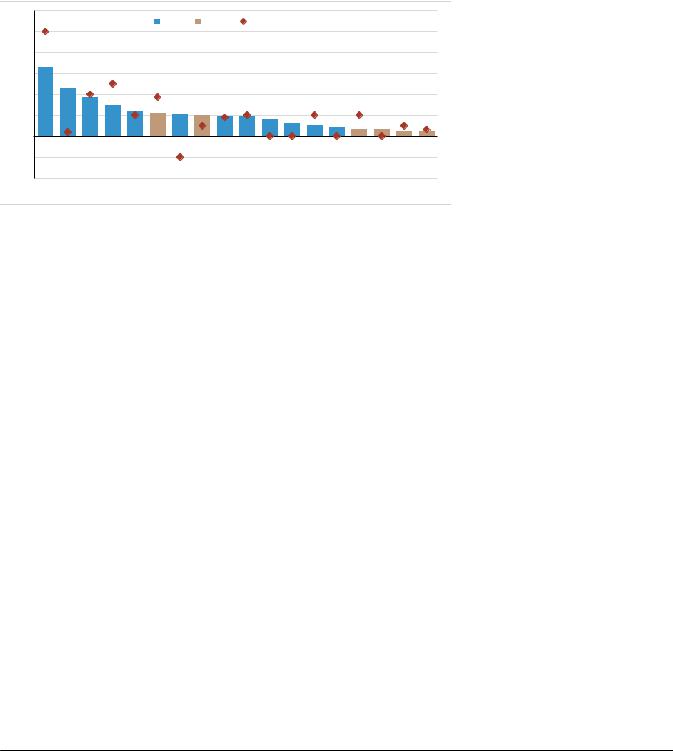
Africa and Hungary). Even here, with the exception of Brazil, no central bank is expected to significantly exceed the rate hikes of the Fed. We expect the central banks of Chile, Colombia, Czech Republic and Brazil to be more hawkish than what is priced by the markets (Figure 158). In contrast, market pricing screens too hawkish (vs UBS forecasts) in Hungary, Mexico, India and Russia.
Countries where we expect inflation to be considerably above central bank targets are Philippines, Russia, Mexico, India, Indonesia and South Africa (Figure 156). However, this is either because of one-off factors, such as a VAT hike in Russia and fuel price hike in Indonesia; or a moderation from a high level, e.g. Mexico and Philippines.
Figure 158: Market pricing of tightening expectations vs UBS forecasts
300 |
bp |
|
|
|
|
|
|
|
|
|
|
|
|
|
|
250 |
|
|
|
EM |
|
DM |
|
UBS Expected change by 2019E |
|
|
|
||||
|
|
|
|
|
|
|
|
|
|
|
|
|
|
|
|
200 |
165 |
|
|
|
|
|
|
|
|
|
|
|
|
|
|
|
|
|
|
|
|
|
|
|
|
|
|
|
|
|
|
150 |
115 |
|
|
|
|
|
|
|
|
|
|
|
|
|
|
|
92 |
|
|
|
|
|
|
|
|
|
|
|
|
|
|
100 |
|
75 |
58 |
53 |
53 |
49 |
48 |
|
|
|
|
|
|
|
|
|
|
|
47 |
41 |
|
26 |
|
|
|
|
|||||
50 |
|
|
|
30 |
|
|
11 |
|
|||||||
|
|
|
|
|
|
|
|
|
22 |
16 |
15 |
10 |
|||
|
|
|
|
|
|
|
|
|
|
|
|
|
|||
0 |
|
|
|
|
|
|
|
|
|
|
|
|
|
|
|
-50 |
|
|
|
|
|
|
|
|
|
|
|
|
|
|
|
-100 |
|
|
|
|
|
|
|
|
|
|
|
|
|
|
|
BRL HUF COP CLP ZAR USD MXN CAD ILS CZK INR RUB KRW PLN GBP AUD NZD EUR
Source: Bloomberg, UBS estimates
Curve shapes – where’s the alpha?
As shown in Figure 139 of this section, the rise in EM local rates has been driven by the rise in real policy rates, monetary policy expectations, and curve steepness. How much of the increase in back end rates is genuinely an increase in term premium, and how much owes just to future policy expectations. See Box 13. Figure 159 to Figure 161 show the level of front-end rates and 2s10s of the EM LC debt for each market vs their own five-year history, with three takeaways:
1)Tightening expectations (measured on a 2y-policy rate), with the exception of Turkey and Poland, are above 60th percentile of their five-year range. In particular, they screen highest in Chile, Russia, India and, to some degree, in China. Of these, with the exception of Chile, we think high expectations are likely to be disappointed, likely translating into some receiving opportunities.
2)Curve shapes are too extreme in South Africa, Brazil, Hungary, Poland and Colombia – these curves (except Poland) should flatten if we are right about 2019 rate hikes, especially once EMFX pressures have subsided, as we expect, from Q2 2019 onwards. In contrast, Mexico, Korea and Malaysia rate curves are too flat vs their own history, but that may be a reflection of a softening (or future expectations of) inflation profile in these countries.
3)Curvatures (2s5s10s) in EM debt are also elevated in most markets, just like the front-end curves. In particular, the curvatures are extreme vs their own history in Colombia, Brazil, Russia and South Africa (too high), while those in Thailand and India are too rich.
Front-end steepness (2y vs policy rate) in Russia, India and China is extreme…
…so is curve steepness (and curvature) in South Africa and Brazil
Global Macro Strategy 19 November 2018 |
77 |

vk.com/id446425943
Figure 159: Front end slopes in EM
3 |
|
|
|
|
|
2y vs policy rate spread |
||||||||||||
|
|
|
|
|
(Sorted by 5y percentile) |
|||||||||||||
|
|
|
|
|||||||||||||||
|
|
|
|
|
|
|||||||||||||
2 |
|
|
|
|
|
|
|
|
|
|
|
|
|
|
|
|
|
|
|
|
|
|
|
|
|
|
|
|
|
|
|
|
|
|
|
|
|
1 |
|
|
|
|
|
|
|
|
|
|
|
|
|
|
|
|
|
|
|
|
|
|
|
|
|
|
|
|
|
|
|
|
|
|
|
|
|
|
|
|
|
|
|
|
|
|
|
|
|
|
|
|
|
|
|
|
0 |
|
|
|
|
|
|
|
|
|
|
|
|
|
|
|
|
|
|
|
|
|
|
|
|
|
|
|
|
|
|
|
|
|
|
|
|
|
|
|
|
|
|
|
|
|
|
|
|
|
|
|
|
|
|
|
|
-1 |
|
|
|
|
|
|
|
|
|
|
|
|
|
|
|
|
|
|
|
|
|
|
|
|
|
|
|
|
|
|
|
|
|
|
|
|
|
|
|
|
|
10-90%ile range |
|
|
Current |
|
|
|
|
|||||||
-2 |
|
|
|
|
|
|
|
|
|
|
||||||||
|
|
|
|
|||||||||||||||
|
|
CLP |
RUB CNY INR THB KRW IDR |
ZAR COP HUF BRL MYR MXN PLN |
||||||||||||||
Source: Haver, UBS
Figure 160: 2s10s
3.52s10s curve shape
3.0 |
|
|
|
(Sorted by 5y percentile) |
|||||||||||||||
2.5 |
|
|
|
|
|
|
|
|
|
|
|
|
|
|
|
|
|
|
|
2.0 |
|
|
|
|
|
|
|
|
|
|
|
|
|
|
|
|
|
|
|
1.5 |
|
|
|
|
|
|
|
|
|
|
|
|
|
|
|
|
|
|
|
|
|
|
|
|
|
|
|
|
|
|
|
|
|
|
|
|
|
||
1.0 |
|
|
|
|
|
|
|
|
|
|
|
|
|
|
|
|
|
|
|
0.5 |
|
|
|
|
|
|
|
|
|
|
|
|
|
|
|
|
|
|
|
0.0 |
|
|
|
10-90%ile |
range |
|
|
|
Current |
|
|||||||||
-0.5 |
|
|
|
|
|
|
|||||||||||||
ZAR |
HUF BRL PLN COP RUB CNY IDR |
INR CLP THB MYR MXN KRW |
|||||||||||||||||
|
|||||||||||||||||||
|
|
|
|
|
|
|
|
|
|
|
|
|
|
|
|
|
|
|
|
Source: Haver, UBS
Figure 161: 2s5s10s
1.52s5s10s fly (2*belly-wings)
1.0(Sorted by 5y percentile)
0.5 |
|
|
|
|
|
|
|
|
|
|
|
|
|
|
|
|
|
|
|
|
|
|
|
|
|
|
|
|
|
|
|
|
|
|
|
|
|
|
|
||
0.0 |
|
|
|
|
|
|
|
|
|
|
|
|
|
|
|
|
|
|
|
|
-0.5 |
|
|
|
|
|
|
|
|
|
|
|
|
|
|
|
|
|
|
|
|
|
|
|
|
|
|
|
|
|
|
|
|
|
|
|
|
|
|
|
||
|
|
|
|
|
|
|
|
|
|
|
|
|
|
|
|
|
||||
-1.0 |
|
|
10-90%ile range |
|
|
Current |
||||||||||||||
-1.5 |
|
|
BRL KRW RUB ZAR IDR CLP CNY |
|
|
|
|
|
|
|
|
|||||||||
COP |
PLN HUF MXN MYR INR THB |
|||||||||||||||||||
|
||||||||||||||||||||
Source: Haver, UBS
EMBI likely to outperform GBI-EM in H1 2019
For full-year 2019, we expect average EM FX to deliver flat returns vs the dollar, implying better total return prospects for GBI-EM (6% returns forecast for 2019) over EMBI (4%). However, the bulk of the EM outperformance is likely to occur in H2 19 once the US fiscal impulse has peaked, EM-DM growth differential has bottomed and China stimulus (to whatever degree) starts feeding through to the data and domestic market sentiment.
As we show in Figure 162, GBI-EM has typically underperformed EMBI (on total returns) whenever the EM-US growth differential has been less than 3.5% (currently, on the IMF definition, it is close to 2%). And, the performance has been worse whenever the EM-DM growth differential has converged during slower EM growth, as we envisage in Q4 2018 and Q1 2019.
Therefore, we recommend starting the year on a defensive note, i.e. sticking to duration in markets that are positively, not negatively, affected by slower global growth, i.e. Asia (ex-Indonesia) within global EM LC debt, overweight HC debt over LC debt.
On a comparable basis, there are very few markets in EM local debt that offer a significant pickup over HC debt. The average (and median) pickup of 19 EM markets shown in Figure 163 is only 1.25%. In fact, with the exception of Mexico, Turkey, Philippines and Czech Republic, the rank of LC vs HC debt spread in most EM markets is below 25% (compared with their own five-year history).
Figure 162: GBI-EM vs EMBI relative performance and EM-US growth gap
15% |
GBI-EM vs |
|
|
|
|
|
|
|
EMBI relative |
|
|
|
|
|
|
|
|
10% |
returns |
|
|
R² = 0.2466 |
|
|
|
|
6mma* |
|
|
|
|
|
|||
5% |
|
|
|
|
|
|
|
|
0% |
|
|
|
|
|
|
R² = 0.5069 |
|
|
|
|
|
|
|
|
|
|
-5% |
|
|
|
|
|
|
|
|
-10% |
|
|
GBI-EM vs EMBI returns (Bullish divergence) |
|
||||
|
|
|
|
|||||
-15% |
|
|
GBI-EM vs EMBI returns (Bearish divergence) |
|
||||
|
|
|
|
|
|
|
|
|
0 |
1 |
2 |
3 |
4 |
5 |
6 |
7 |
8 |
|
|
|
EM vs US growth gap |
|
|
|
|
|
Source: Bloomberg, UBS. *Analysis is based on quarterly data since 2003, EM growth (y/y) refers to IMF aggregate.
Figure 163: Local debt vs hard-currency debt (10y) spread, ranked by 5y %ile
10 |
90%ile |
10%ile |
Current |
|
|||
8 |
|
|
|
6 |
|
|
|
4 |
|
|
|
2 |
|
|
|
0 |
|
|
|
-2 |
|
|
|
-4 |
MXN PHP TRY CZK RUB ZAR THB HUF IDR CLP PEN COP CNY INR MYR BRL TWD KRW PLN |
||
|
|||
Source: UBS, Bloomberg |
|
|
|
Global Macro Strategy 19 November 2018 |
78 |

vk.com/id446425943
Box 13: Where is term premium in EM local currency debt?
Although there is a vast amount of empirical literature investigating the term premia of advanced economies, similar studies for EMs are scarce. This is probably because of the lack of adequate consistent data, including surveys, and a proper OIS curve in many markets. However, that is not a good enough reason to ignore the trends and developments in EM term premia. To circumvent the data/research problem, we define a crude measure of term premia across EM LC markets, while still largely sticking to the standard definition, i.e. term premia = 10y yield - expected monetary policy path over the term. What does our analysis tell us?
•While term premia in the US and EU (on our metric) has come off since the US elections, GBI-weighted term premia has consistently risen (Figure 164). In fact, the GBI-EM weighted term premia (ex Turkey) is now at 91st percentile of its six-year history, compared with only 4th percentile for the US/EU average. The spread between the two is at postGFC highs. In short, this suggests that EM LC debt has built up enough premium amid evolving external shocks, which should act as a cushion if things were to worsen in 2019.
•Aggregate EM term premia masks the dispersion. This premia is most elevated (vs six-year history) in India, Brazil, Thailand, Hungary and Colombia (Figure 166), suggesting that these curves may have more scope for flattening if
UST sell-off were to subside or policymakers were to hike rates. In contrast, premium is close to lows in Mexico, Malaysia, Indonesia and SA, suggesting value at the front end is better than the back end (Figure 167). Curves here may have some room for steepening if there were any external/fiscal shocks (e.g. MY, SA) or monetary policy were to be eased (e.g. MX).
•The increase in premia of 2018 is different from in 2013. In 2013, the rise followed a sharp rise in US term premia. The texture of this year’s rise resembles late 2015/early 2016 to a large degree, i.e. a derivative of slower EM growth (relative to US), with currencies, credit spreads and slower bond flows driving back-end yields.
Figure 164: EM vs US and EU term premia |
Figure 165: US term premia (our estimate and ACP TP) |
140 |
|
|
Spread (rhs) |
|
|
40 |
1.3 |
|
|
|
|
|
30 |
|
|
120 |
|
|
GBI-EM (ex TRY) |
|
1.2 |
||
100 |
|
|
Avg (US and EU) |
|
20 |
1.1 |
|
|
|
|
|
|
10 |
||
|
|
|
|
|
|
|
|
80 |
|
|
|
|
|
0 |
1.0 |
60 |
|
|
|
|
|
-10 |
0.9 |
40 |
|
|
|
|
|
-20 |
0.8 |
|
|
|
|
|
-30 |
||
|
|
|
|
|
|
|
|
20 |
|
|
|
|
|
-40 |
0.7 |
|
|
|
|
|
|
|
|
0 |
|
|
|
|
|
-50 |
0.6 |
12 |
13 |
14 |
15 |
16 |
17 |
18 |
|
|
|
|
|
US term premia - Our estimates |
2.0 |
||
|
|
|
|
|
|||
|
|
|
|
UST ACP term premia (rhs) |
|
1.5 |
|
|
|
|
|
|
|
|
|
|
|
|
|
|
|
|
1.0 |
|
|
|
|
|
|
|
0.5 |
|
|
|
|
|
|
|
0.0 |
|
|
|
|
|
|
|
-0.5 |
|
|
|
|
|
|
|
-1.0 |
12 |
13 |
14 |
15 |
16 |
17 |
18 |
|
Source: Bloomberg, UBS |
|
Source: Bloomberg, UBS |
Figure 166: Term premia in key markets |
|
Figure 167: Term premia in key markets* |
|
|
|
250 |
|
HUF |
|
IDR |
|
BRL |
280 |
|
|
|
|
|
|
|
|
|
|
||||
|
|
|
|
|
|
|
|
|
|
|
200 |
|
MXN |
|
ZAR |
|
INR |
Current |
90th percentile |
10th percentile |
|
|
|
|
|
|
|
|
230 |
|
|
|
150 |
|
|
|
|
|
|
180 |
|
|
|
|
|
|
|
|
|
|
|
|
|
|
100 |
|
|
|
|
|
|
|
|
|
|
|
|
|
|
|
|
|
130 |
|
|
|
50 |
|
|
|
|
|
|
|
|
|
|
0 |
|
|
|
|
|
|
80 |
|
|
|
|
|
|
|
|
|
|
|
|
|
|
-50 |
|
|
|
|
|
|
30 |
|
|
|
|
|
|
|
|
|
|
|
|
|
|
-100 |
|
|
|
|
|
|
-20 |
|
|
|
|
|
|
|
|
|
|
|
|
|
|
-150 |
|
|
|
|
|
|
-70 |
|
|
|
|
|
|
|
|
|
MXN MYR MYR IDR PLN krw RUB TRY COP HUF THB BRL |
INR |
|||
12 |
13 |
14 |
15 |
16 |
17 |
18 |
|
|
|
|
Source: Bloomberg, UBS |
Source: Bloomberg, UBS *Percentiles since 2012 over weekly data |
Rohit Arora
Global Macro Strategy 19 November 2018 |
79 |

vk.com/id446425943
Putting everything together
Our duration scorecard (Figure 168) captures most of the parameters discussed: real yields adjusted for credit risks/macro strength, domestic market depth, curve shapes and spread of local debt over HC debt. It supports our bottom-up views and recommendation, and our preferences in regional rates:
•In LatAm, although Brazilian rates stand out as rich on some of our fairvalue metrics, we think this is mostly because of the FX volatility which had risen ahead of the elections. However, with the event risk subsiding, the elevated real yields and steep curve shape still make BRL debt one of the most attractive in EM. We have added long Brazil duration as our top EM cross asset trade for 2019. In contrast, we find monetary policy as still loose in Colombia and Chile and will look for opportunities to pay rates in COP, CLP front end. In MXN rates, while we continue to see rate cuts and value in MXN TIIE receivers, we are cognisant that recent concerns around AMLO’s spending plans and fiscal stability could keep risk premia elevated in the near term.
•In EMEA, Russia stands out as the most attractive debt market, and ranks number one, by far, on our duration scorecard. However, we are cognisant that the elevated risk premia reflects sanctions-related uncertainty. Nonetheless, on a valuation basis, we find Russian debt attractive over some low yielders, such as Poland, Hungary and Czech Republic.
•In Asia, on our scorecard, India and Indonesia debt stand out as most attractive owing to elevated real yields. The cheapness in both has come amid CA deficit woes and related rate hikes. Of the two, we have a mild preference for India (and less so for Indonesia) because of IGBs’ smaller reliance on external flows and domestic market depth. Within low yielders, we think the weak domestic growth backdrop is likely to continue to weigh on the China bond yields. Our economists also expect the PBoC to guide market rates lower. Therefore, we have a bias to receive back end in CNY rates, and less so for KRW rates especially as rate hike expectations from the BoK have fallen close to 30bp for the coming two years (nothing after 30 November 2018 hike), and curve is extremely flat. Lastly, within the two south Asian low-yielders, we find
Thailand back end rates as attractive, where we expect the central bank to remain on hold through 2020 and the curve is quite steep.
Malaysia rates, in contrast are susceptible to a re-pricing of credit/FX risk, amidst shrinking pool of FX reserves.
Global Macro Strategy 19 November 2018 |
80 |
vk.com/id446425943
Figure 168: Duration Scorecard
An ordinal ranking of valuation in EM duration (lower scores = greater value)
|
Real rates adjusted for credit |
Nominal Coupon |
|
Curve Slope |
|
Liquidity |
LC vs HC |
|
|||
|
proxy |
|
|
Valuation |
|
||||||
|
|
|
|
|
|
|
|
|
|||
|
Deviation of real |
|
|
Nominal |
|
|
|
10y yield - |
|
LC Bond Yld - |
|
|
Real spread to |
|
spread over |
2s10s |
2s10s*** |
|
Flows |
|
|||
|
yield from MBS (ex |
Nominal |
|
12m FX |
HC Bond Yld |
|
|||||
|
Leverage) - |
DM (percentile |
Yield |
DM |
level*** |
(percentile |
|
hedging |
Vulnerabilit |
(percentile over |
Score |
|
predicted value* |
over 7y)** |
|
(percentile |
(%) |
over 7y) |
|
cost |
y (rank) |
last 7y) |
|
|
|
|
over 7y) |
|
|
|
|
|
|||
|
|
|
|
|
|
|
|
|
|
|
|
|
|
|
|
|
|
|
|
|
|
|
|
|
40% |
10% |
10% |
10% |
5% |
5% |
|
5% |
10% |
5% |
|
Russia |
|
|
|
|
|
|
|
|
|
|
4.0 |
1 |
69% |
8.8 |
46% |
0.7 |
60% |
|
4.3 |
5 |
42% |
||
Brazil |
3 |
21% |
10.3 |
10% |
2.8 |
93% |
|
7.6 |
14 |
5% |
6.1 |
Mexico |
5 |
99% |
8.7 |
99% |
0.3 |
21% |
|
2.7 |
17 |
98% |
6.9 |
Indonesia |
4 |
78% |
8.0 |
48% |
0.8 |
58% |
|
2.4 |
19 |
39% |
7.1 |
Singapore |
2 |
14% |
2.5 |
37% |
0.4 |
1% |
|
3.6 |
8 |
11% |
7.9 |
India |
11 |
88% |
7.8 |
19% |
0.3 |
70% |
|
4.5 |
2 |
8% |
8.4 |
Israel |
7 |
9% |
2.3 |
18% |
1.8 |
58% |
|
5.4 |
8 |
11% |
9.0 |
Thailand |
6 |
14% |
2.8 |
6% |
0.9 |
51% |
|
3.9 |
4 |
10% |
9.0 |
Chile |
8 |
40% |
4.8 |
0% |
0.6 |
40% |
|
13.2 |
6 |
0% |
9.4 |
S Africa |
16 |
82% |
9.1 |
68% |
1.6 |
66% |
|
4.6 |
13 |
39% |
9.9 |
Malaysia |
12 |
84% |
4.1 |
15% |
0.6 |
28% |
|
3.5 |
7 |
2% |
10.7 |
Colombia |
14 |
47% |
7.1 |
37% |
1.7 |
76% |
|
5.5 |
18 |
10% |
10.8 |
Korea |
9 |
62% |
2.3 |
0% |
0.3 |
21% |
|
3.9 |
3 |
0% |
10.9 |
China |
13 |
20% |
3.5 |
1% |
0.4 |
50% |
|
2.5 |
1 |
4% |
12.1 |
Taiwan |
10 |
40% |
0.9 |
0% |
0.4 |
7% |
|
4.1 |
8 |
0% |
12.3 |
Czech R |
15 |
13% |
2.1 |
52% |
0.6 |
14% |
|
3.8 |
8 |
47% |
12.7 |
Hungary |
18 |
7% |
3.7 |
12% |
2.0 |
84% |
|
6.2 |
8 |
12% |
12.8 |
Turkey |
19 |
1% |
16.6 |
95% |
-3.8 |
3% |
|
-4.0 |
15 |
94% |
14.2 |
Poland |
17 |
4% |
3.2 |
7% |
1.7 |
91% |
|
4.4 |
16 |
0% |
14.5 |
SBI CDS used to proxy India sovereign CDS. 5y CDS data for Taiwan and Singapore taken as United States CDS *Real yield is calculated by deflating 10y nominal yields by average 2019 and 2020 consensus inflation forecasts
** Real yields are calculated here by deflating nominals with Core CPI sequential growth (6m trimmed mean SAAR) and for latest numbers deflated by average of 2019 and 2020 consensus inflation expectations
*** Due to data limitations, 2y swaps are instead of bonds used for Israel and S. Africa
Source: Bloomberg, Haver, UBS * Deviation of real yield from MBS (ex leverage) predicted value rank is derived from the residuals of a 2nd degree polynomial regression of real yields upon our MBS (ex leverage) score. Higher residuals (higher real yields relative to credit risk) are considered attractive.
Global Macro Strategy 19 November 2018 |
81 |