

vk.com/id446425943
The big de-rating of 2018: what next?
One could make the case that 2018 was the year of a bear market…for the multiple. Peak to trough, the S&P 500 P/E declined by over 3x and over 20%. Thus much of 2018 has been about de-risking around increasing risks and uncertainties: inflation, rising rates, tariffs and trade war, European politics, EM weakness and slowing growth concerns. Coming into 2018, we saw the market as priced for higher rates but not higher growth. However, trade risks were more than we had expected, and the second order impacts on China and markets have been notable.
16% median returns in year after de-rating
With a higher risk premium priced by the market, we use history to see how the market has performed following big de-ratings in the S&P 500 P/E multiple. Interestingly, we find that in years following a decline in the P/E of more than 1x, the S&P 500 has returned an average and median of 16% with only two instances of negative returns (2000-01, 1973-74). There has been a higher percentage of years with 0-5% returns, which have happened 20% of the time. History would suggest that the balance of risks is still to the upside.
We reduce our 2018 S&P 500 price target to 2875 given heightened volatility.
We target 3200 for the S&P 500 at the end of 2019 on 7% EPS growth and a rise in the multiple in line with history after deratings.
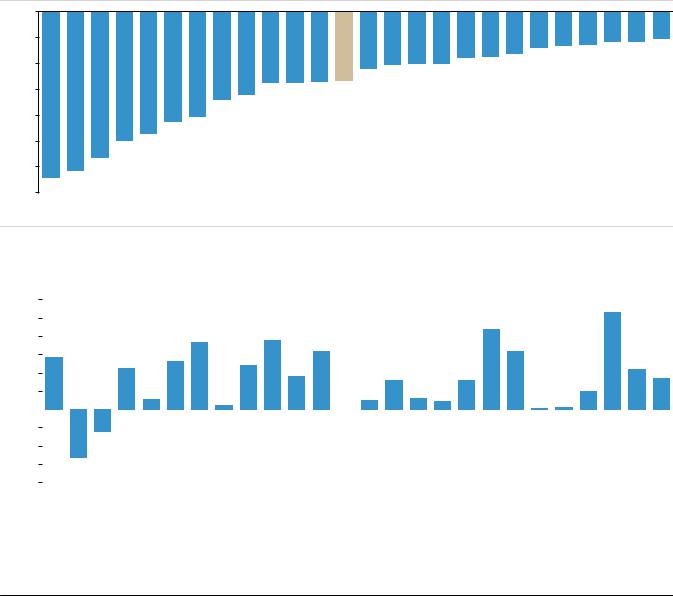
Figure 1: The decline in the P/E in 2018 was among the largest in the post WWII period
0.0x
-1.0x
-2.0x
-3.0x
-4.0x
S&P 500 P/E annual change
-5.0x
-6.0x |
|
|
|
|
|
|
|
|
|
|
|
|
|
|
|
|
|
|
|
|
|
|
|
|
|
-7.0x |
|
|
|
|
|
|
|
|
|
|
|
|
|
|
|
|
|
|
|
|
|
|
|
|
|
2002 |
1973 |
2000 |
1962 |
1947 |
2008 |
1974 |
2010 |
1966 |
1994 |
1948 |
1988 |
2018 |
2004 |
2011 |
1977 |
1969 |
2005 |
1957 |
1984 |
1959 |
1993 |
1992 |
1953 |
1981 |
1987 |
Source: S&P, Haver, UBS
Figure 2: S&P 500 returns in the year after a large decline in the P/E
60% |
|
|
|
|
|
|
|
|
|
|
|
|
S&P 500 total return |
|
|
|
|
|
|
|
|
|
|
|
||||
|
|
|
|
|
|
|
|
|
|
|
|
|
|
|
|
|
|
|
|
|
|
|
||||||
|
|
|
|
|
|
|
|
|
|
|
|
|
|
|
|
|
|
|
|
|
|
|
|
|||||
50% |
|
|
|
|
|
|
|
|
|
|
|
|
|
|
Average = 16% |
|
|
|
|
|
|
|
|
|
|
|||
40% |
|
|
|
|
|
|
|
|
|
|
|
|
|
|
Median = 16% |
|
|
|
|
|
|
|
|
|
|
|||
|
|
|
|
|
|
|
|
|
|
|
|
|
|
|
|
|
|
|
|
|
|
|
|
|
||||
30% |
|
|
|
|
|
|
|
|
|
|
|
|
|
|
|
|
|
|
|
|
|
|
|
|
|
|
|
|
20% |
|
|
|
|
|
|
|
|
|
|
|
|
|
|
|
|
|
|
|
|
|
|
|
|
|
|
|
|
10% |
|
|
|
|
|
|
|
|
|
|
|
|
|
|
? |
|
|
|
|
|
|
|
|
|
|
|
|
|
0% |
|
|
|
|
|
|
|
|
|
|
|
|
|
|
|
|
|
|
|
|
|
|
|
|
|
|
|
|
|
|
|
|
|
|
|
|
|
|
|
|
|
|
|
|
|
|
|
|
|
|
|
|
|
|
|
|
|
-10% |
|
|
|
|
|
|
|
|
|
|
|
|
|
|
|
|
|
|
|
|
|
|
|
|
|
|
|
|
-20% |
|
|
|
|
|
|
|
|
|
|
|
|
|
|
|
|
|
|
|
|
|
|
|
|
|
|
|
|
-30% |
|
|
|
|
|
|
|
|
|
|
|
|
|
|
|
|
|
|
|
|
|
|
|
|
|
|
|
|
-40% |
|
|
|
|
|
|
|
|
|
|
|
|
|
|
|
|
|
|
|
|
|
|
|
|
|
|
|
|
|
|
|
|
|
|
|
|
|
|
|
|
|
|
|
|
|
|
|
|
|
|
|
|
|
|
|
||
2003 |
1974 |
2001 |
1963 |
1948 |
2009 |
1975 |
2011 |
1967 |
1995 |
1949 |
1989 |
2019 |
2005 |
2012 |
1978 |
1970 |
2006 |
1958 |
1985 |
1960 |
1994 |
1993 |
1954 |
1982 |
1988 |
|||
|
|
|
|
|
|
|
|
|
|
|
|
|
|
|
|
|
|
|
|
|
|
|
|
|
|
|
|
|
|
|
|
|
|
|
|
|
|
|
|
|
|
|
|
|
|
|
|
|
|
|
|
|
|
|
|
|
|
Source: S&P , Haver, UBS
US Equity Strategy 13 November 2018 |
3 |

vk.com/id446425943
P/E has recouped ~30% of fall, ~40% of industry returns reversed
There has been an inverse correlation between the change in the S&P 500 P/E in a given year and the change in the P/E the following year. For the most part, years of big declines in the P/E have been followed by increases in the P/E (and vice versa). The market multiple has historically recouped almost 30% of the prior year derating, or fallen by the same in the case of a re-rating up. The beta in a regression between the prior year's P/E change (%) and the subsequent one is 0.27. Of course there are outliers when that has not been the case such as 1973-74.
Sector and IG returns tend to reverse as well (~40%). Following years of large de-ratings in the S&P P/E, we find that there has also been an inverse relationship between the sector and industry group ("IG") returns in the year of the P/E decline and the respective sector and IG returns in the subsequent year. Sectors and IGs that underperformed or declined the most in the years of the de-ratings for the most part outperformed or did much better in the following year. Sectors and IGs that outperformed the most tended to lag in the following year. Bearing in mind that the cycle and industry dynamics likely matter more, this finding suggests that investors should also be looking to add some laggards as we head into 2019.
We see potential for a catch-up trade at the end of 2018 and early 2019.
Trade de-escalation or an agreement not to escalate further at the Trump-Xi G20 meeting could be a catalyst, as could China stimulus or a RoW growth pick-up. However, given still sizeable risks around trade and the cycle, we look for value in some of the laggards as it relates to sectors and industries and the respective trends around the key themes, discussed below.
Market usually peaks when ISM <50; Aug-18 peak points to Oct-20 trough.
Average timing of ISM mfg cycles would have pointed to a peak in Feb-18 (that was it) but tax stimulus likely lengthened the US cycle by 6m+ (Aug peak). Tariffs have been a headwind since. Average timing in the ISM cycle would have pointed to a mid-trough in April 2019 and a trough in April 2020. Assuming the tax cut shifted the US cycle out 6m, the mid-trough would be Oct 2019 and trough in Oct 2020. However, later cycle fiscal stimulus and tariffs are likely impacting the timing and magnitude of the cycle, making it choppier with greater two-sided risk.
Figure 3: S&P 500 P/E annual % chg – current vs. next year
Y = S&P 500 P/E next yr % change
45%
X = S&P 500 P/E annual % change
30%
15%
0%
-15%
y = -0.26x + 0.04
-30%
-45% -45% -30% -15% 0% 15% 30% 45% 60%
Source: S&P, IBES, FactSet, Haver, UBS
Figure 4: Sector & IG returns during and after de-ratings
Sector & IG relative returns:
(X) Year of de-rating; (Y) Year after
80% |
|
|
|
|
|
|
60% |
|
|
|
|
y = -0.39x + 0.12 |
|
|
|
|
|
|
||
40% |
|
|
|
|
|
|
20% |
|
|
|
|
|
|
0% |
|
|
|
|
|
|
-20% |
|
|
|
|
|
|
-40% |
|
|
|
|
|
|
-60% |
|
|
|
|
|
|
-60% |
-40% |
-20% |
0% |
20% |
40% |
60% |
Source: S&P, IBES, FactSet, Haver, UBS
US Equity Strategy 13 November 2018 |
4 |