

Mechanical Properties of Ceramics and Composites
.pdf210 |
Chapter 3 |
surface are close to those of similarly finished single crystals. On the other hand, while there is no single crystal data, polycrystalline strengths for bars with the substantially oriented SbSI grains normal to the stress show strengths constant at low values ( 15 MPa) for grains with lengths and diameters respectively of 300, 55 and 6000, 600 µm (Fig. 3.32). Finally, Mar and Scott [290], who fabricated sapphire bicrystals of controlled orientation, showed that when the c-axis misorientation across the bicrystal (tilt) boundary was > 36°, the bicrystals had spontaneous fractures from the TEA, hence essentially zero strength, but pure twist boundaries were mechanically sound.
The above sapphire bicrystal observations, as well as general considerations, clearly show that there can be substantial variations in strengths along multiple paths, transitioning from larger G to single crystal strengths dependent on material, specimen/grain size, and test method (Fig. 3.1). Thus specimens of Al2O3 with specimen-to-grain-size ratios that approximate tests of one or more bicrystals in series will have strengths ranging from zero to whatever value of strength the weakest boundary allows due to its TEA stresses. Tests of specimens with only one grain boundary across the specimen cross section, i.e. a single bicrystal, will vary from zero strength to higher values than for specimens with more boundaries along the length of the specimen, but each boundary extending across the specimen cross section. Similarly, larger specimens that have more than one grain boundary across a specimen cross section, i.e. have some boundaries intercepting parallel stress paths, would have lower maximum strengths, but less frequent zero strengths, since when some boundaries have zero strength, others having some strength could carry part of the load giving strengths > 0. Similar but generally significant effects due to EA are also likely to occur but often to be less severe than those of TEA.
Besides the above direct experimental evidence of TEA effects on sapphire bicrystal strengths, there is additional evidence of effects of TEA stresses affecting strengths not only when fracture of a single boundary is involved but also when fracture involves many grains. Thus Rice et al. [101, 102, 234, 291, 292] showed that as the flaw-to-grain-size decreased for noncubic materials due to increasing contributions of TEA or transformation stresses to failure, their contribution manifests itself as a reduction of the fracture toughness or energy calculated from the applied stress at failure and the flaw dimensions, geometry, and location. These stress contributions extrapolate to or above typical strengths of ceramics studied (Fig. 3.35) consistent with strengths going to zero in many sapphire bicrystals. However, effects of TEA stresses can impact strengths where multigrain flaws are involved, as revealed by measurements of the sizes of fracture mist, hackle, or macrocrack branching boundaries in materials with moderate to high TEA and related stresses, e.g. Al2O3 and B4C to Pyroceram, graphite, and PZT [102]. This shows that effects of such stresses are manifesting themselves in the fracture processes occurring in these materials at ≥10 times the flaw

Grain Dependence of Ceramic Tensile Strengths at 22°C |
211 |
FIG. 3.35 Plot of TEA and related microstructural (internal) stress contribution to failure as a function of flaw size extrapolated to the range of the size of the grains. (From Rice et al. [291, 292], published with the permission of Plenum Press.)
sizes, e.g. starting at crack sizes of 1–4 mm. Again similar, but lesser, effects are expected from EA, for which observations on other mechanical properties such as spontaneous fracture and hardness have been indicated (Chap. 2, Sec. III.C and Chap. 4, Sec. II.D).
B.Quantitative Evaluation of the σ – G-1/2 Model Parameters
Numerical evaluation of the basic fracture mechanics parameters underlying the c – G relations of the model (Fig. 3.1) based upon the survey σ – G-1/2 data is summarized in Table 3.1. Using the σ values for failure at the indicated large G–fine G branch intersections and pertinent toughness (K) values, the c values are calculated by
c = 0.63(K/σ)1/2 |
(3.3) |
assuming a half penny flaw. About 60% of the resultant c values are within a factor of 2–3 of the observed G value at the transition, in spite of uncertainties
212 |
Chapter 3 |
both of measurement of G values and of which G and K values to use (an average G was used in most cases). Further, several of the cases where c is >3G at the intersection based on a half penny crack would be reduced for a more elongated crack (a slit crack reduces the numerical factor in Eq. (3.3) from 0.63 to 0.25, making the majority of these remaining intersections fall within c≤3G). This transition from larger to finer G branches at c > G/2 is consistent with Singh et al.’s model and data indicating the single-to-poly-crystal KIC transition occurs over a few to several grains rather than 1 [287]. The calculated large G slopes range from somewhat below single crystal to polycrystalline KIC values (as do such slopes for other materials, e.g. Cr3C2) HfC, TaC, WC, and ZrC). While three of these cases are due to investigators using Gm (Alford et al. [27] and Virkar and Gordon [195]) three are related to studies using an average G. One of the latter (MgAl2O3) shows the single crystal–polycrystalline KIC transition over 1 grain [28], hence consistent with the large G slope being KIC. While the range of slopes in part reflects uncertainties in the G values to use, it is consistent with crack growth modeling noted earlier, especially when the possibility of grain boundary KIC’s substantially (e.g. twofold) lower than single crystal KIC’s is considered.
Numerical evaluations corroborate two basic expectations of the model, namely that larger G branch slopes are < the polycrystalline toughness values, and that intersections of finer and larger G branches occur when flaw and grain dimensions are about the same and typically reasonably within the bounds of c G/2 to 3G (Table 3.1). Further, there is no apparent difference in such comparisons whether the materials are cubic or noncubic, again arguing against TEA stresses, which occur only in noncubic materials, determining σ – G behavior. Thus TEA stresses (and EA stress concentrations) do not determine the basic behavior of the model, but can impact behavior and model parameters, e.g. possibly modifying slopes, and especially impacting the transition from larger G to single crystal behavior. Also there is some indication of the calculated flaw sizes for failure of bodies with as-fired surfaces being somewhat larger than the grain dimensions at the larger–finer G branch intersections (e.g. data of Charles, Hing, and Alford et al. in Table 3.1). While this clearly needs more evaluation, it is consistent with expectations, since grain boundary grooves are probably not as severe flaws as cracks, which is consistent with their effective flaw size typically being a fraction of G, e.g. the calculations in Table 3.1 assume a sharp flaw which then predicts a flaw size larger than G. Finally, while the TZP and PSZ data sets, especially the latter, are not as adequate as desired, numerical evaluations of the limited data suggests that projected larger–finer G branch intersections may give similar results to the other ceramics.
It is important to recall that in calculations concerning large grains as flaws the small dimension of the grain on the fracture is the flaw size, not the larger one [which enters via the flaw geometry factor, Y of Eq. (2.2)], again ar-
Grain Dependence of Ceramic Tensile Strengths at 22°C |
213 |
guing against plotting data versus Gm. For example, Prochazka and Charles [96] plotted σ (<140 to 350 MPa) vs. the length (L) of the large tabular (exaggerated) α-grains at fracture origins in the β-SiC matrix, obtaining a slope of 3.9 MPa·m1/2 with a G= ′ intercept at 70, not 0, MPa). However, use of a G value based on the equivalent circular area (assuming the grain width 10% of their length, per their micrographs) lowers the slope to 2.3 MPa·m1/2, which is more consistent with other data.
VIII. CORRELATION OF TOUGHNESS, TENSILE STRENGTH, AND YOUNG’S MODULUS
A key question to be addressed is the toughness–strength–reliability relations, the latter as commonly measured by the Weibull modulus. This arises since toughening mechanisms such as transformation toughening and crack branching, bridging, and related phenomena, and possibly microcracking, have been cited as means of increasing reliability, often with limited loss of, or increased, strength. Unfortunately, many investigators have assumed this is correct, and thus only measured toughness, neglecting strength or Weibull evaluations or both. However, there are some studies that provide further information as well as broader evaluations of self consistancy of toughness and strength that provide insight. These in fact show first that toughness can increase while strength decreases. Second and more broadly significant, increased tougheness leads to increased reliability in only limited cases where significant toughening occurs at sufficiently fine grain size.
Consider first evaluation of the self-consistency of the microstructural dependence of toughness with that of tensile strength, which provides by far the largest data base and a clear picture of broad discrepancies. Comparison of the porosity dependence of toughness and strength has clearly shown that high toughness from phenomena such as crack bridging associated with large cracks usually has no relation to strengths typically controlled by much smaller cracks [5, 6]. Similar comparison of the grain dependence of toughness and strength shows the same general discrepancy, as can readily be seen by comparing behavior in Chap. 2 and this chapter. Consider first noncubic materials, which provide more opportunity for toughening via crack branching and bridging due to TEA stresses, which have been cited as a source of such toughening and resultant σ–G behavior [131]. Thus many studies of noncubic materials show KIC, and especially γ, independent of G at finer G, then rising and passing through a maximum as G increases [293] (Figs. 2.15 and 2.16). This is basically inconsistent with essentially all σ – G data (except possibly one set of Chandler and colleagues [169, 170], extruded BeO data having increasing orientation with increasing G), since none show the corresponding increasing σ with increasing G. The resolution of this dilemma is the recognition that much crack complex-
214 |
Chapter 3 |
ity (e.g. deflection, branching, bridging and related R-curve effects) that accounts for such KIC and γ increases with G occurs on a substantially larger (e.g. mm) scale than normal strength controlling flaws, which are commonly a few tens of microns. Thus there is progressively less opportunity for the crack complexity observed with large cracks to be operative as c → G. Further, since failure is a weak link process, it wll occur from the flaw having the lowest surrounding KIC, i.e. the least opportunity for crack complexity. This is consistent with R-curve effects, and other extremes of KIC (e.g. in PSZ) not controlling the initial σ, but with σ retained after thermal shock [293], i.e. with larger scale crack propagation.
Consider next cubic materials, where crack bridging has also been reported (Chap. 2, Sec. III.E). Most fracture toughness (KIC) or energy (γ) data for them shows little or no G dependence over the ranges studied (e.g. > 1 µm to 200 µm) and hence is not necessarily inconsistent with σ–G behavior [293, 294]. However, recent cubic (β) SiC data shows a KIC maximum at G 0.5 µm [258] (Figure 2.14), which is consistent with earlier data for very fine (0.01–0.1 µm) G, CVD SiC (though complicated by residual stresses) indicating a lower KIC than for normal G SiC (i.e. with G ≥ 1 µm).
The first of two other evaluations of the relation of toughness and strength is to compare both toughness (K) and strength (σ) to Young’s modulus (E). It is readily argued that barring some enhancement of toughness beyond simple elastic behavior, i.e. due to effects such as transformation toughening or crack branching/bridging, toughness will scale with E per Eq. (2.2). Various authors have shown that most ceramics exhibit such K–E correlation (Fig. 3.36A). Data points scattered below the average trend (i.e. MgAl2O4, MgO, B, B4C, SiC, and to a lesser extent TiO2) all reflect extensive transgranular fracture and known, or expected, easy cleavage on one or more sets of planes that are multiple in occurrence, e.g. {100} or {110} representing respectively three and four sets of planes [295]. This is in contrast to many, possibly all, of the materials above the average trend having fewer or less easy cleavage planes or both. Thus beta alumina has only basal cleavage, i.e. only one plane, and Al2O3 and TiB2 are not known to have any cleavage and to have some, to substantial, intergranular fracture.
The counterpart of the above comparison is evaluation of strength trends as a function of E. Since σ KIC(c)-1/2, and polycrystalline KIC values tend to be proportional to E, comparison of strengths for similar c and G values for each material should also correlate with E and give insight to σ – KIC relations. Since the size and shape of machining flaws do not vary much for a given machining direction, much data satisfies this condition, especially at the same finer G( 4 µm in Fig. 3.36B) where effects of G on flaw geometry are not a factor and the polycrystalline K is pertinent. Such σ–E correlation is clearly better than the K–E (Fig. 3.36A). The three low, but not extreme, deviants from this trend, CaZrO3, BeO, and TiB2, probably reflect less development relative to most of the

Grain Dependence of Ceramic Tensile Strengths at 22°C |
215 |
FIG. 3.36 Plots showing the correlations of (A) fracture toughness (K) and (B) tensile strength, both versus Young’s modulus (E) for various ceramics respectively. (From Rice [293]), published with the permission of the Journal of Materials Science.)
other materials. The extreme high deviant is tetragonal ZrO2 (TZP), which is consistent with transformation toughening increasing K above levels expected from those correlating with E. The next highest deviant from the σ – E trend is Si3N4, which is consistent with the lower, but not the upper, portion of its K – E trend. Similarly, note that the σ – E trends do not correlate with the higher K values for TiO2, BeO, Al2O3, and TiB2. Similar issues of basic differences between σ and K results will be shown for particulate composites, and serious differences have been shown as a function of porosity [6, 293].
Note that the mechanical properties of highly oriented CVD graphite in the three directions relative to its orientation (Table 2.4), while falling above trends of Figs. 3.36A and 3.36B, show similar trends. However, the orientation with delamination normal to the crack deviates the most, again particularly for K – E correlation, consistent with much of the higher large crack K not manifesting itself in strength.
Per the above theoretical and experimental correlation of strength and Young’s modulus it is useful to consider σ – G-1/2 data normalized by Young’s modulus. Doing this using E values in Table 3.2 brings most materials’ σ – G-1/2 behavior closer (Fig. 3.37). This results in no distinction between cubic and non-

216 |
Chapter 3 |
FIG. 3.37 Normalized σ–G-1/2 data for various ceramics at 22°C to the same Young’s modulus as for Al2O3 ( 400 GPa, i.e. the σ plotted is that of the materialtimes 400/Em, where Em = Young’s modulus of the material, from Table 3.2). Note that more recent data has increased both the ZrO2 and Si3N4 data, and that diamond data (per Fig. 3.14, but not included for clarity) falls in the main body of data, e.g. in the range for Al2O3 and BeO.
cubic materials, indicating that such structural differentiation does not correspond to any basic σ – G-1/2 trends. Further, there is no clear difference for materials where microplasticity can determine strength, e.g. CaO, MgO, and BaTiO3. The one pronounced differentiation in Fig. 3.37 is that of transformation toughened ZrO2, especially TZP. Another is Si3N4 densified with oxide additives, especially since recent developments have raised this curve closer to or above the toughened ZrO2 curve, which has also increased. These two outstanding material systems reflect higher toughnesses with finer G, so much of this toughness also impacts strength, both by limiting flaw sizes, as was noted earlier, and by inhibiting flaw failure.
Grain Dependence of Ceramic Tensile Strengths at 22°C |
|
217 |
|||||
TABLE 3.2 Young’s Moduli (E in GPa) Used to Normalize Ceramic σ–G |
|
||||||
Relations |
|
|
|
|
|
|
|
|
|
|
|
|
|
|
|
Material |
E |
Material |
E |
Material |
E |
Material |
E |
|
|
|
|
|
|
|
|
Al2O3 |
400 |
TiO2 |
285 |
BaTiO3 |
190 |
MgAl2O4 |
294 |
BeO |
395 |
ThO2 |
250 |
β-Al2O3 |
200 |
Diamond |
1050 |
CaO |
200 |
UO2 |
230 |
CaZrO3 |
180 |
SiC (β) |
400 |
MgO |
355 |
ZrO2 |
230 |
Li4SiO4 |
138 |
ZrC |
400 |
|
|
|
|
|
|
|
|
IX. TENSILE STRENGTH VERSUS TOUGHNESS AND RELIABILITY
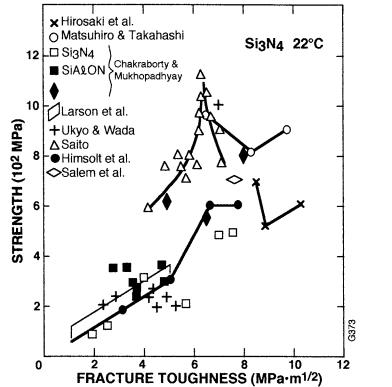
An important extension of the above evaluations is directly to compare σ as a function of K for a given material, and hence also usually as a function of G, which sheds light on important exceptions, at least more extreme ones of TZP and in situ toughened Si3N4. Such K–σ deviations were first shown by Swain and Rose [296] for PSZ showing strength increasing with increasing toughness but then reaching various process (hence microstructure) dependent maxima, beyond which strengths decrease despite further increase in K (though this generally also begins to decrease with increased G, but often at larger G values). Various portions of such σ–K curves for various TZP materials are shown in Fig. 3.38, and for various dense Si3N4 bodies in Fig. 3.39. In TZP materials there is a general correlation of strength and toughness till substantial toughnesses are reached, with similar G dependence of strength (Fig. 3.21). The peaks in strengths and subsequent decreasing strength with further increase in toughness may correspond respectively to the intersection of the finer and larger G branches and the larger G branch itself. However, a study to verify this and to find whether there are differences from nontoughened bodies has not been done. Si3N4 σ–G behavior appears consistent with toughening and strengthening in finer G bodies but is not sufficiently detailed to confirm this. However, it clearly shows strength increasing as toughness increases, reaching a probable maximum and then decreasing. A key reason for strengths ceasing to increase with increasing toughness is that a sufficiently stressed region of sufficient scale and weakness will become the origin of failure in tensile stressing as a natural consequence of its meeting the failure criteria. On the other hand, propagation of a crack, especialy a larger one, arbitrarily introduced elsewhere in the body into such a region, can readily result in crack branching, bridging, or other toughening mechanisms. In toughened zirconia bodies, the decrease in strength may be precipitated by microcracking, usually of larger size and greater extent due to larger grain, precipitate size, or both, or by increased grain boundary phase (in PSZ). In Si3N4, strength maxima are usually the result of failure initiation from larger isolated or clustered grains, especially in self-reinforced bodies

218 |
Chapter 3 |
FIG. 3.38 Flexure strength versus toughness of various TZP bodies [179–181, 183, 302]. Note (1) stabilization (mostly Y2O3) shown in m/o, and (2) that such curves are similar to those shown for PSZ materials by Swain and Rose [296], but these for TZP are often stretched out over a larger K range. The three data points for TZP of Theunissen et al. [303] fall in the same range as the upper portion of the data of Ruiz and Readey [304]. Note similarity to Fig. 3.39.
[297–300]. These observations are consistent with observations of Becher et al. [301] that uncontrolled development of larger, elongated grains increases toughness but often reduces strength, while control of the development of the larger, elongated grain structure, e.g. by seeding, results in better toughness and strength.
Quantitative correlation of such σ–K maxima with grain sizes in Si3N4 is complicated by the fact that high toughnesses typically occur in bodies with mixtures of larger, substantially elongated grains (often with some excess oxide additive phase) in a finer, and often less elongated, grain matrix. However, while specific quantitative characterizations of such grain structures are at best difficult and uncertain, they have been qualitatively characterized by investigators, as is shown in Table 3.3, which shows strengths reaching maxima at intermediate G values, often sooner than the maxima for K. This data further shows strengths typically reaching a maximum versus toughness, as well as a similar maximum of Weibull moduli (m). Limited data also indicates a similar but more limited trend for Al2O3, quite possibly associated with the limited grain elongation [308]. However, again note that this occurrs at relatively modest G values. Similarly some strength benefits of increased toughnesses in some finer G SiC and TiB2
Grain Dependence of Ceramic Tensile Strengths at 22°C |
219 |
FIG. 3.39 Flexure strength versus toughness of various Si3N4 bodies [100, 239, 242, 293, 297, 298, 305–307]. Note that such curves are similar to those shown for PSZ materials (Fig. 3.38)
bodies may be occurring, but much more research is needed. One component of this should be evaluation of the fracture mode, since, as shown in Chapter 2, Section III.E, transgranular fracture typically substantially reduces or eliminates crack branching and bridging effects. Again these observations must be made over a range of properties, grain sizes, and crack sizes to assess adequately such effects as were discused above.
The complexity of sorting out the processing-microstructural issues are illustrated by the work of Zhang et al. [309] on α-sialons with varying amounts of 3Dy2O3·5Al2O5 (Dy garnet, DG) addition using either hot pressing or HIPing. Hot pressing resulted in strength decreasing modestly from 600 to 550 MPa as the DG content increased from 0 to 5 w/o, while IF toughness showed a similar decrease from 5.4 to 5.1 MPa·m1/2. Such decreases were accompanied by some