

Ceramic Technology and Processing, King
.pdfCeramic Property Measurements 383
One good technique is to use a mortar and pestle, with frequent scrapping down of the material on the sides. Wetting the sample with an organic solvent while grinding helps to obtain uniformity. Acetone is useful, but be sure to continue mixing until the sample is at least dried to a paste, or it can segregate.
A mandatory practice is to make a concentrate batch when mixing a small amount of one material into another. For example, when making a 0.1% standard of an element, start by making a 10% master batch. After this is thoroughly blended, dilute it to a 1.0% master batch that can in turn be used to make the final composition. It is much easier to mix two materials uniformly if they are of reasonably equal volume. A 10:1 mix is not too bad but 1000:1 is not acceptable.
Compensate for adsorption by using an internal standard. Mix in a known amount of another specific element with a spectral line close to the one being measured. One can now make a correction because the line will be adsorbed the same amount. In addition, one can use four different diffracting crystals, which can be built into the apparatus, to cover a wide band of wave lengths. This technique has its time drawbacks since spectrum scan is slow. When interested in just one element, set the diffractometer on that angle for speedy data gathering. By doing so, analyses are nearly made in real time, and the technique is useful as an in-line process control.
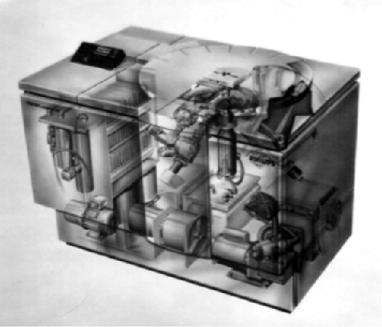
X-ray fluorescence can be used to analyze trace amounts of elements. To do this properly, set the spectrometer angle just to one side of the peak to be analyzed and take a count of the background radiation intensity. A long count provides precision. Accuracy is further improved by measuring the background at the other side of the peak and averaging. Then, set the spectrometer on the peak of the line of the element to be measured and take a count. The first time this is done, find the exact angle of the peak by running a traverse across the peak to find the top, set the angle on the top of the peak, then make a count. Now, subtract the background count from the peak count and compare with the standard for the analysis. The combination of a properly mixed internal standard, correct location of the peak maximum, and a long count of radiation intensity makes X-ray fluorescent analysis the most accurate analytical method for general use. Figure 11.3 is a drawing of a X-ray spectrometer.
384 Ceramic Technology and Processing
Figure 11.3: X-Ray Spectrometer. Can be very accurate when using standards. (Courtesy of Philips)
Ceramic Property Measurements 385
Several key components are numbered in the drawing.
#1. The X-ray tube has a ceramic body instead of glass and is configured so that the Rh target is close to the sample, resulting in increased sensitivity.
#2. An optical encoder is used to precisely measure and control the position of the goniometer.
#3. Two types of X-ray detectors can be used, and are placed close to the diffracting crystal for improved sensitivity.
#4. There are two fixed channels that help to reduce measurement time. #5. The X-ray beam is collimated with three choices for sensitivity vs.
resolution.
#6. The primary beam is filtered to increase the sharpness of the spectra. #7. The sample is surface down, allowing analysis of liquids.
#8. Multi-channel electronics
#9. Precise instrument temperature control
There is reason for the lengthy description provided above. While modern instruments are sophisticated and improved versions of older models, one must nonetheless proceed with care since the "bells and whistles" that reduce labor and analysis time do not always add to the raw data in a meaningful way. In the example, all nine features either improve the crispness of the data or aid in its presentation.
X-Ray Diffraction
X-ray diffraction produces an array of peaks resulting from lattice geometry rather than a spectra of wavelengths. This technique is used to identify the crystalline phase present in the sample. Each phase has a nearly unique diffraction pattern; when the same pattern appears for more than one phase, chemical analysis can aid in sorting. Diffraction is widely used for crystal structure analysis, but is not commonly used in the ceramic laboratory.
X-ray analyses are used for phase identification, particle or grain size analyses, presence of glass, colloidal particle size, and stress analysis.
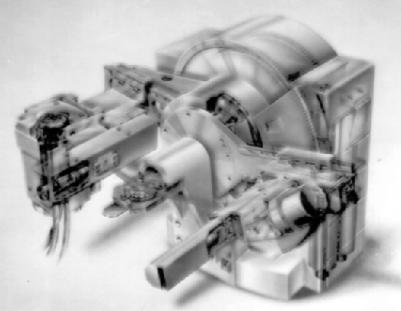
Powders are analyzed for the phases present by a diffractometer. The apparatus is shown in Figure 11.4.
386 Ceramic Technology and Processing
Figure 11.4: X-Ray Diffraction Apparatus. Used for phase analysis. (Courtesy of Philips)

Ceramic Property Measurements 387
X-rays from a source pass through a monochrometer, collimated, and impinge upon the sample being analyzed. The sample is usually powderpacked in a rectangular holder, but can also exist as a film on a glass slide or a solid ceramic planer surface. Interplaner spacings in the crystal lattice diffract the beam at different angles, producing a spectrum. A sketch of the geometry is presented in Figure 11.5.
Figure 11.5: Sketch, X-Ray Diffraction Geometry. Both the detector and sample rotate during the measurement.
The angles in the instrument shown in Figure 11.4 are measured with a shaft-encoder-controlled goniometer that contains a radiation detector to measure ray intensity. Slit widths are computer-controlled. The amount of a phase present is proportional to the intensity of the diffraction line. One must assume that the particles in the sample are randomly oriented: a poor assumption for elongated or planer particles. In such cases, the phase can still be identified, but the amount can only be estimated. It is difficult to prevent particle orientation when the geometry is unfavorable. One solution
388 Ceramic Technology and Processing
is to dust the powder onto a sticky-tape surface to which the particles adhere: an improved yet imperfect solution.
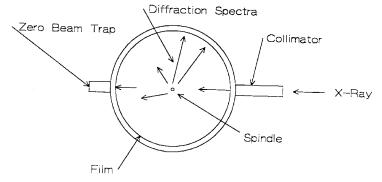
Debye-Scherrer. This older method employs a photographic technique. The sample is a thin rod of powder in a glass capillary or rolled into a spindle with glue. The photographic film surrounds the sample in a coaxial cylindrical configuration. Diffraction by the lattice produces a set of lines on the film that can be measured at each diffraction angle. It is advantageous that a single particle can be used with this technique, following the motto that "If it is big enough to see, it is big enough to X-ray." This is a useful micro technique. Figure 11.6 is a sketch of the geometry.
Figure 11.6: Debye-Sherrer Geometry. Photographic technique useful for small samples.
The speck is glued with a cellulose acetate cement (Duco) to the end of a glass fiber or glue spindle. A glue spindle is rolled between two glass slides just when it has dried enough to retain plasticity without being fluid. The spindle must be amorphous so that it does not diffract its own pattern.
Ceramic Property Measurements 389
Glasses. Since glasses are amorphous, they do not produce a diffraction pattern. However, they do produce a broad hump in the spectrum at the lower part of the diffraction pattern. The amount of glass can be estimated from the size of the hump using standards.
Particle Size. With small particles, measurements of line broadening can be used to estimate size. While electron microscopy is a preferred technique, there may be instances where X-ray diffraction is also useful. However, this method does not provide information on size distribution.
Stresses. When the material is under stress, the crystal lattice distorts, displacing the position of the diffraction lines. The amount of displacement relates to the stress. Internal stresses arise from a number of causes: thermal expansion anisotropy within a grain, expansion coefficients between different materials, compositional gradients, and mechanical work such as grinding the surface of a ceramic article. Residual stresses can be as high as 30,000 psi in ground surfaces.
Check List, Spectrographic Analyses
•Proper Standards
•Arc Emission
Many elements Grinding contamination Small sample
One significant figure at best
•ICP
Many elements can be analyzed Have to dissolve sample
Flux purity
• X-ray Fluorescent Analysis Powders, liquids, or flat plate Mixing standards
390 Ceramic Technology and Processing
Internal standards
Precise peak count procedure Modern instrument design
• X-ray Diffraction Phase analysis
Powders or flat plate Small sample possible Grain size
Glass Stresses
Modern instrument design
Wet Chemical Analysis
The wet chemical analytical methods are the underpinning of analytical procedures. They are still very useful when the analyst knows what he/she is doing. Procedures are often described in great detail because much can go wrong. Material manipulation always hazards loss or inadvertent addition of other material, such as a co-precipitation in a gravimetric analysis. With any analytical procedure, it is wise to submit blind samples that have been previously analyzed to see if they can be replicated. One can then calculate an error variance. A sharp analytical lab will track their accuracy this way so as to discuss how the methods can be improved. While ideal, checks on accuracy are often construed as professional insult. In this case, the lab is mismanaged and one should find a better source for data if possible.
Another key feature of a keen lab is the involvement in round robins with other labs through which identical samples are analyzed and results shared. Analytical chemistry is part art, part technology, part craft, and has earned much respect.
Wet chemical analyses encompass a variety of methods, including gravimetric, colorimetric, volumetric, and titration. The analytical lab usualy decides which method to use unless the type of sample is beyond their realm of experience.
Ceramic Property Measurements 391
Check list, Wet Chemical
•Material has to be dissolved.
•Submit blind samples.
•Keep a running audit on accuracy.
•Have the lab participate in round robins.
•Chemist will select the best method.
Surface Area
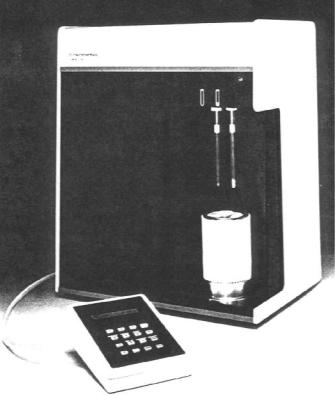
The BET method of measuring surface area is pervasive. With this method, the sample is baked out in a vacuum to remove absorbed gases such as water vapor. The surfaces are then saturated with a monolayer of N2. The amount of nitrogen needed to accomplish this is a measure of the surface area. The longest part of the analysis is the bakeout procedure. Equipment is available with ganged bakeout stations to facilitate this. When the surface area is very low, krypton is used instead of nitrogen. Having a higher density, the sensitivity of the analysis is increased. For very fine powders (d = 0.2 μm), surface area is a more sensitive measure of powder activity than particle size. BET data is often used as a process control in these cases. Figure 11.7 is of a BET apparatus.
Check List, Surface Area
•The BET method is used.
•Nitrogen absorption is common.
•Krypton can be used for very fine materials.
•When there are a lot of samples, ganged bake out is useful.
•Surface area is a more sensitive indicator of powder activity than particle size when the size is very fine.
392 Ceramic Technology and Processing
Figure 11.7: BET Apparatus. Measures surface area. (Courtesy of Micromeritics)
Thermal Analyses
Thermal properties of ceramics and refractories are very important for many applications. Thermal analyses include: thermal gravimetric (TGA), differential thermal (DTA), differential scanning calorimetry (DSC)