

5.1.2 Light sources
Light sources for electro-optical image analysis must meet a number of energy, spectral, structural and other technical requirements.
The first of them in the most general form can be formulated on the basis of the need to read the utmost optical densities of slides reaching 3.5 - 4.0 units in the darkest areas. Therefore, the power of illuminant should be such that 0.001 or 0.0001 part of its radiation, passed through such areas, could create a signal significantly exceeding the own noise of PET - its so-called “dark current”.
In general, the emission spectrum of the light source should cover the entire visible range. Despite some attempts [5.1], the use for this purpose of sources characterized by relatively high energy parameters, but a discrete, line wise spectrum of radiation (such as lasers) is limited. The absence of certain colors in the spectrum can make the scanner "blind" to a number of dyes used in the original.
In analyzing devices with electromechanical scanning on either coordinate there are used, as a rule, local (spot) lightening for the area a bit greater of a scan spot. In devices, partially or entirely using instead of mechanical movements the electronic scan, the light sources of the other design are used. So, in "flatbed" scanners it is glow lamp in form of a tube, evenly illuminating the whole line of an original and moved across it by electromechanical drive.
For entirely electronic scanning, for example, when entering originals by TV or digital cameras, full-format illuminators are applied, similar to those used for cinema, slides projection and conventional photography. Particular attention is here paid to the uniform lighting of a pick-up field. The larger an imaged object format, the more difficult is to meet this requirement.
Radiation sources of recording devices must not only have high power to achieve high performance. They are selected taking into account the correspondence of power spectral distribution to the sensitivity spectrum of the materials on which the final or intermediate image is formed.
External optical modulators and mirror galvanometers are used to control the energy flow emitted by, for example, lasers. The LEDs radiation is directly controlled by the signal to them supplied.
5.1.3 Photoelectric transducers
Among other requirements for the PET, the most important are:
integral and spectral sensitivity;
own noise level;
range of sensitivity;
temporal and temperature stability;
power consumption;
size.
Photoresistors, photodiodes, phototransistors and other sensors using the internal photoelectric effect are the most widely used for photoelectric conversion in image capturing. Small size and low power consumption organically fit them into the element base of modern microelectronics. At the same time, these devices change their photocurrent in the range of illumination, differing only in a few hundred times.1 Such limited sensitivity range excludes the use of original slides with the density greater than 2.5 – 3 units.
Schematically, dependence of the photocurrent (microamperes) on PET illumination (Lumens) indicating the presence of intrinsic noise as a random dark (at absence of the light) current signal is given in figure 5.3.
The greatest range of light characteristics at a low level of such noise and relatively high integrated sensitivity has the photo multiplier tube (PMT). It uses the external photoelectric effect and photo current amplification due to multiple secondary electron emission on a sequence of auxiliary electrodes - dynodes.
|
Figure 5.3 Sensitivity characteristics of the photoelectric transducer (PET) Wide application found the scanning PETs - line and matrix arrays of photodiodes and light-sensitive charge coupled devices (CCD) [5.2]. The advantage of the latter over other PETs is the possibility of sequential switching of elements signals in the video path by transferring their values from one element to another in the absence of an external output bus for each of them. Therefore, in addition to the photoelectric conversion, such PETs provide element-by-element image scanning in one or both directions. This eliminates the need for mechanical movements of the original and the scan head relative to each other. Accordingly, the reliability of the device growth and its cost is lowered. The "electronic" or "digital" camera, using instead of film the CCD matrix, radically changes the image input into the printing system. The digital version of the illustrated object is obtained here, bypassing the loss of information inherent in the intermediate photographic stage and subsequent scanning of the illustrative original such as a slide. Limitations to their use are partly due to the dimension (resolution) of the CCD matrices used. There are also problems discussed further in section 13 of adequate interpretation of the meaning of the color values obtained by such cameras.
5.2 Image capturing devices The difference in cost and, accordingly, in the efficiency of image input systems is several orders of magnitude. They differ in:
Choosing scanning equipment, it’s used to take into account, first of all, the nature of the publication, its volume and periodicity. As an example, it can be considered two cases, one of which uses only black and white opaque originals, and the other - and color slides. The main illustrative material of monochrome newspapers for a long time were black and white photos received from correspondents, advertising and news agencies by mail, fax or other available means. The scale of these images in the page amounted to an average of 70-90%. Reproduction without magnification strongly reduces the resolution requirements of the input. In addition, the density range of such originals, as a rule, does not exceed 2.0 units. This means that the inexpensive and reliable flatbed scanner with a resolution of about 300 dpi (12 lines/mm) and a line of CCD as a PET could be used for input. The originals for the color illustrated weekly until recently were, for the most part, slides whose density range reaches, as already mentioned, 3~4 units, and the picture size can be on a page ten times larger. Other originals, such as opaque hand-drawn, photographic and paintings, which usually have a much larger original format than slides, were not excluded. In addition, the total amount of illustrations to be processed may require a high performance input. Despite the high cost, the device with mounting and scanning of originals on a transparent cylinder, with a scan lines density of 5000 dpi (200 lines/mm) and PMT as a PET better responded to this type of edition.
5.2.1 Electrooptical analysis Device for scanning the original 2 attached to the cylinder 1 with the scan head mounted on the carriage 3 is schematically presented in figure 5.4. Carriage 3 can be moved along the cylinder 1 by means of the lead screw 4 on high-precision guides (not shown) The reading head includes the light sources 5, condensers 6, lens 7, aperture diaphragm 8 and PET 9. Condensers 6 are installed in such a way as to provide maximum illumination at the original 2 scan spot 10, the image of which the lens 7 builds in the plane of the aperture diaphragm 8. Fast, or, using the TV term, line scan is provided by the cylinder 1rotation. Slow, or frame, scan is due to the movement of the head and its reading spot along the cylinder.
Figure 5.4 On-drum scanner
The light of sources 5, reflected by the original 2, creates in the electrical load R of the PET 9 the voltage uC of the signal proportional to the reflection averaged over the projection area of the aperture 8 to the original 2. The sensitive layer of PET 9 in such cases works as if on an integral light flood. Therefore, the size of this aperture is the element of image dividing into spatial samples during scanning. When illuminating the scan spot of an opaque original on one side only (Figure 5.5) the amount of energy supplied to the PET depends, among other things, also on the reflection angle, the variability of which is caused by surface micro roughness. If the spot is illuminated from different sides by many sources, these fluctuations are averaged. Therefore, as illuminators 5 in modern devices, the outputs of several glass fibers supplying light energy to the scan spot from different directions are used.
|
|
Figure 5.5 Changing the reflection angle of the unidirectional lighting, the relief of the original surface causes undesirable fluctuations in the image signal The density of the scan lines at a fixed speed of cylinder rotation is changed by controlling the speed of the scan head movement and accordingly selecting the diaphragm size. 5.2.2 Scan spot size, sampling frequency, image file volume Size d of the sampling area and scan line pitch are defined according to the print screen ruling L and scale M of reproduction as
The sampling rate is respectively
The numeric factor in these expressions is referred to as the screening factor or sampling factor. It takes into account the sampling theory position, according to which the frequency of the carrier oscillation must be at least twice the original message frequency to be reproduced. For example, to print an illustration with at 150 Lpi (60 lines/cm) and thrice magnification, the scan frequency, following this rule, is f = 2 x 6 x 3 = 36 lines/mm, and the scan spot d = 1/(2LM) = 1/f = 30 µm. Taking into account these ratios, such an important technology parameter as the volume of the image file prepared for printing and to be processed in the RIP for the output of halftone transparencies or plates, digital proofs or prints can be calculated further: Nf = m sprn f2 (bytes) 5.3
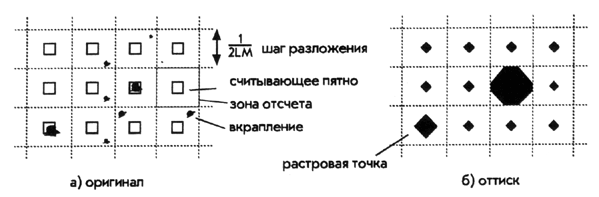
where m is the number of color separations and sprn is the print area. For example, a numeric array for a four-color A3 print (30 x 40 cm2) with a ruling of 150 Lpi (60 lines/cm) will be N = 4 (30 x 40) 602 = 17.28 MBytes. The scale of the original can vary in printing from 20% to 3000% in increments of 1%, and the screen frequency - from 50 to 200 Lpi. It can be supposed that the same for all modes, the density of the scan lines and the scan spot selected for the maximum values of the scale and the screen ruling can satisfy said condition. However, this does not make sense not only because of the unjustified redundancy of the image file volume. When the value of the scan spot is much smaller than that provided by the equation 5.1, high-frequency noise may appear in the signal, and then on the copy. It can be caused by the micro roughness of the substrate, emulsion graininess or contaminations on the original. Figure 5.6 (a) shows the image sampling areas, which size corresponds to condition 5.1, and the much smaller scan spot within them on the background light area with some dark inclusions ignored at viewing the original. As far as the resulting signal has to refer to the average reflection of a sampling area, it may happen for the signal to get meaning of “dark” or even “black” if the scan spot coincides with such inclusion. Corresponding halftone dot will occupy on a copy almost the whole screen mesh thus greatly amplifying the noise of the original as indicated in figure 5.6 (b). |
|
Figure 5.6 Aperture, much smaller of reference area, reduces the sample representativeness: the coincidence of a scan spot with random increment (a) results in the darkening almost the whole screen mesh on a halftone copy (b) |


In image capturing with the CCD arrays or matrixes, the proper size of a sample is set by defining the amount of adjacent ones which signals to be averaged or interpolated.
In some cases, the sampling area is deliberately taken even greater than theoretical to avoid false patterns (object moiré) or to suppress the texture of the original substrate. Such noises are eliminated in this case by low-frequency filtering - averaging the brightness over the certain scanned area. This action is similar to defocusing the lens when taking a photo.