

5.2.3 Scanning by the ccd array
Figure 5.7 schematically explains the structure of a "flatbed" scanner - a device for electro-optical analysis of the opaque original 1 with a CCD line array 2 containing several thousand sensors. The original 1 is pressed by the cover 3 to the glass base 4 and illuminated by a glow gas tube 5, moved together with mirrors 6 in the direction 7. The utmost positions of this move are detected by auxiliary photo sensors 8. In one of these positions, the CCD 2 reads the calibration mark 9 - a uniform white matte strip extended over the entire CCD projection in the glass 4plane. This signal is recorded in memory and subtracted from the video signal when scanning the original to compensate for errors due to the sensitivity spread of CCD elements and illumination non uniformity along the scan line.
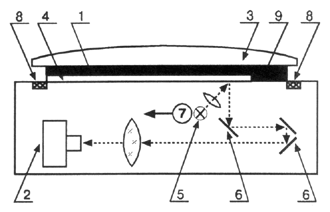
Figure 5.7 Scheme of the flatbed scanner with a discrete linear photoelectric transducer
The simplest devices of this type initially had only one optical channel and one PET. Color-separated signals were formed in them consistently by three times scanning of the original with the color filters replacement.
Flatbed scanners, working with slides, are equipped with an additional movable light source mounted in the reclining top 3. Particular attention is paid to the tight contact of the slide emulsion side with the glass base, since multiple internal reflections in the air gap can cause distortion in the form of Fresnel rings. To eliminate these phenomena, the contact zone is filled, for example, with transparent gels.
Aperture diaphragms are not used in such scanners, since the sampling area and frequency are rigidly tied to the CCD geometric parameters. Therefore, in devices that use discrete sensors, it is more difficult to smoothly change the scanning frequency, non-fold the number of their elements, taking into account the scale of reproduction and screen ruling according to equation 5.2. The sampled values are brought here in accordance with the value of the "virtual" aperture (calculated reference zone) by, as already mentioned, interpolating the values of surrounding samples. This is done either by "hardware" circuitry in real-time of scanning, or by subsequent recalculation of the obtained values.
5.2.4 Four channel scanner
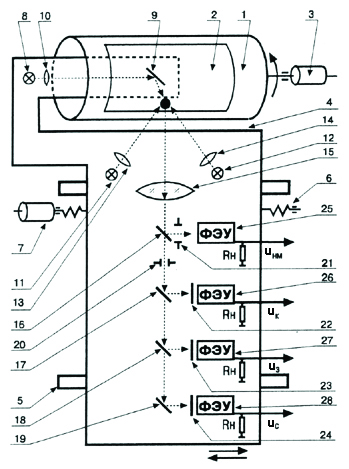
Electro-optical analysis module schematically presented in figure 5.8, contains transparent, rotated by motor 3 cylinder 1 with fixed on its surface transparent or opaque original 2. On the carriage 4, which has the ability to move along the cylinder 1 on the guides 5 with the help of the lead screw 6 and the motor 7, a reading head is installed. It contains:
- light source 8, mirror 9 and a condenser 10 for illuminating slides;
- light sources 11, 12 and condensers 13, 14 for originals read in reflected light;
- lens 15;
- translucent 16, dichroic 17,18 and turning 19 mirrors;
- aperture diaphragms 20 of the main and 21 - of unsharp masking optical channels;
- color separating filters 22, 23 and 24;
- photoelectron multipliers 25 - 28.
As can be seen from the scheme, elements 8-9 are located inside the bracket, which moves inside the cylinder. The latter in a number of scanners is mounted vertically on a rotating base.
In the scanning, provided by the cylinder 1rotation and the carriage 4 move, the light reflected or passed through the illuminated portion of the original 2, is divided into two unequal parts by the splitting mirror 16.
Lens 15 builds in the planes of aperture diaphragms 20 and 21 the image of the illuminated area of an original. The first of them has the above-discussed estimated size, and the second is 2-3 times larger. In the auxiliary optical channel of unsharp masking (USM), the electric current of the load resistor R of PET 25 creates a voltage proportional to the reflection or transmission of the original 2 averaged over the projection area of the larger diaphragm 21. This signal corresponds to a somewhat defocused image and is therefore called the USM signal. Its use is discussed in chapter seven.
|
|
 Figure
5.8 Four-channel color separating device with mounting of slides
and reflection originals on a transparent drum
Figure
5.8 Four-channel color separating device with mounting of slides
and reflection originals on a transparent drum
In the PMT 26, 27 and 28 loads of the main optical channels, color-separated (RGB) signals are formed. Their amplitude depends on the intensity of the light flux averaged over the aperture diaphragm 20 and the integral reflection (transmission) of the original, respectively, in the red, green and blue regions of the visible spectrum.
The optical density of the semitransparent mirrors 16.17 and 18 is selected from the condition of approximate equality of the signal amplitudes from the neutral gray field at the outputs of all four PMT, taking into account the diaphragms 20 and 21 sizes.
Single-channel systems using only one PET are the most stable in terms of their output signal balance. They generate RGB signals sequentially by elements or by lines. To filter the light coming from the original in time sequence, they use the effect of changing the crystal transmission spectrum under the influence of the applied electric field [5.3]. Such single-channel system had, in particular, Linoscan 3040 [5.4].