

KAPLAN_USMLE_STEP_1_LECTURE_NOTES_2018_BIOCHEMISTRY_and_GENETICS
.pdf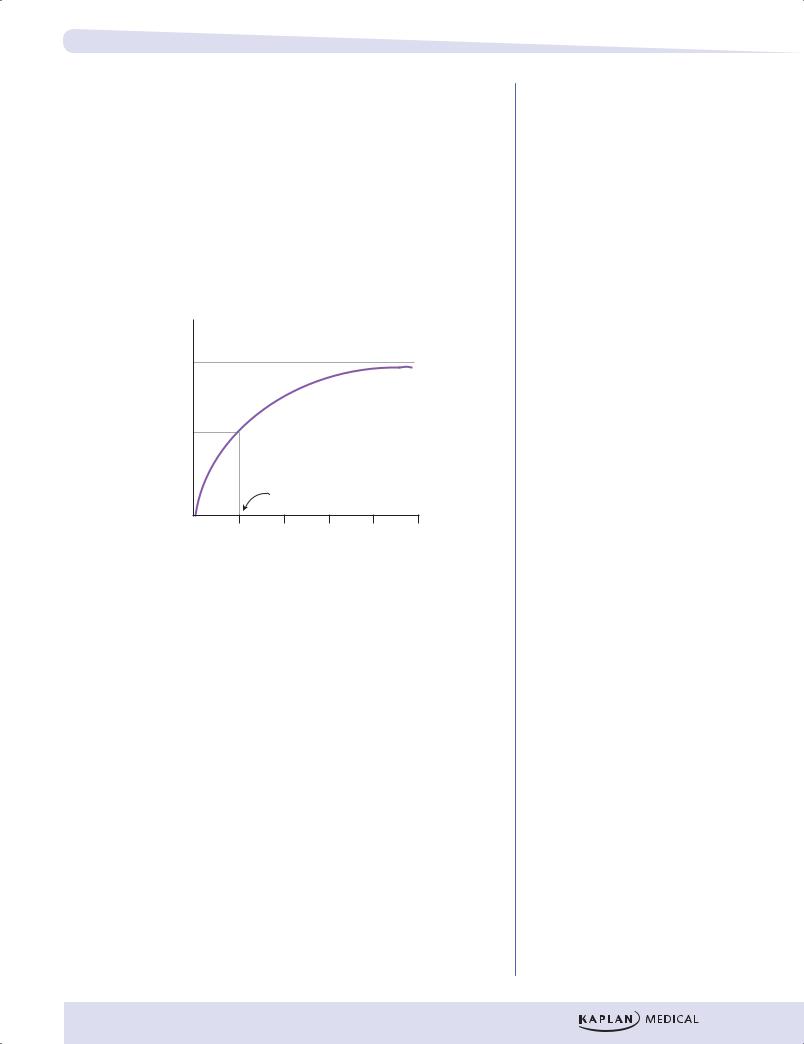


Chapter 8 ● Amino Acids, Proteins, and Enzymes
Review Questions
Select the ONE best answer.
1.The peptide ala-arg-his-gly-glu is treated with peptidases to release all of the amino acids. The solution is adjusted to pH 7, and electrophoresis is performed. In the electrophoretogram depicted below, the amino acid indicated by the arrow is most likely to be
–
+
A.glycine
B.arginine
C.glutamate
D.histidine
E.alanine
2.The reaction catalyzed by hepatic phosphofructokinase-1 has a ∆G0 value of –3.5 kcal/mol. This value indicates that under standard conditions this reaction
A.is reversible
B.occurs very slowly
C.produces an activator of pyruvate kinase
D.is inhibited by ATP
E.has a low energy of activation
F.will decrease in activity as the pH decreases
G.cannot be used for gluconeogenesis
H.shows cooperative substrate binding
I.is indirectly inhibited by glucagon
J.is stimulated by fructose 2,6-bisphosphate
129


Chapter 8 ● Amino Acids, Proteins, and Enzymes
5.Several complexes in the mitochondrial electron transport chain contain non-heme iron. The iron in these complexes is bound tightly to the thiol group of which amino acid?
A.Glutamine
B.Methionine
C.Cysteine
D.Tyrosine
E.Serine
Items 6–8
Consider a reaction that can be catalyzed by one of two enzymes, A and B, with the following kinetics.
|
Km (M) |
Vmax (mmol/min) |
A. |
5 × 10⁻⁶ |
20 |
B. |
5 × 10⁻⁴ |
30 |
6.At a concentration of 5 × 10⁻⁶ M substrate, the velocity of the reaction catalyzed by enzyme A will be
A.10
B.15
C.20
D.25
E.30
7.At a concentration of 5 × 10⁻⁴ M substrate, the velocity of the reaction catalyzed by enzyme B will be
A.10
B.15
C.20
D.25
E.30
8.At a concentration of 5 × 10⁻⁴ M substrate, the velocity of the reaction catalyzed by enzyme A will be
A.10
B.15
C.20
D.25
E.30
131

Part I ● Biochemistry
9.A worldwide pandemic of influenza caused by human-adapted strains of avian influenza or bird flu is a serious health concern. One drug for treatment of influenza, Tamiflu (oseltamivir), is an inhibitor of the influenza viral neuraminidase required for release of the mature virus particle from the cell surface. Recent reports have raised concerns regarding viral resistance of Tamiflu compelling the search for alternative inhibitors. Another drug, Relenza (zanamavir), is already FDA approved for use in a prophylactic nasal spray form. The graph below show kinetic data obtained for viral neuraminidase activity (measured as the release of sialic acid from a model substrate) as a function of substrate concentration in the presence and absence of Relenza and Tamiflu.
+ Relenza
4
+ Tamiflu
1/V 3
( moles/min)
No inhibitor
2
1
0 |
10 |
20 |
30 |
40 |
1/[S] ( M)
Based on the kinetic data, which of the following statements is correct?
A.Both drugs are competitive inhibitors of the viral neuraminidase.
B.Both drugs are noncompetitive inhibitors of the viral neuraminidase.
C.Tamiflu increases the Km value for the substrate compared to Relenza
D.Relenza increases the Vmax value for the substrate compared to Tamiflu.
E.Relenza is not an inhibitor of neuraminidase, but inhibits another viral enzyme.
132

Chapter 8 ● Amino Acids, Proteins, and Enzymes
Answers
1.Answer: B. Arginine is the most basic of the amino acids (pI~11) and would have the largest positive charge at pH 7.
2.Answer: G. The negative ∆G0 value indicates the reaction is thermodynamically favorable (irreversible), requiring a different bypass reaction for conversion of F1, 6BP to F6P in the gluconeogenic pathway.
3.Answer: E. Because the apparent Vmax is near 100 mmol/sec, Vmax/2 equals 50 mmol/sec. The substrate concentration giving this rate is 0.50 mM.
4.Answer: B. Sigmoidal control curve with ATP inhibiting and shifting curve to the right is needed.
5.Answer: C. Cysteine has a sulfhydryl group in its side chain. Although methionine has a sulfur in its side chain, a methyl group is attached to it.
6.Answer: A. At the concentration of 5 × 10⁻⁶ M, enzyme A is working at
one-half of its Vmax because the concentration is equal to the Km for the substrate. Therefore, one-half of 20 mmol/min is 10 mmol/min.
7.Answer: B. At the concentration of 5 × 10⁻⁴ M, enzyme B is working at
one-half of its Vmax because the concentration is equal to the Km for the substrate. Therefore, one-half of 30 mmol/min is 15 mmol/min.
8.Answer: C. At the concentration of 5 × 10⁻⁴ M, 100 × the substrate concentration at Km, enzyme A is working at its Vmax, which is 20 mmol/min.
9.Answer: B. Based on the graph, when the substrate is present, Tamiflu
results in the same Vmax and higher Km compared to the line when no inhibitor added. These are hallmarks of competitive inhibitors of enzymes, which Tamiflu is. Noncompetitive inhibitors result in decreased
Vmax and the same Km with no inhibitor added, which is shown by the Relenza line in the graph.
133