

Оригинал
.pdfPART ONE – BASIC PRINCIPLES AND PATTERNS
CHAPTER 1 – Introductory Principles
The electrocardiogram (ECG or EKG) is a graph that records the electrical activity of the heart.
The ECG records these cardiac electrical currents (voltages, potentials) by means of metal electrodes placed on the surface of the body. These metal electrodes are placed on the arms, legs, and chest wall (precordium).
BASIC CARDIAC ELECTROPHYSIOLOGY
Before the basic ECG patterns are discussed, some elementary aspects of cardiac electrophysiology must be reviewed. Fortunately, only certain simple principles are required for clinical interpretation of ECGs.
The function of the heart is to contract rhythmically and pump blood to the lungs for oxygenation and then to pump this oxygenated blood into the general (systemic) circulation. The signal for cardiac contraction is the spread of electrical currents through the heart muscle. These currents are produced both by pacemaker cells and specialized conducting tissue within the heart and by the working heart muscle itself.
The ECG records only the currents produced by the working heart muscle. ELECTRICAL STIMULATION OF THE HEART
In simplest terms, the heart can be thought of as an electrically timed pump. The electrical “wiring” of the heart is outlined in Figure 1-1. Normally, the signal for cardiac electrical stimulation starts in the sinus node, also called the sinoatrial (SA) node. This node is located in the right atrium near the opening of the superior vena cava. It is a small collection of specialized cells capable of automatically generating an electrical stimulus (signal). From the sinus node, this stimulus spreads first through the right atrium and then into the left atrium. Thus the sinus node functions as the normal pacemaker of the heart.
1

FIGURE 1-1 Normally, the cardiac stimulus is generated in the sinoatrial (SA) node, which is located in the right atrium (RA). The stimulus then spreads through the RA and left atrium (LA). Next, it spreads through the atrioventricular (AV) node and the bundle of His, which comprise the AV junction. The stimulus then passes into the left and right ventricles (LV and RV) by way of the left and right bundle branches, which are continuations of the bundle of His. Finally, the cardiac stimulus spreads to the ventricular muscle cells through the Purkinje fibers.
The first phase of cardiac muscle activation is electrical stimulation of the right and left atria. This in turn signals the atria to contract and pump blood simultaneously through the tricuspid and mitral valves into the right and left ventricles. The electrical stimulus then spreads to specialized conduction tissues in the atrioventricular (AV) junction, which includes the AV node and bundle of His, and then into the left and right bundle branches, which transmit the stimulus to the ventricular muscle cells.
The AV junction, which acts as a sort of electrical “bridge” connecting the atria and ventricles, is located at the base of the interatrial septum and extends into the interventricular septum (see Fig. 1-1). The upper (proximal) part of the AV junction is the AV node. (In some texts, the terms AV node and AV junction are used synonymously.) The lower (distal) part of the AV junction is called the bundle of His after the physiologist who described it. The bundle of His then divides into two main branches: the right bundle branch, which distributes the stimulus to the right
2
ventricle, and the left bundle branch, which distributes the stimulus to the left ventricle (see Fig. 1-1).
The electrical stimulus spreads simultaneously down the left and right bundle branches into the ventricular myocardium (ventricular muscle) by way of specialized conducting cells called Purkinje fibers. These fibers are located in the ventricular myocardium.
Under normal circumstances, when the sinus node is pacing the heart (normal sinus rhythm), the AV junction appears to serve primarily as a shuttle, directing the electrical stimulus into the ventricles. Under some circumstances, however, the AV junction can also act as an independent pacemaker of the heart. For example, if the sinus node fails to function properly, the AV junction can act as an escape pacemaker. In such cases, an AV junctional rhythm (and not sinus rhythm) is present. This produces a distinct ECG pattern (see Chapter 14).
Just as the spread of electrical stimuli through the atria leads to atrial contraction, so the spread of stimuli through the ventricles leads to ventricular contraction, with pumping of blood to the lungs and into the general circulation.
CARDIAC CONDUCTIVITY AND AUTOMATICITY
The speed with which electrical impulses are conducted through different parts of the heart varies. For example, conduction is slowest through the AV node and fastest through the Purkinje fibers. The relatively slow conduction speed through the AV node is of functional importance because it allows the ventricles time to fill with blood before the signal for cardiac contraction arrives.
In addition to conductivity, a major electrical feature of the heart is automaticity.
Automaticity refers to the capacity of certain cardiac cells to function as pacemakers by spontaneously generating electrical impulses that spread throughout the heart. As mentioned earlier, the sinus node normally is the primary pacemaker of the heart because of its inherent automaticity. Under special conditions, however, other cells outside the sinus node (in the atria, AV junction, or ventricles) can also act as independent pacemakers. For example, if the automaticity of the sinus node is depressed, the AV junction can act as a backup (escape) pacemaker.
3
The term sick sinus syndrome is used clinically to describe patients who have severe depression of sinus node function (see Chapter 20). These patients may experience light-headedness or even syncope (fainting) because of excessive bradycardia (slow heartbeat). (Sick sinus syndrome and other causes of bradycardia are discussed in Part 2 in the section on cardiac arrhythmias.)
In other conditions, the automaticity of pacemakers outside the sinus node may be abnormally increased, and these ectopic (non-sinus) pacemakers may compete with the sinus node for control of the heartbeat. A rapid run of ectopic beats results in an abnormal tachycardia. (Ectopy is also discussed in detail in Part 2.)
If you understand the normal physiologic stimulation of the heart, you have the basis for understanding the abnormalities of heart rhythm and conduction that produce distinctive ECG patterns. For example, failure of the sinus node to stimulate the heart properly can result in various rhythm disturbances associated with sick sinus syndrome. Blockage of the spread of stimuli through the AV junction can produce various degrees of AV heart block (see Chapter 17). Disease of the bundle branches can produce left or right bundle branch block (see Chapter 7). Finally, any disease process that involves the ventricular muscle itself (e.g., injury of the heart muscle by myocardial infarction) can produce marked changes in the normal ECG patterns.
CHAPTER 2 – Basic ECG Waves
DEPOLARIZATION AND REPOLARIZATION
In Chapter 1, the general term electrical stimulation was applied to the spread of electrical stimuli through the atria and ventricles. The technical term for this cardiac electrical stimulation or activation is depolarization. The return of heart muscle cells to their resting state after stimulation (depolarization) is called repolarization. These terms are derived from the fact that normal “resting” myocardial cells (atrial and ventricular cells) are polarized; that is, they carry electrical charges on their surface. Figure 2-1A shows the resting polarized state of a normal atrial or ventricular heart muscle cell. Notice that the outside of the resting cell is positive and the inside is negative (about −90 mV [millivolts]).
4
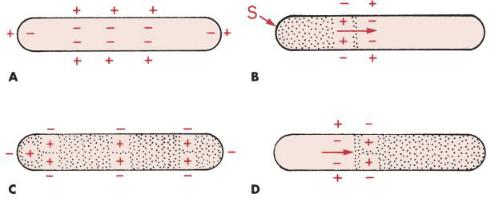
FIGURE 2-1 Depolarization and repolarization. A, The resting heart muscle cell is polarized; that is, it carries an electrical charge, with the outside of the cell positively charged and the inside negatively charged. B, When the cell is stimulated (S), it begins to depolarize (stippled area). C, The fully depolarized cell is positively charged on the inside and negatively charged on the outside. D, Repolarization occurs when the stimulated cell returns to the resting state. The direction of depolarization and repolarization is represented by arrows. Depolarization (stimulation) of the atria produces the P wave on the ECG, whereas depolarization of the ventricles produces the QRS complex. Repolarization of the ventricles produces the ST-T complex.
When a heart muscle cell is stimulated, it depolarizes. As a result, the outside of the cell, in the area where the stimulation has occurred, becomes negative and the inside of the cell becomes positive. This produces a difference in electrical voltage on the outside surface of the cell between the stimulated depolarized area and the unstimulated polarized area (Fig. 2-1B). Consequently, a small electrical current forms and spreads along the length of the cell as stimulation and depolarization occur, until the entire cell is depolarized (Fig. 2-1C). The path of depolarization can be represented by an arrow, as shown in Figure 2-1B. For individual myocardial cells (fibers), depolarization and repolarization proceed in the same direction. For the entire myocardium, however, depolarization proceeds from the innermost layer (endocardium) to the outermost layer (epicardium), whereas repolarization proceeds in the opposite direction. The mechanism of this difference is not fully understood.
5
The depolarizing electrical current is recorded by the ECG as a P wave (when the atria are stimulated and depolarize) and as a QRS complex (when the ventricles are stimulated and depolarize).
After a time, the fully stimulated and depolarized cell begins to return to the resting state. This is known as repolarization. A small area on the outside of the cell becomes positive again (Fig. 2-1D), and the repolarization spreads along the length of the cell until the entire cell is once again fully repolarized. Ventricular repolarization is recorded by the ECG as the ST segment, T wave, and U wave. (Atrial repolarization is usually obscured by ventricular potentials.)
The ECG records the electrical activity of a large mass of atrial and ventricular cells, not that of just a single cell. Because cardiac depolarization and repolarization normally occur in a synchronized fashion, the ECG is able to record these electrical currents as specific waves (P wave, QRS complex, ST segment, T wave, and U wave).
In summary, regardless of whether the ECG is normal or abnormal, it records just two basic events: (1) depolarization, the spread of a stimulus through the heart muscle; and (2) repolarization, the return of the stimulated heart muscle to the resting state.
BASIC ECG WAVEFORMS: P, QRS, ST, T, AND U WAVES
The spread of stimuli through the atria and ventricles followed by the return of stimulated atrial and ventricular muscle to the resting state produces the electrical currents recorded on the ECG. Furthermore, each phase of cardiac electrical activity produces a specific wave or complex (Fig. 2-2). The basic ECG waves are labeled alphabetically and begin with the P wave:
P wave—atrial depolarization (stimulation)
QRS complex—ventricular depolarization (stimulation)
ST segment, T wave, and U wave—ventricular repolarization (recovery)
6
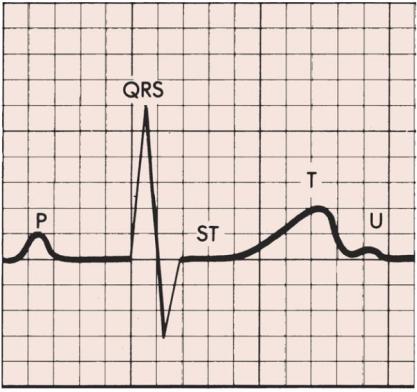
FIGURE 2-2 The P wave represents atrial depolarization. The PR interval is the time from initial stimulation of the atria to initial stimulation of the ventricles.
The QRS represents ventricular depolarization. The ST segment, T wave, and U wave are produced by ventricular repolarization.
The P wave represents the spread of a stimulus through the atria (atrial depolarization). The QRS complex represents stimulus spread through the ventricles (ventricular depolarization). The ST segment and T wave represent the return of stimulated ventricular muscle to the resting state (ventricular repolarization). The U wave is a small deflection sometimes seen just after the T wave. It represents the final phase of ventricular repolarization, although its exact mechanism is not known.
You are probably wondering why no wave or complex represents the return of stimulated atria to their resting state. The answer is that the atrial ST segment (STa) and atrial T wave (Ta) are generally not observed on the normal ECG because of their low amplitudes. (An important exception is described in Chapter 11 in the discussion of acute pericarditis, which often causes PR segment deviation.) Similarly, the routine ECG is not sensitive enough to record any electrical activity during the spread of stimuli through the atrioventricular (AV) junction (AV node and bundle of His).
7
The spread of electrical stimuli through the AV junction occurs between the beginning of the P wave and the beginning of the QRS complex. This interval, known as the PR interval, is a measure of the time it takes for a stimulus to spread through the atria and pass through the AV junction.
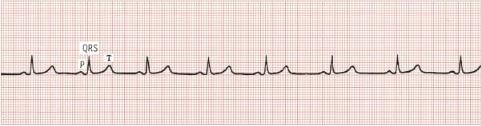
In summary, the P-QRS-T sequence represents the repetitive cycle of the electrical activity in the heart, beginning with the spread of a stimulus through the atria (P wave) and ending with the return of stimulated ventricular muscle to its resting state (ST-T sequence). As shown in Figure 2-3, this cardiac cycle repeats itself again and again.
FIGURE 2-3 The basic cardiac cycle (P-QRS-T) repeats itself again and again.
ECG PAPER
The P-QRS-T sequence is recorded on special ECG graph paper that is divided into gridlike boxes (Figs. 2-3 and 2-4). Each of the small boxes is 1 millimeter square (1 mm2). The paper usually moves at a speed of 25 mm/sec. Therefore, horizontally, each unit represents 0.04 second (25 mm/sec × 0.04 sec = 1 mm). Notice that the lines between every five boxes are heavier, so that each 5-mm unit horizontally corresponds to 0.2 second (5 × 0.04 = 0.2). The ECG can therefore be regarded as a moving graph that horizontally corresponds to time, with 0.04and 0.2-second divisions.
Vertically, the ECG graph measures the voltages, or amplitudes, of the ECG waves or deflections. The exact voltages can be measured because the electrocardiograph is standardized (calibrated) so that a 1-mV signal produces a deflection of 10-mm amplitude (1 mV = 10 mm). In most electrocardiographs, the standardization can also be set at one-half or two-times normal sensitivity.
8
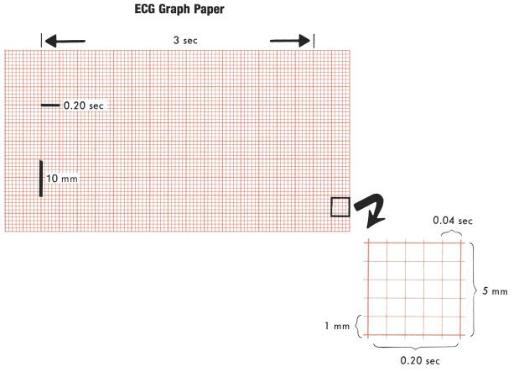
FIGURE 2-4 The ECG is usually recorded on a graph divided into millimeter squares, with darker lines marking 5-mm squares. Time is measured on the horizontal axis. With a paper speed of 25 mm/sec, each small (1-mm) box side equals 0.04 second and each larger (5-mm) box side equals 0.2 second. The amplitude of any wave is measured in millimeters on the vertical axis.
BASIC ECG MEASUREMENTS AND SOME NORMAL VALUES STANDARDIZATION (CALIBRATION) MARKER
The electrocardiograph must be properly calibrated so that a 1-mV signal produces a 10-mm deflection. The unit may have a special standardization button that produces a 1-mV wave. As shown in Figure 2-5, the standardization mark (St) produced when the machine is correctly calibrated is a square wave 10 mm tall. If the machine is not standardized correctly, the 1-mV signal produces a deflection either more or less than 10 mm and the amplitudes of the P, QRS, and T deflections are larger or smaller than they should be. The standardization deflection is also important because standardization can be varied in most electrocardiographs (see Fig. 2-5). When very large deflections are present (as occurs, for example, in some patients who have an electronic pacemaker that produces very large spikes or who have high
QRS voltage caused by hypertrophy), it may be advisable to take the ECG at one-half 9
standardization to get the entire tracing on the paper. If the ECG complexes are very small, it may be advisable to double the standardization (e.g., to study a small Q wave more thoroughly). Some electronic electrocardiographs do not display the calibration pulse. Instead, they print the paper speed and standardization at the bottom of the ECG paper (25 mm/sec, 10 mm/mV).
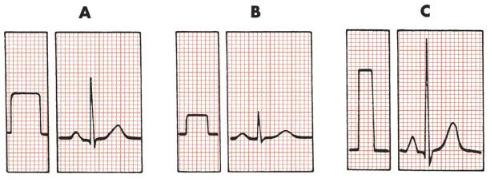
FIGURE 2-5 Before taking an ECG, the operator must check to see that the machine is properly calibrated, so that the 1-mV standardization mark is 10 mm tall. A, Electrocardiograph set at normal standardization. B, One half standardization. C, Two times normal standardization.
Because the ECG is calibrated, any part of the P, QRS, and T deflections can be described in two ways; that is, both the amplitude (voltage) and the width (duration) of deflection can be measured. Thus it is possible to measure the amplitude and width of the P wave, the amplitude and width of the QRS complex, the amplitude of the ST segment deviation (if present), and the amplitude of the T wave. For clinical purposes, if the standardization is set at 1 mV = 10 mm, the height of a wave is usually recorded in millimeters, not millivolts. In Figure 2-3, for example, the P wave is 1 mm in amplitude, the QRS complex is 8 mm, and the T wave is about 3.5 mm.
A wave or deflection is also described as positive or negative. By convention, an upward deflection or wave is called positive. A downward deflection or wave is called negative. A deflection or wave that rests on the baseline is said to be isoelectric. A deflection that is partly positive and partly negative is call biphasic. For example, in Figure 2-6, the P wave is positive, the QRS complex is biphasic (initially positive, then negative), the ST segment is isoelectric (flat on the baseline), and the T wave is negative.
10