

BP energy
.pdfMajor trade movements 2011
Trade flows worldwide (million tonnes)
23.7 |
|
298.2 |
|
29.5 |
48.6 |
|
|
133.8 |
35.5 |
|
|
|
57.6 |
126.0 |
175.1 |
||
|
||||
27.1 |
68.3 |
|
|
|
49.5 |
28.4 |
|
||
|
137.8 |
|||
59.8 |
18.4 |
|
||
|
|
|
|
95.5 |
|
61.1 |
|
|
|
|
26.0 |
|
28.4 |
22.1 |
41.1 |
111.2 |
110.7 |
|
|
|
|
|
|
|||
|
|
|
226.6 |
61.5 |
|
|
|
|
|
34.3 |
|
US |
|
|
|
15.6 |
|
Canada |
|
|
Mexico |
|
|
S. & Cent. America |
29.5 |
|
Europe & Eurasia |
||
|
||
Middle East |
42.2 |
|
Africa |
||
|
||
Asia Pacific |
27.1 |
|
|
Imports and exports 2011
|
|
|
|
Million tonnes |
|
|
|
|
|
|
Thousand barrels daily |
|
|
|
||
|
|
Crude |
Product |
Crude |
Product |
|
|
|
Crude |
Product |
Crude |
Product |
||||
|
|
imports |
imports |
exports |
exports |
|
|
|
imports |
imports |
exports |
exports |
||||
US |
445.0 |
114.8 |
1.0 |
122.1 |
8937 |
2400 |
21 |
2552 |
||||||||
Canada |
26.6 |
12.7 |
111.7 |
26.8 |
533 |
265 |
2243 |
561 |
||||||||
Mexico |
|
– |
32.7 |
67.5 |
6.2 |
|
|
|
– |
684 |
1356 |
131 |
||||
South & Cent. America |
18.7 |
62.6 |
139.0 |
46.5 |
375 |
1308 |
2791 |
972 |
||||||||
Europe |
464.2 |
132.2 |
12.9 |
86.4 |
9322 |
2764 |
259 |
1806 |
||||||||
Former Soviet Union |
|
† |
5.1 |
319.3 |
108.9 |
|
|
|
‡ |
107 |
6413 |
2276 |
||||
Middle East |
10.7 |
11.4 |
879.4 |
100.0 |
214 |
239 |
17660 |
2090 |
||||||||
North Africa |
21.0 |
20.6 |
72.3 |
22.9 |
423 |
430 |
1451 |
478 |
||||||||
West Africa |
|
† |
11.8 |
224.1 |
7.4 |
|
|
|
‡ |
246 |
4501 |
154 |
||||
East & Southern Africa |
2.4 |
11.6 |
16.6 |
0.3 |
48 |
243 |
334 |
6 |
||||||||
Australasia |
26.8 |
16.6 |
14.2 |
8.0 |
538 |
346 |
285 |
168 |
||||||||
China |
252.9 |
75.2 |
1.5 |
29.8 |
5080 |
1571 |
30 |
623 |
||||||||
India |
169.7 |
8.2 |
0.1 |
41.8 |
3407 |
171 |
1.5 |
873 |
||||||||
Japan |
177.3 |
44.5 |
|
† |
13.9 |
3560 |
930 |
0.6 |
290 |
|||||||
Singapore |
55.1 |
97.6 |
0.7 |
87.1 |
1107 |
2040 |
14 |
1822 |
||||||||
Other Asia Pacific |
224.4 |
133.2 |
34.3 |
82.6 |
4505 |
2785 |
690 |
1727 |
||||||||
Total World |
1894.7 |
790.7 |
1894.7 |
790.7 |
38050 |
16530 |
38050 |
16530 |
||||||||
†Less than 0.05.
‡Less than 0.5.
Note: Bunkers are not included as exports. Intra-area movements (for example, between countries in Europe) are excluded.
19

 Natural gas
Proved reserves
|
At end 1991 |
At end 2001 |
At end 2010 |
|
|
|
|
At end 2011 |
|
|
|
|
|
Trillion |
Trillion |
Trillion |
|
|
Trillion |
Trillion |
|
|
|
|
|
|
cubic |
cubic |
cubic |
|
|
cubic |
cubic |
Share of |
R/P |
|||
|
metres |
metres |
metres |
|
|
feet |
metres |
|
total |
ratio |
||
US |
4.7 |
5.2 |
8.2 |
299.8 |
8.5 |
4.1% |
13.0 |
|
||||
Canada |
2.7 |
1.7 |
1.8 |
70.0 |
2.0 |
1.0% |
12.4 |
|
||||
Mexico |
2.0 |
0.8 |
0.3 |
12.5 |
0.4 |
0.2% |
6.7 |
|
||||
Total North America |
9.5 |
7.7 |
10.3 |
382.3 |
10.8 |
5.2% |
12.5 |
|
||||
Argentina |
0.6 |
0.8 |
0.4 |
12.0 |
0.3 |
0.2% |
8.8 |
|
||||
Bolivia |
0.1 |
0.8 |
0.3 |
9.9 |
0.3 |
0.1% |
18.3 |
|
||||
Brazil |
0.1 |
0.2 |
0.4 |
16.0 |
0.5 |
0.2% |
27.1 |
|
||||
Colombia |
0.1 |
0.1 |
0.2 |
5.8 |
0.2 |
0.1% |
14.9 |
|
||||
Peru |
0.3 |
0.2 |
0.4 |
12.5 |
0.4 |
0.2% |
31.1 |
|
||||
Trinidad & Tobago |
0.2 |
0.6 |
0.4 |
14.2 |
0.4 |
0.2% |
9.9 |
|
||||
Venezuela |
3.6 |
4.2 |
5.5 |
195.2 |
5.5 |
2.7% |
* |
|
||||
Other S. & Cent. America |
0.2 |
0.1 |
0.1 |
2.2 |
0.1 |
|
|
23.7 |
|
|||
|
|
|
||||||||||
Total S. & Cent. America |
5.3 |
7.0 |
7.5 |
267.7 |
7.6 |
3.6% |
45.2 |
|
||||
Azerbaijan |
n/a |
1.2 |
1.3 |
44.9 |
1.3 |
0.6% |
85.8 |
|
||||
Denmark |
0.1 |
0.1 |
0.1 |
1.6 |
|
† |
|
|
6.5 |
|
||
|
|
|
|
|||||||||
Germany |
0.2 |
0.2 |
0.1 |
2.2 |
0.1 |
|
|
6.2 |
|
|||
|
|
|
||||||||||
Italy |
0.3 |
0.2 |
0.1 |
3.1 |
0.1 |
|
|
11.4 |
|
|||
|
|
|
||||||||||
Kazakhstan |
n/a |
1.8 |
1.9 |
66.4 |
1.9 |
0.9% |
97.6 |
|
||||
Netherlands |
1.8 |
1.5 |
1.1 |
38.9 |
1.1 |
0.5% |
17.2 |
|
||||
Norway |
1.3 |
2.2 |
2.0 |
73.1 |
2.1 |
1.0% |
20.4 |
|
||||
Poland |
0.2 |
0.1 |
0.1 |
4.3 |
0.1 |
0.1% |
28.3 |
|
||||
Romania |
0.5 |
0.3 |
0.6 |
3.8 |
0.1 |
0.1% |
9.9 |
|
||||
Russian Federation |
n/a |
42.4 |
44.4 |
1575.0 |
44.6 |
21.4% |
73.5 |
|
||||
Turkmenistan |
n/a |
2.6 |
13.4 |
858.8 |
24.3 |
11.7% |
* |
|
||||
Ukraine |
n/a |
1.0 |
0.9 |
33.0 |
0.9 |
0.4% |
51.3 |
|
||||
United Kingdom |
0.5 |
1.1 |
0.2 |
7.1 |
0.2 |
0.1% |
4.5 |
|
||||
Uzbekistan |
n/a |
1.7 |
1.6 |
56.6 |
1.6 |
0.8% |
28.1 |
|
||||
Other Europe & Eurasia |
50.1 |
0.5 |
0.3 |
10.0 |
0.3 |
0.1% |
29.4 |
|
||||
Total Europe & Eurasia |
54.9 |
56.8 |
68.0 |
2778.8 |
78.7 |
37.8% |
75.9 |
|
||||
Bahrain |
0.2 |
0.1 |
0.2 |
12.3 |
0.3 |
0.2% |
26.8 |
|
||||
Iran |
19.8 |
26.1 |
33.1 |
1168.6 |
33.1 |
15.9% |
* |
|
||||
Iraq |
3.1 |
3.1 |
3.2 |
126.7 |
3.6 |
1.7% |
* |
|
||||
Kuwait |
1.5 |
1.6 |
1.8 |
63.0 |
1.8 |
0.9% |
* |
|
||||
Oman |
0.1 |
0.9 |
0.9 |
33.5 |
0.9 |
0.5% |
35.8 |
|
||||
Qatar |
6.4 |
25.8 |
25.0 |
884.5 |
25.0 |
12.0% |
* |
|
||||
Saudi Arabia |
5.2 |
6.5 |
8.0 |
287.8 |
8.2 |
3.9% |
82.1 |
|
||||
Syria |
0.2 |
0.2 |
0.3 |
10.1 |
0.3 |
0.1% |
34.3 |
|
||||
United Arab Emirates |
5.8 |
6.1 |
6.1 |
215.1 |
6.1 |
2.9% |
* |
|
||||
Yemen |
0.4 |
0.5 |
0.5 |
16.9 |
0.5 |
0.2% |
50.7 |
|
||||
Other Middle East |
† |
0.1 |
0.2 |
7.8 |
0.2 |
0.1% |
49.3 |
|
||||
Total Middle East |
42.7 |
70.9 |
79.4 |
2826.3 |
80.0 |
38.4% |
* |
|
||||
Algeria |
3.6 |
4.5 |
4.5 |
159.1 |
4.5 |
2.2% |
57.7 |
|
||||
Egypt |
0.4 |
1.6 |
2.2 |
77.3 |
2.2 |
1.1% |
35.7 |
|
||||
Libya |
1.3 |
1.3 |
1.5 |
52.8 |
1.5 |
0.7% |
* |
|
||||
Nigeria |
3.4 |
4.6 |
5.1 |
180.5 |
5.1 |
2.5% |
* |
|
||||
Other Africa |
0.8 |
1.1 |
1.2 |
43.5 |
1.2 |
0.6% |
63.4 |
|
||||
Total Africa |
9.5 |
13.1 |
14.5 |
513.2 |
14.5 |
7.0% |
71.7 |
|
||||
Australia |
0.9 |
2.7 |
3.7 |
132.8 |
3.8 |
1.8% |
83.6 |
|
||||
Bangladesh |
0.7 |
0.3 |
0.4 |
12.5 |
0.4 |
0.2% |
17.8 |
|
||||
Brunei |
0.4 |
0.4 |
0.3 |
10.2 |
0.3 |
0.1% |
22.5 |
|
||||
China |
1.0 |
1.4 |
2.9 |
107.7 |
3.1 |
1.5% |
29.8 |
|
||||
India |
0.7 |
0.8 |
1.1 |
43.8 |
1.2 |
0.6% |
26.9 |
|
||||
Indonesia |
1.8 |
2.6 |
3.0 |
104.7 |
3.0 |
1.4% |
39.2 |
|
||||
Malaysia |
1.7 |
2.5 |
2.4 |
86.0 |
2.4 |
1.2% |
39.4 |
|
||||
Myanmar |
0.3 |
0.3 |
0.2 |
7.8 |
0.2 |
0.1% |
17.8 |
|
||||
Pakistan |
0.8 |
0.7 |
0.8 |
27.5 |
0.8 |
0.4% |
19.9 |
|
||||
Papua New Guinea |
0.4 |
0.4 |
0.4 |
15.6 |
0.4 |
0.2% |
* |
|
||||
Thailand |
0.2 |
0.4 |
0.3 |
9.9 |
0.3 |
0.1% |
7.6 |
|
||||
Vietnam |
† |
0.2 |
0.6 |
21.8 |
0.6 |
0.3% |
72.3 |
|
||||
Other Asia Pacific |
0.3 |
0.4 |
0.4 |
12.1 |
0.3 |
0.2% |
18.9 |
|
||||
Total Asia Pacific |
9.3 |
13.1 |
16.5 |
592.5 |
16.8 |
8.0% |
35.0 |
|
||||
Total World |
131.2 |
168.5 |
196.1 |
7360.9 |
208.4 |
100.0% |
63.6 |
|
||||
of which: OECD |
15.2 |
16.1 |
18.1 |
660.2 |
18.7 |
9.0% |
16.0 |
|
||||
Non-OECD |
116.1 |
152.5 |
178.0 |
6700.7 |
189.7 |
91.0% |
90.0 |
|
||||
European Union |
3.8 |
3.6 |
2.3 |
64.4 |
1.8 |
0.9% |
11.8 |
|
||||
Former Soviet Union |
49.8 |
50.9 |
63.5 |
2638.5 |
74.7 |
35.8% |
96.3 |
|
||||
*More than 100 years.
†Less than 0.05.Less than 0.05%. n/a not available.
Notes: Proved reserves of natural gas – Generally taken to be those quantities that geological and engineering information indicates with reasonable certainty can be recovered in the future from known reservoirs under existing economic and operating conditions.
Reserves-to-production (R/P) ratio – If the reserves remaining at the end of any year are divided by the production in that year, the result is the length of time that those remaining reserves would last if production were to continue at that rate.
Source of data – The estimates in this table have been compiled using a combination of primary official sources and third-party data from Cedigaz and the OPEC Secretariat.
20
Reserves-to-production (R/P) ratios
Years
2011 by region |
History |
200 |
|
North America |
|
Middle East |
800 |
|
|
||||
|
|
|
|
||
|
|
S. & Cent. America |
|
Asia Pacific |
|
|
|
|
|
||
|
|
|
|
||
|
|
Europe & Eurasia |
|
World |
|
|
|
|
|
||
|
|
|
|
|
|
|
|
|
|
|
|
Africa |
|
|
|
|
|
|
|
|
|
|
|
|
160 |
|
|
|
|
|
|
|
|
|
|
|
|
|
|
|
|
|
|
|
|
|
|
600 |
|
|
|
|
|
|
120 |
|
|
|
|
|
|
|
|
|
|
|
|
|
|
|
|
|
|
|
|
|
|
400 |
|
|
|
|
|
|
80 |
|
|
|
|
|
|
|
|
|
|
|
|
|
|
|
|
|
|
|
|
|
|
200 |
|
|
|
|
|
|
40 |
|
|
|
|
|
|
|
|
North |
S. & Cent. |
Europe & |
Middle |
Africa |
Asia |
0 |
81 |
86 |
91 |
96 |
01 |
06 |
11 |
0 |
America |
America |
Eurasia |
East |
|
Pacific |
|
|
|
|
|
|
|
|
|
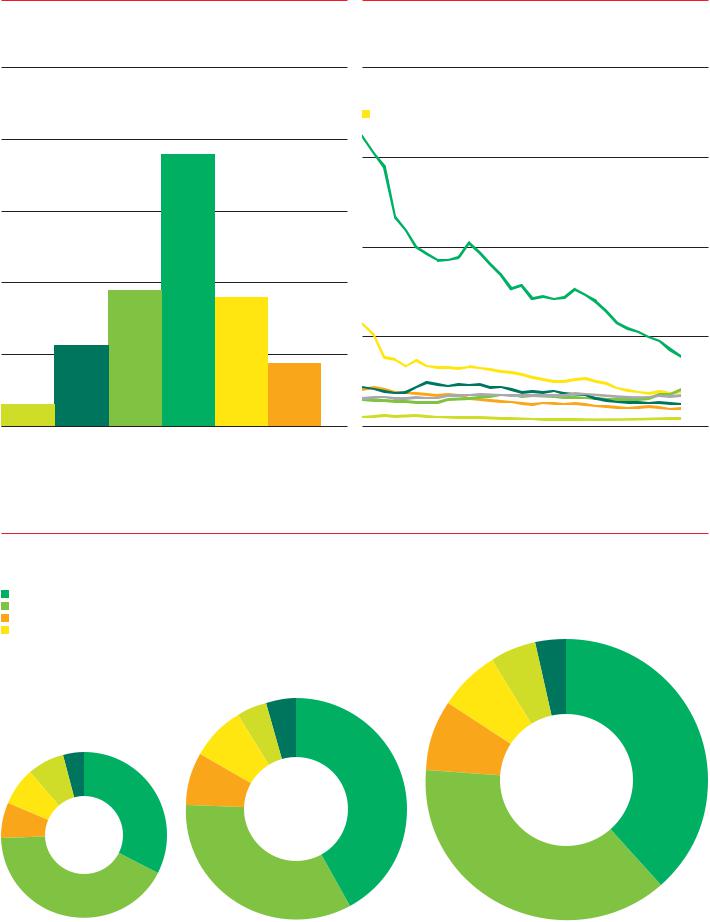
World proved natural gas reserves at end-2011 were sufficient to meet 63.6 years of production. A large increase in Turkmen reserves pushed the R/P ratio for Europe & Eurasia to 75.9 years. The Middle East still holds the largest reserves (38.4% of the world total, compared with 37.8% for Europe & Eurasia) and has an R/P ratio of over 150 years.
Distribution of proved reserves in 1991, 2001 and 2011
Percentage
Middle East
Europe & Eurasia
Asia Pacific
Africa
|
North America |
|
|
|
|
3.6 |
38.4 |
|
|
|
|
|
|
||||
|
S. & Cent. America |
|
|
|
||||
|
|
|
|
5.2 |
|
|||
|
|
|
|
|
|
|
|
|
|
|
|
|
|
4.2 |
42.1 |
7.0 |
|
|
|
|
|
|
|
|
||
|
|
|
|
|
4.6 |
|
|
|
|
|
4.0 |
32.6 |
|
7.8 |
|
|
|
|
|
|
|
8.0 |
|
2011 |
||
|
|
7.2 |
|
|
|
|
||
|
|
|
|
|
|
Total 208.4 |
||
|
|
|
|
|
|
2001 |
trillion cubic |
|
7.2 |
|
|
7.7 |
|
|
metres |
||
|
|
Total 168.5 |
|
|||||
|
|
|
|
|
|
|
||
|
|
1991 |
|
trillion cubic |
|
|
||
|
|
|
metres |
|
|
|||
7.1 |
Total 131.2 |
|
|
|
||||
|
|
|
|
|
||||
trillion cubic metres
41.8
37.8
33.7
21

Production*
|
|
|
|
|
|
|
|
|
|
|
|
|
Change |
2011 |
|
|
|
|
|
|
|
|
|
|
|
|
|
2011 over |
share of |
|
Billion cubic metres |
2001 |
2002 |
2003 |
2004 |
2005 |
2006 |
2007 |
2008 |
2009 |
2010 |
2011 |
2010 |
total |
|
US |
555.5 |
536.0 |
540.8 |
526.4 |
511.1 |
524.0 |
545.6 |
570.8 |
584.0 |
604.1 |
651.3 |
7.7% |
20.0% |
|
Canada |
186.5 |
187.9 |
184.7 |
183.7 |
187.1 |
188.4 |
182.7 |
176.6 |
164.0 |
159.9 |
160.5 |
0.3% |
4.9% |
|
Mexico |
38.3 |
39.6 |
41.4 |
45.0 |
47.2 |
51.5 |
54.0 |
53.9 |
54.6 |
55.1 |
52.5 |
-4.7% |
1.6% |
|
Total North America |
780.3 |
763.5 |
766.9 |
755.1 |
745.5 |
763.9 |
782.2 |
801.3 |
802.6 |
819.1 |
864.2 |
5.5% |
26.5% |
|
Argentina |
37.1 |
36.1 |
41.0 |
44.9 |
45.6 |
46.1 |
44.8 |
44.1 |
41.4 |
40.1 |
38.8 |
-3.3% |
1.2% |
|
Bolivia |
4.7 |
4.9 |
6.4 |
9.8 |
11.9 |
12.9 |
13.8 |
14.3 |
12.3 |
14.2 |
15.4 |
8.1% |
0.5% |
|
Brazil |
7.7 |
9.2 |
10.0 |
11.0 |
11.0 |
11.3 |
11.2 |
13.7 |
11.7 |
14.4 |
16.7 |
16.2% |
0.5% |
|
Colombia |
6.1 |
6.2 |
6.1 |
6.4 |
6.7 |
7.0 |
7.5 |
9.1 |
10.5 |
11.3 |
11.0 |
-2.7% |
0.3% |
|
Peru |
0.4 |
0.4 |
0.5 |
0.9 |
1.5 |
1.8 |
2.7 |
3.4 |
3.5 |
7.2 |
11.4 |
56.9% |
0.3% |
|
Trinidad & Tobago |
15.5 |
18.0 |
26.3 |
27.3 |
31.0 |
36.4 |
39.0 |
39.3 |
40.6 |
42.5 |
40.7 |
-4.2% |
1.2% |
|
Venezuela |
29.6 |
28.4 |
25.2 |
28.4 |
27.4 |
31.5 |
29.5 |
30.0 |
28.7 |
30.2 |
31.2 |
3.2% |
0.9% |
|
Other S. & Cent. America |
3.5 |
3.4 |
3.1 |
3.1 |
3.4 |
4.1 |
3.9 |
3.7 |
3.2 |
2.9 |
2.7 |
-8.3% |
0.1% |
|
Total S. & Cent. America |
104.5 |
106.7 |
118.7 |
131.7 |
138.6 |
151.1 |
152.5 |
157.6 |
151.9 |
162.8 |
167.7 |
3.0% |
5.1% |
|
Azerbaijan |
5.0 |
4.7 |
4.6 |
4.5 |
5.2 |
6.1 |
9.8 |
14.8 |
14.8 |
15.1 |
14.8 |
-1.8% |
0.5% |
|
Denmark |
8.4 |
8.4 |
8.0 |
9.4 |
10.4 |
10.4 |
9.2 |
10.1 |
8.4 |
8.2 |
7.1 |
-14.0% |
0.2% |
|
Germany |
17.0 |
17.0 |
17.7 |
16.4 |
15.8 |
15.6 |
14.3 |
13.0 |
12.2 |
10.6 |
10.0 |
-5.9% |
0.3% |
|
Italy |
14.0 |
13.4 |
12.7 |
11.9 |
11.1 |
10.1 |
8.9 |
8.5 |
7.3 |
7.6 |
7.7 |
0.7% |
0.2% |
|
Kazakhstan |
9.2 |
9.1 |
11.9 |
13.1 |
13.5 |
13.9 |
16.7 |
18.7 |
17.8 |
17.6 |
19.3 |
9.6% |
0.6% |
|
Netherlands |
62.4 |
60.3 |
58.1 |
68.5 |
62.5 |
61.6 |
60.5 |
66.6 |
62.7 |
70.5 |
64.2 |
-9.0% |
2.0% |
|
Norway |
53.9 |
65.5 |
73.1 |
78.5 |
85.0 |
87.6 |
89.7 |
99.3 |
103.7 |
106.4 |
101.4 |
-4.6% |
3.1% |
|
Poland |
3.9 |
4.0 |
4.0 |
4.4 |
4.3 |
4.3 |
4.3 |
4.1 |
4.1 |
4.1 |
4.3 |
4.3% |
0.1% |
|
Romania |
13.6 |
13.2 |
13.0 |
12.8 |
12.4 |
11.9 |
11.5 |
11.4 |
11.3 |
10.9 |
11.0 |
1.4% |
0.3% |
|
Russian Federation |
526.2 |
538.8 |
561.5 |
573.3 |
580.1 |
595.2 |
592.0 |
601.7 |
527.7 |
588.9 |
607.0 |
3.1% |
18.5% |
|
Turkmenistan |
46.4 |
48.4 |
53.5 |
52.8 |
57.0 |
60.4 |
65.4 |
66.1 |
36.4 |
42.4 |
59.5 |
40.6% |
1.8% |
|
Ukraine |
16.6 |
17.0 |
17.6 |
18.4 |
18.6 |
18.7 |
18.7 |
19.0 |
19.2 |
18.1 |
18.2 |
0.4% |
0.6% |
|
United Kingdom |
105.8 |
103.6 |
102.9 |
96.4 |
88.2 |
80.0 |
72.1 |
69.6 |
59.7 |
57.1 |
45.2 |
-20.8% |
1.4% |
|
Uzbekistan |
52.0 |
51.9 |
52.0 |
54.2 |
54.0 |
54.5 |
59.1 |
62.2 |
60.0 |
59.6 |
57.0 |
-4.4% |
1.7% |
|
Other Europe & Eurasia |
10.9 |
11.2 |
10.6 |
11.0 |
10.9 |
11.5 |
10.8 |
10.3 |
9.7 |
9.8 |
9.6 |
-2.0% |
0.3% |
|
Total Europe & Eurasia |
945.3 |
966.4 |
1001.2 |
1025.4 |
1029.0 |
1041.7 |
1043.1 |
1075.4 |
954.9 |
1026.9 |
1036.4 |
0.9% |
31.6% |
|
Bahrain |
9.1 |
9.5 |
9.6 |
9.8 |
10.7 |
11.3 |
11.8 |
12.7 |
12.8 |
13.1 |
13.0 |
-0.8% |
0.4% |
|
Iran |
66.0 |
75.0 |
81.5 |
84.9 |
103.5 |
108.6 |
111.9 |
116.3 |
131.2 |
146.2 |
151.8 |
3.9% |
4.6% |
|
Iraq |
2.8 |
2.4 |
1.6 |
1.0 |
1.5 |
1.5 |
1.5 |
1.9 |
1.2 |
1.3 |
1.9 |
42.0% |
0.1% |
|
Kuwait |
10.5 |
9.5 |
11.0 |
11.9 |
12.2 |
12.5 |
12.1 |
12.8 |
11.2 |
11.7 |
13.0 |
10.4% |
0.4% |
|
Oman |
14.0 |
15.0 |
16.5 |
18.5 |
19.8 |
23.7 |
24.0 |
24.1 |
24.8 |
27.1 |
26.5 |
-2.2% |
0.8% |
|
Qatar |
27.0 |
29.5 |
31.4 |
39.2 |
45.8 |
50.7 |
63.2 |
77.0 |
89.3 |
116.7 |
146.8 |
25.8% |
4.5% |
|
Saudi Arabia |
53.7 |
56.7 |
60.1 |
65.7 |
71.2 |
73.5 |
74.4 |
80.4 |
78.5 |
87.7 |
99.2 |
13.2% |
3.0% |
|
Syria |
5.0 |
6.1 |
6.2 |
6.4 |
5.5 |
5.6 |
5.6 |
5.3 |
5.6 |
7.7 |
8.3 |
8.7% |
0.3% |
|
United Arab Emirates |
44.9 |
43.4 |
44.8 |
46.3 |
47.8 |
49.0 |
50.3 |
50.2 |
48.8 |
51.3 |
51.7 |
0.9% |
1.6% |
|
Yemen |
– |
– |
– |
– |
– |
– |
– |
– |
0.8 |
6.2 |
9.4 |
51.3% |
0.3% |
|
Other Middle East |
0.3 |
0.3 |
0.3 |
1.5 |
1.9 |
2.6 |
3.0 |
3.7 |
3.1 |
3.4 |
4.5 |
31.0% |
0.1% |
|
Total Middle East |
233.3 |
247.2 |
262.9 |
285.1 |
319.9 |
339.1 |
357.8 |
384.3 |
407.0 |
472.3 |
526.1 |
11.4% |
16.0% |
|
Algeria |
78.2 |
80.4 |
82.8 |
82.0 |
88.2 |
84.5 |
84.8 |
85.8 |
79.6 |
80.4 |
78.0 |
-3.0% |
2.4% |
|
Egypt |
25.2 |
27.3 |
30.1 |
33.0 |
42.5 |
54.7 |
55.7 |
59.0 |
62.7 |
61.3 |
61.3 |
-0.1% |
1.9% |
|
Libya |
6.2 |
5.9 |
5.5 |
8.1 |
11.3 |
13.2 |
15.3 |
15.9 |
15.9 |
16.8 |
4.1 |
-75.6% |
0.1% |
|
Nigeria |
14.9 |
14.2 |
19.2 |
22.8 |
22.4 |
28.4 |
35.0 |
35.0 |
24.8 |
36.6 |
39.9 |
9.0% |
1.2% |
|
Other Africa |
6.9 |
6.6 |
7.2 |
8.9 |
9.9 |
10.4 |
12.3 |
15.8 |
16.3 |
18.4 |
19.4 |
5.4% |
0.6% |
|
Total Africa |
131.5 |
134.4 |
144.9 |
154.7 |
174.3 |
191.2 |
203.1 |
211.5 |
199.2 |
213.6 |
202.7 |
-5.1% |
6.2% |
|
Australia |
32.5 |
32.6 |
33.2 |
35.3 |
37.1 |
38.9 |
40.0 |
38.3 |
42.3 |
45.6 |
45.0 |
-1.3% |
1.4% |
|
Bangladesh |
10.7 |
11.4 |
12.3 |
12.8 |
13.8 |
14.9 |
15.9 |
17.0 |
18.5 |
19.9 |
19.9 |
-0.1% |
0.6% |
|
Brunei |
11.4 |
11.5 |
12.4 |
12.2 |
12.0 |
12.6 |
12.3 |
12.2 |
11.4 |
12.3 |
12.8 |
4.2% |
0.4% |
|
China |
30.3 |
32.7 |
35.0 |
41.5 |
49.3 |
58.6 |
69.2 |
80.3 |
85.3 |
94.8 |
102.5 |
8.1% |
3.1% |
|
India |
26.4 |
27.6 |
29.5 |
29.2 |
29.6 |
29.3 |
30.1 |
30.5 |
39.2 |
50.8 |
46.1 |
-9.3% |
1.4% |
|
Indonesia |
63.3 |
69.7 |
73.2 |
70.3 |
71.2 |
70.3 |
67.6 |
69.7 |
71.9 |
82.0 |
75.6 |
-7.8% |
2.3% |
|
Malaysia |
46.9 |
48.3 |
51.8 |
53.9 |
61.1 |
63.3 |
64.6 |
64.7 |
64.1 |
62.6 |
61.8 |
-1.3% |
1.9% |
|
Myanmar |
7.0 |
8.4 |
9.6 |
10.2 |
12.2 |
12.6 |
13.5 |
12.4 |
11.5 |
12.1 |
12.4 |
2.6% |
0.4% |
|
Pakistan |
22.7 |
24.6 |
30.4 |
34.5 |
35.5 |
36.1 |
36.8 |
37.5 |
38.4 |
39.6 |
39.2 |
-1.2% |
1.2% |
|
Thailand |
19.6 |
20.5 |
21.5 |
22.4 |
23.7 |
24.3 |
26.0 |
28.8 |
30.9 |
36.3 |
37.0 |
2.0% |
1.1% |
|
Vietnam |
2.0 |
2.4 |
2.4 |
4.2 |
6.4 |
7.0 |
7.1 |
7.5 |
8.0 |
9.4 |
8.5 |
-9.2% |
0.3% |
|
Other Asia Pacific |
9.5 |
10.9 |
10.7 |
10.1 |
11.1 |
14.6 |
17.4 |
18.3 |
18.6 |
18.1 |
18.3 |
1.0% |
0.6% |
|
Total Asia Pacific |
282.4 |
300.6 |
322.0 |
336.4 |
363.1 |
382.4 |
400.5 |
417.1 |
440.3 |
483.6 |
479.1 |
-0.9% |
14.6% |
|
Total World |
2477.2 |
2518.9 |
2616.6 |
2688.5 |
2770.4 |
2869.4 |
2939.3 |
3047.2 |
2955.9 |
3178.2 |
3276.2 |
3.1% |
100.0% |
|
of which: OECD |
1097.2 |
1087.1 |
1093.5 |
1093.7 |
1078.6 |
1091.5 |
1100.9 |
1130.9 |
1121.9 |
1148.2 |
1168.1 |
1.7% |
35.8% |
|
Non-OECD |
1380.1 |
1431.8 |
1523.0 |
1594.8 |
1691.8 |
1777.9 |
1838.4 |
1916.4 |
1834.0 |
2030.0 |
2108.1 |
3.8% |
64.2% |
|
European Union |
232.8 |
227.6 |
223.6 |
227.3 |
212.0 |
201.3 |
187.5 |
189.4 |
171.5 |
174.9 |
155.0 |
-11.4% |
4.7% |
|
Former Soviet Union |
655.7 |
670.2 |
701.4 |
716.6 |
728.7 |
749.0 |
762.0 |
782.7 |
676.0 |
741.9 |
776.1 |
4.6% |
23.6% |
*Excluding gas flared or recycled. |
|
|
|
|
|
|
|
|
|
Source: Includes data from Cedigaz. |
||||
Notes: As far as possible, the data above represents standard cubic metres (measured at 15ºC and 1013 mbar); as they are derived directly from tonnes of oil equivalent using an average
conversion factor, they do not necessarily equate with gas volumes expressed in specific national terms.
Annual changes and shares of total are calculated using million tonnes of oil equivalent figures.
Natural gas production data expressed in billion cubic feet per day is available at bp.com/statisticalreview.
22

Consumption
|
|
|
|
|
|
|
|
|
|
|
|
|
Change |
2011 |
|
|
|
|
|
|
|
|
|
|
|
|
|
2011 over |
share of |
|
Billion cubic metres |
2001 |
2002 |
2003 |
2004 |
2005 |
2006 |
2007 |
2008 |
2009 |
2010 |
2011 |
2010 |
total |
|
US |
629.7 |
652.1 |
630.8 |
634.4 |
623.4 |
614.4 |
654.2 |
659.1 |
648.7 |
673.2 |
690.1 |
2.4% |
21.5% |
|
Canada |
88.2 |
90.2 |
97.7 |
95.1 |
97.8 |
96.9 |
96.2 |
96.1 |
94.9 |
95.0 |
104.8 |
10.3% |
3.2% |
|
Mexico |
41.8 |
45.5 |
50.4 |
55.8 |
56.1 |
60.9 |
63.2 |
66.1 |
66.2 |
67.9 |
68.9 |
1.5% |
2.1% |
|
Total North America |
759.8 |
787.8 |
778.9 |
785.2 |
777.3 |
772.2 |
813.7 |
821.3 |
809.9 |
836.2 |
863.8 |
3.2% |
26.9% |
|
Argentina |
31.1 |
30.3 |
34.6 |
37.9 |
40.4 |
41.8 |
43.9 |
44.4 |
43.2 |
43.3 |
46.5 |
7.5% |
1.4% |
|
Brazil |
11.9 |
14.1 |
15.8 |
18.8 |
19.7 |
20.8 |
21.1 |
24.6 |
19.8 |
26.8 |
26.7 |
-0.3% |
0.8% |
|
Chile |
7.3 |
7.4 |
8.0 |
8.7 |
8.4 |
7.8 |
4.6 |
2.7 |
3.1 |
4.7 |
5.3 |
11.7% |
0.2% |
|
Colombia |
6.1 |
6.1 |
6.0 |
6.3 |
6.7 |
7.0 |
7.4 |
7.6 |
8.7 |
9.1 |
9.0 |
-0.8% |
0.3% |
|
Ecuador |
0.3 |
0.2 |
0.3 |
0.3 |
0.4 |
0.7 |
0.5 |
0.5 |
0.5 |
0.5 |
0.5 |
– |
|
|
|
|||||||||||||
|
Peru |
0.4 |
0.4 |
0.5 |
0.9 |
1.5 |
1.8 |
2.7 |
3.4 |
3.5 |
5.4 |
6.2 |
15.2% |
0.2% |
|
Trinidad & Tobago |
11.6 |
12.7 |
14.4 |
13.4 |
15.1 |
20.2 |
20.3 |
21.9 |
20.9 |
22.6 |
22.0 |
-2.7% |
0.7% |
|
Venezuela |
29.6 |
28.4 |
25.2 |
28.4 |
27.4 |
31.5 |
29.6 |
31.5 |
30.5 |
32.4 |
33.1 |
2.3% |
1.0% |
|
Other S. & Cent. America |
2.3 |
2.4 |
3.1 |
2.9 |
3.3 |
3.9 |
4.5 |
4.7 |
5.1 |
5.4 |
5.2 |
-4.6% |
0.2% |
|
Total S. & Cent. America |
100.7 |
102.1 |
107.9 |
117.5 |
122.9 |
135.5 |
134.6 |
141.3 |
135.1 |
150.2 |
154.5 |
2.9% |
4.8% |
|
Austria |
8.6 |
8.5 |
9.4 |
9.5 |
10.0 |
9.4 |
8.9 |
9.5 |
9.3 |
10.1 |
9.5 |
-6.0% |
0.3% |
|
Azerbaijan |
7.5 |
7.5 |
7.7 |
8.3 |
8.6 |
9.1 |
8.0 |
9.2 |
7.8 |
7.4 |
8.2 |
9.6% |
0.3% |
|
Belarus |
15.7 |
16.1 |
15.8 |
17.9 |
18.4 |
19.0 |
18.8 |
19.2 |
16.1 |
19.7 |
18.3 |
-7.2% |
0.6% |
|
Belgium |
14.6 |
14.9 |
16.0 |
16.2 |
16.4 |
16.7 |
16.6 |
16.5 |
16.8 |
18.8 |
16.1 |
-14.8% |
0.5% |
|
Bulgaria |
3.0 |
2.7 |
2.8 |
2.8 |
3.1 |
3.2 |
3.2 |
3.2 |
2.3 |
2.6 |
2.9 |
14.5% |
0.1% |
|
Czech Republic |
8.9 |
8.7 |
8.7 |
9.1 |
9.6 |
9.3 |
8.7 |
8.7 |
8.2 |
9.3 |
8.4 |
-9.3% |
0.3% |
|
Denmark |
5.1 |
5.1 |
5.2 |
5.2 |
5.0 |
5.1 |
4.6 |
4.6 |
4.4 |
5.0 |
4.2 |
-16.2% |
0.1% |
|
Finland |
4.1 |
4.0 |
4.5 |
4.3 |
4.0 |
4.2 |
3.9 |
4.0 |
3.6 |
3.9 |
3.6 |
-10.0% |
0.1% |
|
France |
41.9 |
40.5 |
43.0 |
45.1 |
44.0 |
42.1 |
42.4 |
43.8 |
42.2 |
46.9 |
40.3 |
-13.9% |
1.2% |
|
Germany |
82.9 |
82.6 |
85.5 |
85.9 |
86.2 |
87.2 |
82.9 |
81.2 |
78.0 |
83.3 |
72.5 |
-12.9% |
2.2% |
|
Greece |
2.0 |
2.1 |
2.4 |
2.7 |
2.7 |
3.1 |
3.8 |
4.0 |
3.4 |
3.7 |
4.5 |
24.3% |
0.1% |
|
Hungary |
11.9 |
11.8 |
13.2 |
13.0 |
13.4 |
12.7 |
11.9 |
11.8 |
10.1 |
10.9 |
10.2 |
-6.8% |
0.3% |
|
Republic of Ireland |
4.0 |
4.1 |
4.1 |
4.1 |
3.9 |
4.5 |
4.8 |
5.0 |
4.8 |
5.2 |
4.7 |
-10.5% |
0.1% |
|
Italy |
65.0 |
64.6 |
71.2 |
73.9 |
79.1 |
77.4 |
77.8 |
77.8 |
71.5 |
76.1 |
71.3 |
-6.2% |
2.2% |
|
Kazakhstan |
8.2 |
8.7 |
9.6 |
7.5 |
9.3 |
9.9 |
8.4 |
8.1 |
7.8 |
8.2 |
9.2 |
13.0% |
0.3% |
|
Lithuania |
2.8 |
2.9 |
3.1 |
3.1 |
3.3 |
3.2 |
3.6 |
3.2 |
2.7 |
3.1 |
3.4 |
9.0% |
0.1% |
|
Netherlands |
40.0 |
39.8 |
40.0 |
40.9 |
39.3 |
38.1 |
37.0 |
38.6 |
38.9 |
43.6 |
38.1 |
-12.7% |
1.2% |
|
Norway |
3.8 |
4.0 |
4.3 |
4.6 |
4.5 |
4.4 |
4.3 |
4.3 |
4.1 |
4.1 |
4.0 |
-2.1% |
0.1% |
|
Poland |
11.5 |
11.2 |
12.5 |
13.2 |
13.6 |
13.7 |
13.8 |
14.9 |
14.4 |
15.5 |
15.4 |
-1.0% |
0.5% |
|
Portugal |
2.6 |
3.1 |
3.0 |
3.8 |
4.2 |
4.1 |
4.3 |
4.6 |
4.7 |
5.0 |
5.1 |
1.8% |
0.2% |
|
Romania |
16.6 |
17.2 |
18.3 |
17.5 |
17.6 |
18.1 |
16.1 |
15.9 |
13.3 |
13.6 |
13.8 |
2.0% |
0.4% |
|
Russian Federation |
366.2 |
367.7 |
384.9 |
394.1 |
400.3 |
408.5 |
422.1 |
416.0 |
389.6 |
414.1 |
424.6 |
2.5% |
13.2% |
|
Slovakia |
6.9 |
6.5 |
6.3 |
6.1 |
6.6 |
6.0 |
5.7 |
5.7 |
4.9 |
5.6 |
6.2 |
12.3% |
0.2% |
|
Spain |
18.2 |
20.8 |
23.6 |
27.4 |
32.4 |
33.7 |
35.1 |
38.6 |
34.6 |
34.6 |
32.1 |
-7.2% |
1.0% |
|
Sweden |
0.7 |
0.8 |
0.8 |
0.8 |
0.8 |
0.9 |
1.0 |
0.9 |
1.1 |
1.6 |
1.3 |
-19.1% |
|
|
|
|||||||||||||
|
Switzerland |
2.8 |
2.8 |
2.9 |
3.0 |
3.1 |
3.0 |
2.9 |
3.1 |
3.0 |
3.3 |
2.9 |
-12.8% |
0.1% |
|
Turkey |
16.0 |
17.4 |
20.9 |
22.1 |
26.9 |
30.5 |
36.1 |
37.5 |
35.7 |
39.0 |
45.7 |
17.3% |
1.4% |
|
Turkmenistan |
12.5 |
12.9 |
14.2 |
15.0 |
16.1 |
18.4 |
21.3 |
20.5 |
19.9 |
22.6 |
25.0 |
10.4% |
0.8% |
|
Ukraine |
68.8 |
67.7 |
69.0 |
68.5 |
69.0 |
67.0 |
63.2 |
60.0 |
47.0 |
52.1 |
53.7 |
3.0% |
1.7% |
|
United Kingdom |
96.4 |
95.1 |
95.4 |
97.4 |
95.0 |
90.1 |
91.1 |
93.9 |
86.7 |
94.0 |
80.2 |
-14.6% |
2.5% |
|
Uzbekistan |
49.6 |
50.9 |
45.8 |
43.4 |
42.7 |
41.9 |
45.9 |
48.7 |
43.5 |
45.5 |
49.1 |
7.9% |
1.5% |
|
Other Europe & Eurasia |
15.3 |
14.8 |
15.3 |
16.9 |
17.2 |
17.8 |
18.2 |
17.3 |
14.9 |
16.2 |
16.6 |
2.7% |
0.5% |
|
Total Europe & Eurasia |
1014.2 |
1017.5 |
1059.6 |
1083.2 |
1105.9 |
1112.2 |
1126.2 |
1130.6 |
1045.4 |
1124.6 |
1101.1 |
-2.1% |
34.1% |
|
Iran |
70.1 |
79.2 |
82.9 |
86.5 |
105.0 |
108.7 |
113.0 |
119.3 |
131.4 |
144.6 |
153.3 |
6.1% |
4.7% |
|
Israel |
† |
† |
† |
1.2 |
1.7 |
2.3 |
2.8 |
4.1 |
4.5 |
5.3 |
5.0 |
-6.0% |
0.2% |
|
Kuwait |
10.5 |
9.5 |
11.0 |
11.9 |
12.2 |
12.5 |
12.1 |
12.8 |
12.1 |
14.5 |
16.2 |
11.5% |
0.5% |
|
Qatar |
11.0 |
11.1 |
12.2 |
15.0 |
18.7 |
19.6 |
19.3 |
19.3 |
20.0 |
20.4 |
23.8 |
16.4% |
0.7% |
|
Saudi Arabia |
53.7 |
56.7 |
60.1 |
65.7 |
71.2 |
73.5 |
74.4 |
80.4 |
78.5 |
87.7 |
99.2 |
13.2% |
3.1% |
|
United Arab Emirates |
37.9 |
36.4 |
37.9 |
40.2 |
42.1 |
43.4 |
49.2 |
59.5 |
59.1 |
60.8 |
62.9 |
3.5% |
1.9% |
|
Other Middle East |
23.7 |
24.6 |
25.0 |
26.5 |
28.4 |
31.5 |
32.3 |
36.5 |
38.6 |
44.0 |
42.7 |
-3.0% |
1.3% |
|
Total Middle East |
206.8 |
217.6 |
229.0 |
247.1 |
279.2 |
291.5 |
303.1 |
331.9 |
344.1 |
377.3 |
403.1 |
6.9% |
12.5% |
|
Algeria |
20.5 |
20.2 |
21.4 |
22.0 |
23.2 |
23.7 |
24.3 |
25.4 |
27.2 |
26.3 |
28.0 |
6.5% |
0.9% |
|
Egypt |
24.5 |
26.5 |
29.7 |
31.7 |
31.6 |
36.5 |
38.4 |
40.8 |
42.5 |
45.1 |
49.6 |
10.0% |
1.5% |
|
South Africa |
1.2 |
1.0 |
1.0 |
2.1 |
3.1 |
3.5 |
3.5 |
3.7 |
3.4 |
3.9 |
4.3 |
8.9% |
0.1% |
|
Other Africa |
17.6 |
18.0 |
20.4 |
23.8 |
25.0 |
24.4 |
28.3 |
30.2 |
25.7 |
31.5 |
27.9 |
-11.6% |
0.9% |
|
Total Africa |
63.8 |
65.8 |
72.6 |
79.7 |
83.0 |
88.1 |
94.4 |
100.1 |
98.9 |
106.9 |
109.8 |
2.7% |
3.4% |
|
Australia |
22.0 |
22.4 |
22.4 |
22.8 |
22.2 |
24.4 |
26.6 |
25.5 |
25.2 |
25.7 |
25.6 |
-0.4% |
0.8% |
|
Bangladesh |
10.7 |
11.4 |
12.3 |
12.8 |
13.8 |
14.9 |
15.9 |
17.0 |
18.5 |
19.9 |
19.9 |
-0.1% |
0.6% |
|
China |
27.4 |
29.2 |
33.9 |
39.7 |
46.8 |
56.1 |
70.5 |
81.3 |
89.5 |
107.6 |
130.7 |
21.5% |
4.0% |
|
China Hong Kong SAR |
3.0 |
2.9 |
1.8 |
2.7 |
2.7 |
2.9 |
2.7 |
3.2 |
3.1 |
3.8 |
3.1 |
-20.4% |
0.1% |
|
India |
26.4 |
27.6 |
29.5 |
31.9 |
35.7 |
37.3 |
40.1 |
41.3 |
51.0 |
61.9 |
61.1 |
-1.2% |
1.9% |
|
Indonesia |
31.0 |
32.9 |
35.0 |
32.2 |
33.2 |
33.2 |
31.3 |
33.3 |
37.4 |
40.3 |
37.9 |
-5.9% |
1.2% |
|
Japan |
74.3 |
72.7 |
79.8 |
77.0 |
78.6 |
83.7 |
90.2 |
93.7 |
87.4 |
94.5 |
105.5 |
11.6% |
3.3% |
|
Malaysia |
25.2 |
26.2 |
27.3 |
24.7 |
31.4 |
33.7 |
33.4 |
33.8 |
33.7 |
31.9 |
28.5 |
-10.5% |
0.9% |
|
New Zealand |
5.9 |
5.6 |
4.3 |
3.9 |
3.6 |
3.7 |
4.1 |
3.8 |
4.0 |
4.3 |
3.9 |
-10.0% |
0.1% |
|
Pakistan |
22.7 |
24.6 |
30.4 |
34.5 |
35.5 |
36.1 |
36.8 |
37.5 |
38.4 |
39.6 |
39.2 |
-1.2% |
1.2% |
|
Philippines |
0.1 |
1.8 |
2.7 |
2.5 |
3.3 |
2.6 |
3.2 |
3.3 |
3.3 |
3.1 |
3.6 |
16.0% |
0.1% |
|
Singapore |
0.9 |
3.6 |
4.0 |
5.0 |
6.8 |
7.1 |
8.6 |
8.2 |
8.1 |
8.4 |
8.8 |
4.4% |
0.3% |
|
South Korea |
20.8 |
23.1 |
24.2 |
28.4 |
30.4 |
32.0 |
34.7 |
35.7 |
33.9 |
43.0 |
46.6 |
8.3% |
1.4% |
|
Taiwan |
7.3 |
8.2 |
8.4 |
10.2 |
10.3 |
11.1 |
11.8 |
11.6 |
11.3 |
14.1 |
15.5 |
10.1% |
0.5% |
|
Thailand |
24.8 |
26.9 |
28.6 |
29.9 |
32.5 |
33.3 |
35.4 |
37.4 |
39.2 |
45.1 |
46.6 |
3.3% |
1.4% |
|
Vietnam |
2.0 |
2.4 |
2.4 |
4.2 |
6.4 |
7.0 |
7.1 |
7.5 |
8.0 |
9.4 |
8.5 |
-9.2% |
0.3% |
|
Other Asia Pacific |
3.8 |
3.6 |
4.2 |
4.5 |
5.2 |
5.5 |
6.0 |
5.7 |
5.2 |
5.3 |
5.7 |
7.3% |
0.2% |
|
Total Asia Pacific |
308.4 |
325.0 |
351.3 |
366.6 |
398.4 |
424.7 |
458.3 |
479.8 |
497.2 |
557.9 |
590.6 |
5.9% |
18.3% |
|
Total World |
2453.6 |
2515.7 |
2599.3 |
2679.4 |
2766.7 |
2824.3 |
2930.4 |
3005.1 |
2930.6 |
3153.1 |
3222.9 |
2.2% |
100.0% |
|
of which: OECD |
1340.7 |
1370.4 |
1393.7 |
1418.5 |
1425.6 |
1425.7 |
1477.3 |
1499.2 |
1451.4 |
1536.2 |
1534.6 |
-0.1% |
47.7% |
|
Non-OECD |
1112.9 |
1145.4 |
1205.6 |
1260.9 |
1341.1 |
1398.6 |
1453.1 |
1505.9 |
1479.2 |
1616.9 |
1688.4 |
4.4% |
52.3% |
|
European Union |
451.9 |
451.6 |
473.7 |
486.7 |
494.8 |
487.8 |
482.0 |
491.3 |
460.1 |
496.9 |
447.9 |
-9.9% |
13.9% |
|
Former Soviet Union |
539.6 |
541.7 |
557.9 |
566.4 |
576.9 |
586.5 |
600.9 |
593.9 |
542.1 |
580.7 |
599.5 |
3.3% |
18.6% |
†Less than 0.05. |
|
|
|
|
|
|
|
|
|
Source: Includes data from Cedigaz. |
||||
Less than 0.05%.
Notes: As far as possible, the data above represents standard cubic metres (measured at 15ºC and 1013 mbar); as they are derived directly from tonnes of oil equivalent using an average conversion factor, they do not necessarily equate with gas volumes expressed in specific national terms.
The difference between these world consumption figures and the world production statistics is due to variations in stocks at storage facilities and liquefaction plants, together with unavoidable
disparities in the definition, measurement or conversion of gas supply and demand data.
Annual changes and shares of total are calculated using million tonnes of oil equivalent figures.
Natural gas consumption data expressed in billion cubic feet per day is available at bp.com/statisticalreview.
23

Production*
|
|
|
|
|
|
|
|
|
|
|
|
|
Change |
2011 |
|
|
|
|
|
|
|
|
|
|
|
|
|
2011 over |
share of |
|
Million tonnes oil equivalent |
2001 |
2002 |
2003 |
2004 |
2005 |
2006 |
2007 |
2008 |
2009 |
2010 |
2011 |
2010 |
total |
|
US |
508.2 |
489.9 |
494.7 |
480.7 |
467.6 |
479.3 |
499.6 |
521.7 |
532.7 |
549.9 |
592.3 |
7.7% |
20.0% |
|
Canada |
167.8 |
169.1 |
166.2 |
165.3 |
168.4 |
169.6 |
164.4 |
158.9 |
147.6 |
143.9 |
144.4 |
0.3% |
4.9% |
|
Mexico |
34.5 |
35.7 |
37.3 |
40.5 |
42.5 |
46.3 |
48.6 |
48.5 |
49.1 |
49.6 |
47.2 |
-4.7% |
1.6% |
|
Total North America |
710.5 |
694.6 |
698.2 |
686.5 |
678.5 |
695.3 |
712.6 |
729.2 |
729.4 |
743.4 |
784.0 |
5.5% |
26.5% |
|
Argentina |
33.4 |
32.5 |
36.9 |
40.4 |
41.1 |
41.5 |
40.3 |
39.7 |
37.2 |
36.1 |
34.9 |
-3.3% |
1.2% |
|
Bolivia |
4.2 |
4.4 |
5.7 |
8.8 |
10.7 |
11.6 |
12.4 |
12.9 |
11.1 |
12.8 |
13.8 |
8.1% |
0.5% |
|
Brazil |
6.9 |
8.3 |
9.0 |
9.9 |
9.9 |
10.2 |
10.1 |
12.4 |
10.5 |
12.9 |
15.0 |
16.2% |
0.5% |
|
Colombia |
5.5 |
5.5 |
5.5 |
5.7 |
6.0 |
6.3 |
6.8 |
8.2 |
9.5 |
10.1 |
9.9 |
-2.7% |
0.3% |
|
Peru |
0.3 |
0.4 |
0.5 |
0.8 |
1.4 |
1.6 |
2.4 |
3.1 |
3.1 |
6.5 |
10.2 |
56.9% |
0.3% |
|
Trinidad & Tobago |
13.9 |
16.2 |
23.7 |
24.6 |
27.9 |
32.8 |
35.1 |
35.4 |
36.5 |
38.2 |
36.6 |
-4.2% |
1.2% |
|
Venezuela |
26.6 |
25.6 |
22.7 |
25.6 |
24.7 |
28.3 |
26.6 |
27.0 |
25.8 |
27.2 |
28.1 |
3.2% |
0.9% |
|
Other S. & Cent. America |
3.2 |
3.0 |
2.8 |
2.8 |
3.1 |
3.7 |
3.5 |
3.4 |
2.9 |
2.6 |
2.4 |
-8.3% |
0.1% |
|
Total S. & Cent. America |
94.1 |
96.0 |
106.8 |
118.6 |
124.8 |
136.0 |
137.2 |
141.8 |
136.7 |
146.5 |
150.9 |
3.0% |
5.1% |
|
Azerbaijan |
4.5 |
4.2 |
4.2 |
4.1 |
4.7 |
5.5 |
8.8 |
13.3 |
13.3 |
13.6 |
13.3 |
-1.8% |
0.5% |
|
Denmark |
7.5 |
7.5 |
7.2 |
8.5 |
9.4 |
9.4 |
8.3 |
9.1 |
7.6 |
7.4 |
6.4 |
-14.0% |
0.2% |
|
Germany |
15.3 |
15.3 |
15.9 |
14.7 |
14.2 |
14.1 |
12.9 |
11.7 |
11.0 |
9.6 |
9.0 |
-5.9% |
0.3% |
|
Italy |
12.6 |
12.1 |
11.5 |
10.7 |
10.0 |
9.1 |
8.0 |
7.6 |
6.6 |
6.8 |
6.9 |
0.7% |
0.2% |
|
Kazakhstan |
8.2 |
8.2 |
10.7 |
11.8 |
12.2 |
12.5 |
15.0 |
16.8 |
16.0 |
15.8 |
17.3 |
9.6% |
0.6% |
|
Netherlands |
56.2 |
54.3 |
52.2 |
61.6 |
56.3 |
55.4 |
54.5 |
60.0 |
56.4 |
63.5 |
57.8 |
-9.0% |
2.0% |
|
Norway |
48.5 |
59.0 |
65.8 |
70.6 |
76.5 |
78.9 |
80.7 |
89.4 |
93.4 |
95.7 |
91.3 |
-4.6% |
3.1% |
|
Poland |
3.5 |
3.6 |
3.6 |
3.9 |
3.9 |
3.9 |
3.9 |
3.7 |
3.7 |
3.7 |
3.9 |
4.3% |
0.1% |
|
Romania |
12.2 |
11.9 |
11.7 |
11.5 |
11.2 |
10.7 |
10.4 |
10.3 |
10.1 |
9.8 |
9.9 |
1.4% |
0.3% |
|
Russian Federation |
473.6 |
484.9 |
505.4 |
516.0 |
522.1 |
535.6 |
532.8 |
541.5 |
474.9 |
530.0 |
546.3 |
3.1% |
18.5% |
|
Turkmenistan |
41.8 |
43.6 |
48.1 |
47.5 |
51.3 |
54.3 |
58.9 |
59.5 |
32.7 |
38.1 |
53.6 |
40.6% |
1.8% |
|
Ukraine |
14.9 |
15.3 |
15.8 |
16.5 |
16.7 |
16.9 |
16.9 |
17.1 |
17.3 |
16.3 |
16.4 |
0.4% |
0.6% |
|
United Kingdom |
95.2 |
93.2 |
92.6 |
86.7 |
79.4 |
72.0 |
64.9 |
62.7 |
53.7 |
51.4 |
40.7 |
-20.8% |
1.4% |
|
Uzbekistan |
46.8 |
46.7 |
46.8 |
48.8 |
48.6 |
49.0 |
53.2 |
56.0 |
54.0 |
53.7 |
51.3 |
-4.4% |
1.7% |
|
Other Europe & Eurasia |
9.8 |
10.1 |
9.6 |
9.9 |
9.8 |
10.3 |
9.7 |
9.2 |
8.8 |
8.9 |
8.7 |
-2.0% |
0.3% |
|
Total Europe & Eurasia |
850.8 |
869.8 |
901.1 |
922.8 |
926.1 |
937.6 |
938.8 |
967.9 |
859.4 |
924.2 |
932.7 |
0.9% |
31.6% |
|
Bahrain |
8.2 |
8.5 |
8.7 |
8.8 |
9.6 |
10.2 |
10.6 |
11.4 |
11.5 |
11.8 |
11.7 |
-0.8% |
0.4% |
|
Iran |
59.4 |
67.5 |
73.4 |
76.4 |
93.2 |
97.7 |
100.7 |
104.7 |
118.0 |
131.5 |
136.6 |
3.9% |
4.6% |
|
Iraq |
2.5 |
2.1 |
1.4 |
0.9 |
1.3 |
1.3 |
1.3 |
1.7 |
1.0 |
1.2 |
1.7 |
42.0% |
0.1% |
|
Kuwait |
9.5 |
8.5 |
9.9 |
10.7 |
11.0 |
11.3 |
10.9 |
11.5 |
10.1 |
10.6 |
11.7 |
10.4% |
0.4% |
|
Oman |
12.6 |
13.5 |
14.9 |
16.7 |
17.8 |
21.3 |
21.6 |
21.7 |
22.3 |
24.4 |
23.9 |
-2.2% |
0.8% |
|
Qatar |
24.3 |
26.6 |
28.3 |
35.3 |
41.2 |
45.6 |
56.9 |
69.3 |
80.4 |
105.0 |
132.2 |
25.8% |
4.5% |
|
Saudi Arabia |
48.3 |
51.0 |
54.1 |
59.1 |
64.1 |
66.2 |
67.0 |
72.4 |
70.6 |
78.9 |
89.3 |
13.2% |
3.0% |
|
Syria |
4.5 |
5.5 |
5.6 |
5.8 |
4.9 |
5.1 |
5.0 |
4.8 |
5.0 |
6.9 |
7.5 |
8.7% |
0.3% |
|
United Arab Emirates |
40.4 |
39.1 |
40.3 |
41.7 |
43.0 |
44.1 |
45.3 |
45.2 |
43.9 |
46.2 |
46.6 |
0.9% |
1.6% |
|
Yemen |
– |
– |
– |
– |
– |
– |
– |
– |
0.7 |
5.6 |
8.5 |
51.3% |
0.3% |
|
Other Middle East |
0.2 |
0.2 |
0.2 |
1.4 |
1.7 |
2.4 |
2.7 |
3.3 |
2.8 |
3.1 |
4.0 |
31.0% |
0.1% |
|
Total Middle East |
210.0 |
222.5 |
236.6 |
256.6 |
287.9 |
305.2 |
322.1 |
345.9 |
366.3 |
425.1 |
473.5 |
11.4% |
16.0% |
|
Algeria |
70.4 |
72.3 |
74.5 |
73.8 |
79.4 |
76.0 |
76.3 |
77.2 |
71.6 |
72.4 |
70.2 |
-3.0% |
2.4% |
|
Egypt |
22.7 |
24.6 |
27.1 |
29.7 |
38.3 |
49.2 |
50.1 |
53.1 |
56.4 |
55.2 |
55.1 |
-0.1% |
1.9% |
|
Libya |
5.6 |
5.3 |
5.0 |
7.3 |
10.2 |
11.9 |
13.8 |
14.3 |
14.3 |
15.1 |
3.7 |
-75.6% |
0.1% |
|
Nigeria |
13.4 |
12.8 |
17.3 |
20.5 |
20.2 |
25.6 |
31.5 |
31.5 |
22.3 |
32.9 |
35.9 |
9.0% |
1.2% |
|
Other Africa |
6.2 |
6.0 |
6.5 |
8.0 |
8.9 |
9.4 |
11.1 |
14.2 |
14.7 |
16.6 |
17.5 |
5.4% |
0.6% |
|
Total Africa |
118.3 |
121.0 |
130.4 |
139.3 |
156.9 |
172.1 |
182.8 |
190.4 |
179.3 |
192.2 |
182.4 |
-5.1% |
6.2% |
|
Australia |
29.2 |
29.3 |
29.9 |
31.7 |
33.4 |
35.0 |
36.0 |
34.4 |
38.1 |
41.0 |
40.5 |
-1.3% |
1.4% |
|
Bangladesh |
9.7 |
10.3 |
11.1 |
11.5 |
12.4 |
13.4 |
14.3 |
15.3 |
16.6 |
17.9 |
17.9 |
-0.1% |
0.6% |
|
Brunei |
10.3 |
10.3 |
11.1 |
11.0 |
10.8 |
11.3 |
11.0 |
10.9 |
10.3 |
11.1 |
11.5 |
4.2% |
0.4% |
|
China |
27.3 |
29.4 |
31.5 |
37.3 |
44.4 |
52.7 |
62.3 |
72.3 |
76.7 |
85.4 |
92.3 |
8.1% |
3.1% |
|
India |
23.8 |
24.8 |
26.6 |
26.3 |
26.7 |
26.4 |
27.1 |
27.5 |
35.3 |
45.8 |
41.5 |
-9.3% |
1.4% |
|
Indonesia |
57.0 |
62.7 |
65.9 |
63.3 |
64.1 |
63.2 |
60.9 |
62.7 |
64.7 |
73.8 |
68.0 |
-7.8% |
2.3% |
|
Malaysia |
42.2 |
43.5 |
46.6 |
48.5 |
55.0 |
57.0 |
58.1 |
58.2 |
57.7 |
56.3 |
55.6 |
-1.3% |
1.9% |
|
Myanmar |
6.3 |
7.6 |
8.6 |
9.2 |
11.0 |
11.3 |
12.2 |
11.2 |
10.4 |
10.9 |
11.2 |
2.6% |
0.4% |
|
Pakistan |
20.4 |
22.1 |
27.4 |
31.0 |
32.0 |
32.5 |
33.1 |
33.8 |
34.6 |
35.7 |
35.2 |
-1.2% |
1.2% |
|
Thailand |
17.7 |
18.5 |
19.3 |
20.1 |
21.3 |
21.9 |
23.4 |
25.9 |
27.8 |
32.7 |
33.3 |
2.0% |
1.1% |
|
Vietnam |
1.8 |
2.2 |
2.1 |
3.7 |
5.8 |
6.3 |
6.4 |
6.7 |
7.2 |
8.5 |
7.7 |
-9.2% |
0.3% |
|
Other Asia Pacific |
8.5 |
9.8 |
9.6 |
9.1 |
10.0 |
13.2 |
15.7 |
16.5 |
16.7 |
16.3 |
16.4 |
1.0% |
0.6% |
|
Total Asia Pacific |
254.2 |
270.5 |
289.8 |
302.8 |
326.8 |
344.2 |
360.4 |
375.4 |
396.2 |
435.2 |
431.2 |
-0.9% |
14.6% |
|
Total World |
2237.8 |
2274.5 |
2362.9 |
2426.5 |
2501.0 |
2590.2 |
2654.0 |
2750.5 |
2667.4 |
2866.7 |
2954.8 |
3.1% |
100.0% |
|
of which: OECD |
995.7 |
985.8 |
992.2 |
991.2 |
978.3 |
990.1 |
999.4 |
1025.7 |
1016.8 |
1039.7 |
1057.5 |
1.7% |
35.8% |
|
Non-OECD |
1242.0 |
1288.6 |
1370.7 |
1435.3 |
1522.6 |
1600.1 |
1654.5 |
1724.8 |
1650.6 |
1827.0 |
1897.3 |
3.8% |
64.2% |
|
European Union |
209.6 |
204.9 |
201.2 |
204.6 |
190.8 |
181.2 |
168.7 |
170.5 |
154.4 |
157.4 |
139.5 |
-11.4% |
4.7% |
|
Former Soviet Union |
590.1 |
603.2 |
631.3 |
644.9 |
655.8 |
674.1 |
685.8 |
704.4 |
608.4 |
667.7 |
698.5 |
4.6% |
23.6% |
*Excluding gas flared or recycled. |
|
|
|
|
|
|
|
|
|
Source: Includes data from Cedigaz. |
||||
24

Consumption
|
|
|
|
|
|
|
|
|
|
|
|
|
Change |
2011 |
|
|
|
|
|
|
|
|
|
|
|
|
|
2011 over |
share of |
|
Million tonnes oil equivalent |
2001 |
2002 |
2003 |
2004 |
2005 |
2006 |
2007 |
2008 |
2009 |
2010 |
2011 |
2010 |
total |
|
US |
573.9 |
593.7 |
575.3 |
577.3 |
568.5 |
560.0 |
597.3 |
600.6 |
590.1 |
611.2 |
626.0 |
2.4% |
21.5% |
|
Canada |
79.4 |
81.2 |
87.9 |
85.6 |
88.0 |
87.3 |
86.6 |
86.5 |
85.4 |
85.5 |
94.3 |
10.3% |
3.2% |
|
Mexico |
37.6 |
41.0 |
45.4 |
50.2 |
50.5 |
54.8 |
56.9 |
59.5 |
59.6 |
61.1 |
62.0 |
1.5% |
2.1% |
|
Total North America |
690.9 |
715.8 |
708.6 |
713.0 |
707.0 |
702.1 |
740.8 |
746.6 |
735.1 |
757.9 |
782.4 |
3.2% |
26.9% |
|
Argentina |
28.0 |
27.2 |
31.1 |
34.1 |
36.4 |
37.6 |
39.5 |
40.0 |
38.8 |
39.0 |
41.9 |
7.5% |
1.4% |
|
Brazil |
10.7 |
12.7 |
14.2 |
16.9 |
17.7 |
18.7 |
19.0 |
22.2 |
17.8 |
24.1 |
24.0 |
-0.3% |
0.8% |
|
Chile |
6.6 |
6.6 |
7.2 |
7.8 |
7.5 |
7.0 |
4.1 |
2.4 |
2.8 |
4.2 |
4.7 |
11.7% |
0.2% |
|
Colombia |
5.5 |
5.5 |
5.4 |
5.7 |
6.0 |
6.3 |
6.7 |
6.8 |
7.8 |
8.2 |
8.1 |
-0.8% |
0.3% |
|
Ecuador |
0.3 |
0.2 |
0.2 |
0.3 |
0.3 |
0.7 |
0.5 |
0.4 |
0.4 |
0.4 |
0.4 |
– |
|
|
|
|||||||||||||
|
Peru |
0.3 |
0.4 |
0.5 |
0.8 |
1.4 |
1.6 |
2.4 |
3.1 |
3.1 |
4.9 |
5.6 |
15.2% |
0.2% |
|
Trinidad & Tobago |
10.5 |
11.4 |
13.0 |
12.0 |
13.6 |
18.2 |
18.2 |
19.7 |
18.8 |
20.3 |
19.8 |
-2.7% |
0.7% |
|
Venezuela |
26.6 |
25.6 |
22.7 |
25.6 |
24.7 |
28.3 |
26.6 |
28.3 |
27.5 |
29.2 |
29.8 |
2.3% |
1.0% |
|
Other S. & Cent. America |
2.1 |
2.2 |
2.8 |
2.6 |
2.9 |
3.5 |
4.0 |
4.3 |
4.5 |
4.9 |
4.7 |
-4.6% |
0.2% |
|
Total S. & Cent. America |
90.6 |
91.9 |
97.1 |
105.8 |
110.6 |
121.9 |
121.2 |
127.2 |
121.6 |
135.2 |
139.1 |
2.9% |
4.8% |
|
Austria |
7.7 |
7.7 |
8.5 |
8.5 |
9.0 |
8.5 |
8.0 |
8.6 |
8.4 |
9.1 |
8.5 |
-6.0% |
0.3% |
|
Azerbaijan |
6.8 |
6.8 |
7.0 |
7.5 |
7.7 |
8.2 |
7.2 |
8.2 |
7.0 |
6.7 |
7.3 |
9.6% |
0.3% |
|
Belarus |
14.1 |
14.5 |
14.3 |
16.1 |
16.5 |
17.1 |
17.0 |
17.3 |
14.5 |
17.7 |
16.5 |
-7.2% |
0.6% |
|
Belgium |
13.2 |
13.4 |
14.4 |
14.6 |
14.7 |
15.0 |
14.9 |
14.8 |
15.1 |
17.0 |
14.4 |
-14.8% |
0.5% |
|
Bulgaria |
2.7 |
2.4 |
2.5 |
2.5 |
2.8 |
2.9 |
2.9 |
2.9 |
2.1 |
2.3 |
2.6 |
14.5% |
0.1% |
|
Czech Republic |
8.0 |
7.8 |
7.8 |
8.2 |
8.6 |
8.4 |
7.8 |
7.8 |
7.4 |
8.4 |
7.6 |
-9.3% |
0.3% |
|
Denmark |
4.6 |
4.6 |
4.7 |
4.7 |
4.5 |
4.6 |
4.1 |
4.1 |
4.0 |
4.5 |
3.8 |
-16.2% |
0.1% |
|
Finland |
3.7 |
3.6 |
4.0 |
3.9 |
3.6 |
3.8 |
3.5 |
3.6 |
3.2 |
3.6 |
3.2 |
-10.0% |
0.1% |
|
France |
37.7 |
36.5 |
38.7 |
40.5 |
39.6 |
37.9 |
38.2 |
39.4 |
38.0 |
42.2 |
36.3 |
-13.9% |
1.2% |
|
Germany |
74.6 |
74.3 |
77.0 |
77.3 |
77.6 |
78.5 |
74.6 |
73.1 |
70.2 |
75.0 |
65.3 |
-12.9% |
2.2% |
|
Greece |
1.8 |
1.9 |
2.2 |
2.4 |
2.4 |
2.8 |
3.4 |
3.6 |
3.0 |
3.3 |
4.1 |
24.3% |
0.1% |
|
Hungary |
10.7 |
10.6 |
11.9 |
11.7 |
12.1 |
11.5 |
10.7 |
10.6 |
9.1 |
9.8 |
9.1 |
-6.8% |
0.3% |
|
Republic of Ireland |
3.6 |
3.7 |
3.7 |
3.7 |
3.5 |
4.0 |
4.3 |
4.5 |
4.3 |
4.7 |
4.2 |
-10.5% |
0.1% |
|
Italy |
58.5 |
58.1 |
64.1 |
66.5 |
71.2 |
69.7 |
70.0 |
70.0 |
64.4 |
68.5 |
64.2 |
-6.2% |
2.2% |
|
Kazakhstan |
7.3 |
7.8 |
8.6 |
6.7 |
8.4 |
8.9 |
7.5 |
7.3 |
7.0 |
7.4 |
8.3 |
13.0% |
0.3% |
|
Lithuania |
2.5 |
2.6 |
2.8 |
2.8 |
2.9 |
2.9 |
3.3 |
2.9 |
2.5 |
2.8 |
3.1 |
9.0% |
0.1% |
|
Netherlands |
36.0 |
35.8 |
36.0 |
36.8 |
35.4 |
34.3 |
33.3 |
34.7 |
35.0 |
39.2 |
34.3 |
-12.7% |
1.2% |
|
Norway |
3.4 |
3.6 |
3.9 |
4.1 |
4.0 |
4.0 |
3.8 |
3.9 |
3.7 |
3.7 |
3.6 |
-2.1% |
0.1% |
|
Poland |
10.4 |
10.1 |
11.3 |
11.9 |
12.2 |
12.4 |
12.4 |
13.5 |
13.0 |
14.0 |
13.8 |
-1.0% |
0.5% |
|
Portugal |
2.3 |
2.8 |
2.7 |
3.4 |
3.8 |
3.7 |
3.9 |
4.2 |
4.2 |
4.5 |
4.6 |
1.8% |
0.2% |
|
Romania |
14.9 |
15.5 |
16.5 |
15.7 |
15.8 |
16.3 |
14.5 |
14.3 |
11.9 |
12.2 |
12.5 |
2.0% |
0.4% |
|
Russian Federation |
329.6 |
330.9 |
346.4 |
354.7 |
360.2 |
367.7 |
379.9 |
374.4 |
350.7 |
372.7 |
382.1 |
2.5% |
13.2% |
|
Slovakia |
6.2 |
5.8 |
5.7 |
5.5 |
5.9 |
5.4 |
5.1 |
5.2 |
4.4 |
5.0 |
5.6 |
12.3% |
0.2% |
|
Spain |
16.4 |
18.8 |
21.3 |
24.7 |
29.1 |
30.3 |
31.6 |
34.8 |
31.1 |
31.2 |
28.9 |
-7.2% |
1.0% |
|
Sweden |
0.6 |
0.7 |
0.7 |
0.7 |
0.7 |
0.8 |
0.9 |
0.8 |
1.0 |
1.4 |
1.1 |
-19.1% |
|
|
|
|||||||||||||
|
Switzerland |
2.5 |
2.5 |
2.6 |
2.7 |
2.8 |
2.7 |
2.6 |
2.8 |
2.7 |
3.0 |
2.6 |
-12.8% |
0.1% |
|
Turkey |
14.4 |
15.6 |
18.8 |
19.9 |
24.2 |
27.4 |
32.5 |
33.8 |
32.1 |
35.1 |
41.2 |
17.3% |
1.4% |
|
Turkmenistan |
11.2 |
11.6 |
12.8 |
13.5 |
14.5 |
16.5 |
19.1 |
18.5 |
17.9 |
20.4 |
22.5 |
10.4% |
0.8% |
|
Ukraine |
61.9 |
60.9 |
62.1 |
61.7 |
62.1 |
60.3 |
56.9 |
54.0 |
42.3 |
46.9 |
48.3 |
3.0% |
1.7% |
|
United Kingdom |
86.7 |
85.6 |
85.8 |
87.7 |
85.5 |
81.1 |
81.9 |
84.5 |
78.0 |
84.6 |
72.2 |
-14.6% |
2.5% |
|
Uzbekistan |
44.6 |
45.8 |
41.2 |
39.1 |
38.4 |
37.7 |
41.3 |
43.8 |
39.2 |
41.0 |
44.2 |
7.9% |
1.5% |
|
Other Europe & Eurasia |
13.8 |
13.3 |
13.8 |
15.3 |
15.4 |
16.0 |
16.4 |
15.6 |
13.4 |
14.5 |
14.9 |
2.7% |
0.5% |
|
Total Europe & Eurasia |
912.8 |
915.7 |
953.7 |
974.9 |
995.3 |
1001.0 |
1013.6 |
1017.6 |
940.9 |
1012.2 |
991.0 |
-2.1% |
34.1% |
|
Iran |
63.1 |
71.3 |
74.6 |
77.9 |
94.5 |
97.8 |
101.7 |
107.4 |
118.2 |
130.1 |
138.0 |
6.1% |
4.7% |
|
Israel |
† |
† |
† |
1.1 |
1.5 |
2.1 |
2.5 |
3.7 |
4.1 |
4.8 |
4.5 |
-6.0% |
0.2% |
|
Kuwait |
9.5 |
8.5 |
9.9 |
10.7 |
11.0 |
11.3 |
10.9 |
11.5 |
10.9 |
13.1 |
14.6 |
11.5% |
0.5% |
|
Qatar |
9.9 |
10.0 |
11.0 |
13.5 |
16.8 |
17.6 |
17.4 |
17.4 |
18.0 |
18.4 |
21.4 |
16.4% |
0.7% |
|
Saudi Arabia |
48.3 |
51.0 |
54.1 |
59.1 |
64.1 |
66.2 |
67.0 |
72.4 |
70.6 |
78.9 |
89.3 |
13.2% |
3.1% |
|
United Arab Emirates |
34.1 |
32.8 |
34.1 |
36.2 |
37.8 |
39.0 |
44.3 |
53.5 |
53.2 |
54.7 |
56.6 |
3.5% |
1.9% |
|
Other Middle East |
21.3 |
22.2 |
22.5 |
23.9 |
25.5 |
28.3 |
29.1 |
32.8 |
34.7 |
39.6 |
38.4 |
-3.0% |
1.3% |
|
Total Middle East |
186.1 |
195.8 |
206.1 |
222.4 |
251.3 |
262.3 |
272.8 |
298.7 |
309.7 |
339.5 |
362.8 |
6.9% |
12.5% |
|
Algeria |
18.5 |
18.2 |
19.3 |
19.8 |
20.9 |
21.4 |
21.9 |
22.8 |
24.5 |
23.7 |
25.2 |
6.5% |
0.9% |
|
Egypt |
22.1 |
23.9 |
26.7 |
28.5 |
28.4 |
32.9 |
34.5 |
36.8 |
38.3 |
40.6 |
44.7 |
10.0% |
1.5% |
|
South Africa |
1.1 |
0.9 |
0.9 |
1.9 |
2.8 |
3.1 |
3.1 |
3.4 |
3.0 |
3.5 |
3.8 |
8.9% |
0.1% |
|
Other Africa |
15.9 |
16.2 |
18.4 |
21.4 |
22.5 |
22.0 |
25.4 |
27.2 |
23.2 |
28.4 |
25.1 |
-11.6% |
0.9% |
|
Total Africa |
57.4 |
59.2 |
65.3 |
71.7 |
74.7 |
79.3 |
85.0 |
90.1 |
89.0 |
96.2 |
98.8 |
2.7% |
3.4% |
|
Australia |
19.8 |
20.2 |
20.2 |
20.5 |
19.9 |
22.0 |
23.9 |
23.0 |
22.7 |
23.1 |
23.0 |
-0.4% |
0.8% |
|
Bangladesh |
9.7 |
10.3 |
11.1 |
11.5 |
12.4 |
13.4 |
14.3 |
15.3 |
16.6 |
17.9 |
17.9 |
-0.1% |
0.6% |
|
China |
24.7 |
26.3 |
30.5 |
35.7 |
42.1 |
50.5 |
63.5 |
73.2 |
80.6 |
96.8 |
117.6 |
21.5% |
4.0% |
|
China Hong Kong SAR |
2.7 |
2.6 |
1.7 |
2.4 |
2.4 |
2.6 |
2.5 |
2.9 |
2.8 |
3.4 |
2.7 |
-20.4% |
0.1% |
|
India |
23.8 |
24.8 |
26.6 |
28.7 |
32.1 |
33.5 |
36.1 |
37.2 |
45.9 |
55.7 |
55.0 |
-1.2% |
1.9% |
|
Indonesia |
27.9 |
29.6 |
31.5 |
29.0 |
29.9 |
29.9 |
28.2 |
30.0 |
33.6 |
36.3 |
34.1 |
-5.9% |
1.2% |
|
Japan |
66.8 |
65.4 |
71.8 |
69.3 |
70.7 |
75.4 |
81.2 |
84.4 |
78.7 |
85.1 |
95.0 |
11.6% |
3.3% |
|
Malaysia |
22.7 |
23.6 |
24.6 |
22.2 |
28.3 |
30.4 |
30.1 |
30.4 |
30.3 |
28.7 |
25.7 |
-10.5% |
0.9% |
|
New Zealand |
5.3 |
5.1 |
3.9 |
3.5 |
3.2 |
3.3 |
3.6 |
3.4 |
3.6 |
3.9 |
3.5 |
-10.0% |
0.1% |
|
Pakistan |
20.4 |
22.1 |
27.4 |
31.0 |
32.0 |
32.5 |
33.1 |
33.8 |
34.6 |
35.7 |
35.2 |
-1.2% |
1.2% |
|
Philippines |
0.1 |
1.6 |
2.4 |
2.2 |
3.0 |
2.4 |
2.8 |
3.0 |
3.0 |
2.8 |
3.2 |
16.0% |
0.1% |
|
Singapore |
0.8 |
3.2 |
3.6 |
4.5 |
6.2 |
6.3 |
7.8 |
7.4 |
7.3 |
7.6 |
7.9 |
4.4% |
0.3% |
|
South Korea |
18.7 |
20.8 |
21.8 |
25.5 |
27.3 |
28.8 |
31.2 |
32.1 |
30.5 |
38.7 |
41.9 |
8.3% |
1.4% |
|
Taiwan |
6.6 |
7.4 |
7.6 |
9.2 |
9.3 |
10.0 |
10.6 |
10.5 |
10.2 |
12.7 |
14.0 |
10.1% |
0.5% |
|
Thailand |
22.3 |
24.2 |
25.7 |
26.9 |
29.3 |
30.0 |
31.8 |
33.6 |
35.3 |
40.6 |
41.9 |
3.3% |
1.4% |
|
Vietnam |
1.8 |
2.2 |
2.1 |
3.7 |
5.8 |
6.3 |
6.4 |
6.7 |
7.2 |
8.5 |
7.7 |
-9.2% |
0.3% |
|
Other Asia Pacific |
3.4 |
3.3 |
3.8 |
4.1 |
4.7 |
4.9 |
5.4 |
5.1 |
4.6 |
4.8 |
5.2 |
7.3% |
0.2% |
|
Total Asia Pacific |
277.6 |
292.5 |
316.2 |
330.0 |
358.6 |
382.3 |
412.4 |
431.8 |
447.4 |
502.1 |
531.5 |
5.9% |
18.3% |
|
Total World |
2215.4 |
2271.0 |
2347.0 |
2417.8 |
2497.5 |
2548.9 |
2645.8 |
2712.0 |
2643.7 |
2843.1 |
2905.6 |
2.2% |
100.0% |
|
of which: OECD |
1213.8 |
1240.2 |
1262.0 |
1283.0 |
1290.6 |
1290.2 |
1338.0 |
1356.7 |
1312.4 |
1387.9 |
1386.1 |
-0.1% |
47.7% |
|
Non-OECD |
1001.6 |
1030.8 |
1085.0 |
1134.8 |
1207.0 |
1258.7 |
1307.8 |
1355.3 |
1331.3 |
1455.2 |
1519.5 |
4.4% |
52.3% |
|
European Union |
406.7 |
406.4 |
426.3 |
438.0 |
445.3 |
439.0 |
433.8 |
442.1 |
414.1 |
447.2 |
403.1 |
-9.9% |
13.9% |
|
Former Soviet Union |
485.6 |
487.5 |
502.1 |
509.8 |
519.2 |
527.9 |
540.9 |
534.5 |
487.9 |
522.6 |
539.6 |
3.3% |
18.6% |
†Less than 0.05. |
|
|
|
|
|
|
|
|
|
Source: Includes data from Cedigaz. |
||||
Less than 0.05%.
Notes: The difference between these world consumption figures and the world production statistics is due to variations in stocks at storage facilities and liquefaction plants, together with unavoidable disparities in the definition, measurement or conversion of gas supply and demand data.
25
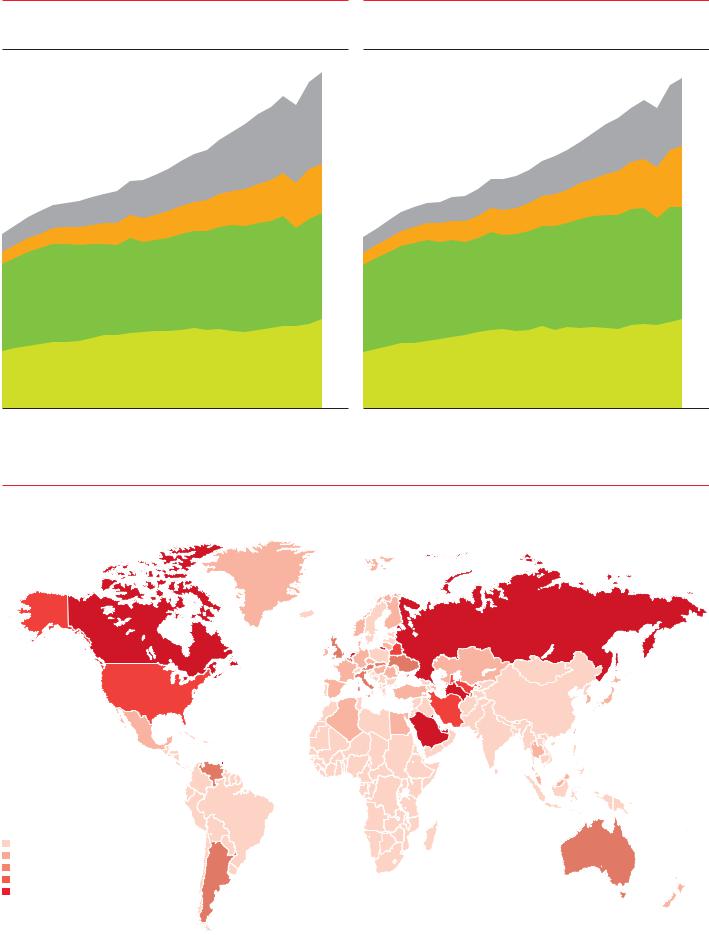
Production by region
Billion cubic metres
|
Rest of World |
3500 |
|
||
|
Asia Pacific |
|
|
|
|
|
|
|
|
Europe & Eurasia |
|
|
|
|
|
North America |
|
|
|
|
|
|
|
|
|
3000 |
|
|
|
|
|
2500 |
|
|
|
|
|
2000 |
|
|
|
|
|
1500 |
|
|
|
|
|
1000 |
|
|
|
|
|
500 |
Consumption by region
Billion cubic metres
|
Rest of World |
3500 |
|
||
|
Asia Pacific |
|
|
|
|
|
|
|
|
Europe & Eurasia |
|
|
|
|
|
North America |
|
|
|
|
|
|
|
|
|
3000 |
|
|
|
|
|
2500 |
|
|
|
|
|
2000 |
|
|
|
|
|
1500 |
|
|
|
|
|
1000 |
|
|
|
|
|
500 |
86 |
91 |
96 |
01 |
06 |
11 |
0 |
86 |
91 |
96 |
01 |
06 |
11 |
0 |
World natural gas production increased by 3.1% in 2011. While the US saw the largest national increase, the Middle East recorded the largest regional increment to production. Production growth in Russia and Turkmenistan was partly offset by a large decline in European production. Natural gas consumption increased by 2.2%, with below-average growth in all regions but North America. The European Union experienced the sharpest decline in natural gas consumption (–9.9%) on record.
Consumption per capita 2011
Tonnes oil equivalent
0-0.5
0.5-1.0
1.0-1.5
1.5-2.0 > 2.0
Source: Includes data from Cedigaz.
26
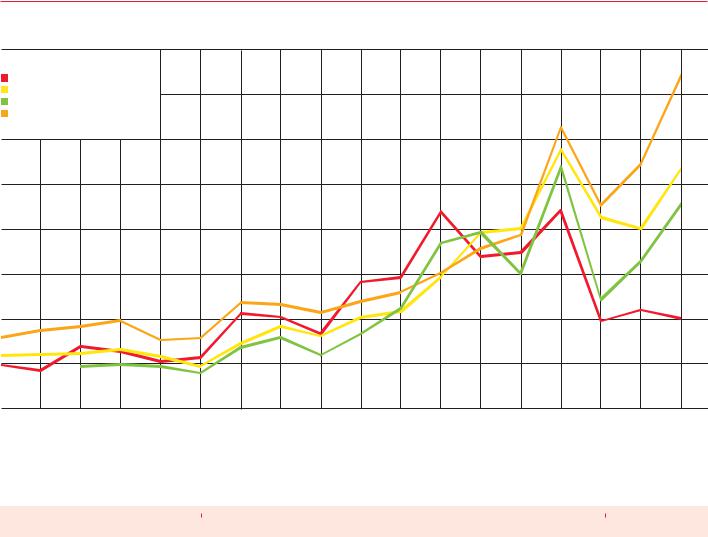
Prices |
|
|
|
|
|
|
|
|
|
|
|
|
|
|
|
|
|
|
$/Mmbtu |
|
|
|
|
|
|
|
|
|
|
|
|
|
|
|
|
|
|
|
|
|
|
|
|
|
|
|
|
|
|
|
|
|
|
|
|
16 |
|
US Henry Hub |
|
|
|
|
|
|
|
|
|
|
|
|
|
|
|
|
|
|
Average German Import Price cif |
|
|
|
|
|
|
|
|
|
|
|
|
|
|
|
||
|
UK NBP |
|
|
|
|
|
|
|
|
|
|
|
|
|
|
|
|
14 |
|
Japan LNG cif |
|
|
|
|
|
|
|
|
|
|
|
|
|
|
|
|
|
|
|
|
|
|
|
|
|
|
|
|
|
|
|
|
|
|
|
12 |
|
|
|
|
|
|
|
|
|
|
|
|
|
|
|
|
|
|
10 |
|
|
|
|
|
|
|
|
|
|
|
|
|
|
|
|
|
|
8 |
|
|
|
|
|
|
|
|
|
|
|
|
|
|
|
|
|
|
6 |
|
|
|
|
|
|
|
|
|
|
|
|
|
|
|
|
|
|
4 |
|
|
|
|
|
|
|
|
|
|
|
|
|
|
|
|
|
|
2 |
94 |
95 |
96 |
97 |
98 |
99 |
00 |
01 |
02 |
03 |
04 |
05 |
06 |
07 |
08 |
09 |
10 |
11 |
0 |
Prices
|
LNG |
|
|
Natural gas |
|
|
|
Crude oil |
|
|
|
|
|
|
|||
|
Japan |
Average German |
|
UK |
US |
Canada |
OECD |
|
US dollars per million Btu |
cif |
Import Price* |
(Heren NBP Index)† |
Henry Hub‡ |
(Alberta)‡ |
countries cif |
||
1984 |
5.10 |
4.00 |
|
– |
– |
– |
5.00 |
|
1985 |
5.23 |
4.25 |
|
– |
– |
– |
4.75 |
|
1986 |
4.10 |
3.93 |
|
– |
– |
– |
2.57 |
|
1987 |
3.35 |
2.55 |
|
– |
– |
– |
3.09 |
|
1988 |
3.34 |
2.22 |
|
– |
– |
– |
2.56 |
|
1989 |
3.28 |
2.00 |
|
– |
1.70 |
– |
3.01 |
|
1990 |
3.64 |
2.78 |
|
– |
1.64 |
1.05 |
|
3.82 |
1991 |
3.99 |
3.19 |
|
– |
1.49 |
0.89 |
|
3.33 |
1992 |
3.62 |
2.69 |
|
– |
1.77 |
0.98 |
|
3.19 |
1993 |
3.52 |
2.50 |
|
– |
2.12 |
1.69 |
|
2.82 |
1994 |
3.18 |
2.35 |
|
– |
1.92 |
1.45 |
|
2.70 |
1995 |
3.46 |
2.39 |
|
– |
1.69 |
0.89 |
|
2.96 |
1996 |
3.66 |
2.46 |
1.87 |
2.76 |
1.12 |
|
3.54 |
|
1997 |
3.91 |
2.64 |
1.96 |
2.53 |
1.36 |
|
3.29 |
|
1998 |
3.05 |
2.32 |
1.86 |
2.08 |
1.42 |
|
2.16 |
|
1999 |
3.14 |
1.88 |
1.58 |
2.27 |
2.00 |
|
2.98 |
|
2000 |
4.72 |
2.89 |
2.71 |
4.23 |
3.75 |
|
4.83 |
|
2001 |
4.64 |
3.66 |
3.17 |
4.07 |
3.61 |
|
4.08 |
|
2002 |
4.27 |
3.23 |
2.37 |
3.33 |
2.57 |
|
4.17 |
|
2003 |
4.77 |
4.06 |
3.33 |
5.63 |
4.83 |
|
4.89 |
|
2004 |
5.18 |
4.32 |
4.46 |
5.85 |
5.03 |
|
6.27 |
|
2005 |
6.05 |
5.88 |
7.38 |
8.79 |
7.25 |
|
8.74 |
|
2006 |
7.14 |
7.85 |
7.87 |
6.76 |
5.83 |
|
10.66 |
|
2007 |
7.73 |
8.03 |
6.01 |
6.95 |
6.17 |
|
11.95 |
|
2008 |
12.55 |
11.56 |
10.79 |
8.85 |
7.99 |
|
16.76 |
|
2009 |
9.06 |
8.52 |
4.85 |
3.89 |
3.38 |
|
10.41 |
|
2010 |
10.91 |
8.01 |
6.56 |
4.39 |
3.69 |
|
13.47 |
|
2011 |
14.73 |
10.61 |
9.03 |
4.01 |
3.47 |
|
18.56 |
|
*Source: 1984-1990 German Federal Statistical Office, 1991-2011 German Federal Office of Economics and Export Control (BAFA). †Source: Heren Energy Ltd.
‡Source: Energy Intelligence Group, Natural Gas Week. Note: cif = cost+insurance+freight (average prices).
27

Trade movements 2011 by pipeline
Billion cubic metres
To |
US |
Canada |
US |
– |
88.0 |
Canada |
26.6 |
– |
Mexico |
14.1 |
– |
North America |
40.7 |
88.0 |
Argentina |
– |
– |
Brazil |
– |
– |
Other S. & Cent. America |
– |
– |
S. & Cent. America |
– |
– |
Austria |
– |
– |
Belgium |
– |
– |
Czech Republic |
– |
– |
Finland |
– |
– |
France |
– |
– |
Germany |
– |
– |
Greece |
– |
– |
Hungary |
– |
– |
Ireland |
– |
– |
Italy |
– |
– |
Netherlands |
– |
– |
Poland |
– |
– |
Slovakia |
– |
– |
Spain |
– |
– |
Turkey |
– |
– |
United Kingdom |
– |
– |
Other Europe |
– |
– |
Europe |
– |
– |
Belarus |
– |
– |
Russian Federation |
– |
– |
Ukraine |
– |
– |
Other Former Soviet |
– |
– |
Union |
|
|
Former Soviet Union |
– |
– |
Iran |
– |
– |
United Arab Emirates |
– |
– |
Other Middle East |
– |
– |
Middle East |
– |
– |
South Africa |
– |
– |
Other Africa |
– |
– |
Africa |
– |
– |
Australia |
– |
– |
China |
– |
– |
Hong Kong |
– |
– |
Malaysia |
– |
– |
Singapore |
– |
– |
Thailand |
– |
– |
Asia Pacific |
– |
– |
Total exports |
40.7 |
88.0 |
|
|
|
|
|
|
|
|
|
|
|
|
|
From |
|
|
|
|
|
|
|
|
|
|
|
|
|
|
|
|
|
|
|
|
|
|
|
|
|
Cent |
. |
|
|
Kingdom |
|
|
|
|
|
|
|
|
|
|
|
|
|
|
|
|
|
|
|
Pacific |
|
|
|
|
|
|
|
|
|
|
|
|
|
|
|
|
|
|
|
|
|
|
|
|
|
|
|
|
|
|
|
|
|
||
Mexico |
Bolivia |
Other |
S |
America |
Netherlands |
Norway |
United |
Europe |
Kazakhstan |
|
Russian Federation |
Turkmenistan |
Other |
Former |
Union |
Qatar |
Algeria |
Libya |
Other |
Africa |
Indonesia |
Myanmar |
Other |
Asia |
imports |
|||||||
|
Other |
|
|
Soviet |
Iran |
|
Total |
|||||||||||||||||||||||||
|
|
|
|
|
& |
|
|
|
|
|
|
|
|
|
|
|
|
|
|
|
|
|
|
|
|
|
|
|
|
|
|
|
|
|
|
|
. |
|
|
|
|
|
|
|
|
|
|
|
|
|
|
|
|
|
|
|
|
|
|
|
|
|
|
|
|
0.1 |
|
– |
– |
|
|
– |
– |
– |
– |
|
– |
– |
|
|
– |
– |
|
|
– |
– |
|
– |
– |
– |
|
– |
– |
– |
|
88.1 |
||
|
|
|
|
|
|
|
|
|
|
|
||||||||||||||||||||||
– |
|
– |
– |
|
|
– |
– |
– |
– |
|
– |
– |
|
|
– |
– |
|
|
– |
– |
|
– |
– |
– |
|
– |
– |
– |
|
26.6 |
||
– |
|
– |
– |
|
|
– |
– |
– |
– |
|
– |
– |
|
|
– |
– |
|
|
– |
– |
|
– |
– |
– |
|
– |
– |
– |
|
14.1 |
||
0.1 |
|
– |
– |
|
|
– |
– |
– |
– |
|
– |
– |
|
|
– |
– |
|
|
– |
– |
|
– |
– |
– |
|
– |
– |
– |
128.8 |
|||
– |
|
3.6 |
– |
|
|
– |
– |
– |
– |
|
– |
– |
|
|
– |
– |
|
|
– |
– |
|
– |
– |
– |
|
– |
– |
– |
|
3.6 |
||
– |
|
9.7 |
– |
|
|
– |
– |
– |
– |
|
– |
– |
|
|
– |
– |
|
|
– |
– |
|
– |
– |
– |
|
– |
– |
– |
|
9.7 |
||
– |
|
– |
2.3 |
|
|
– |
– |
– |
– |
|
– |
– |
|
|
– |
– |
|
|
– |
– |
|
– |
– |
– |
|
– |
– |
– |
|
2.3 |
||
– |
|
13.3 |
2.3 |
|
|
– |
– |
– |
– |
|
– |
– |
|
|
– |
– |
|
|
– |
– |
|
– |
– |
– |
|
– |
– |
– |
|
15.6 |
||
– |
|
– |
– |
|
|
– |
2.5 |
– |
2.2 |
|
– |
4.9 |
|
|
– |
– |
|
|
– |
– |
|
– |
– |
– |
|
– |
– |
– |
|
9.6 |
||
– |
|
– |
– |
|
|
4.3 |
5.9 |
5.3 |
– |
|
– |
7.4 |
|
|
– |
– |
|
|
– |
– |
|
– |
– |
– |
|
– |
– |
– |
|
22.7 |
||
– |
|
– |
– |
|
|
– |
3.9 |
– |
1.3 |
|
– |
6.9 |
|
|
– |
– |
|
|
– |
– |
|
– |
– |
– |
|
– |
– |
– |
|
12.0 |
||
– |
|
– |
– |
|
|
– |
– |
– |
– |
|
– |
3.8 |
|
|
– |
– |
|
|
– |
– |
|
– |
– |
– |
|
– |
– |
– |
|
3.8 |
||
– |
|
– |
– |
|
|
7.9 |
14.7 |
1.0 |
0.2 |
|
– |
8.6 |
|
|
– |
– |
|
|
– |
– |
|
– |
– |
– |
|
– |
– |
– |
|
32.3 |
||
– |
|
– |
– |
|
|
23.7 |
28.4 |
– |
1.2 |
|
– |
30.8 |
|
|
– |
– |
|
|
– |
– |
|
– |
– |
– |
|
– |
– |
– |
|
84.0 |
||
– |
|
– |
– |
|
|
– |
– |
– |
0.7 |
|
– |
2.6 |
|
|
– |
– |
|
|
– |
– |
|
– |
– |
– |
|
– |
– |
– |
|
3.3 |
||
– |
|
– |
– |
|
|
– |
– |
– |
1.0 |
|
– |
5.7 |
|
|
– |
– |
|
|
– |
– |
|
– |
– |
– |
|
– |
– |
– |
|
6.7 |
||
– |
|
– |
– |
|
|
– |
– |
5.4 |
– |
|
– |
– |
|
|
– |
– |
|
|
– |
– |
|
– |
– |
– |
|
– |
– |
– |
|
5.4 |
||
– |
|
– |
– |
|
|
7.7 |
5.9 |
3.0 |
5.2 |
|
– |
15.4 |
|
|
– |
– |
|
|
– |
– |
|
21.3 |
2.3 |
– |
|
– |
– |
– |
|
60.8 |
||
– |
|
– |
– |
|
|
– |
7.4 |
1.6 |
0.7 |
|
– |
4.0 |
|
|
– |
– |
|
|
– |
– |
|
– |
– |
– |
|
– |
– |
– |
|
13.6 |
||
– |
|
– |
– |
|
|
– |
– |
– |
1.6 |
|
– |
9.3 |
|
|
– |
– |
|
|
– |
– |
|
– |
– |
– |
|
– |
– |
– |
|
10.8 |
||
– |
|
– |
– |
|
|
– |
– |
– |
– |
|
– |
5.3 |
|
|
– |
– |
|
|
– |
– |
|
– |
– |
– |
|
– |
– |
– |
|
5.3 |
||
– |
|
– |
– |
|
|
– |
2.5 |
– |
0.7 |
|
– |
– |
|
|
– |
– |
|
|
– |
– |
|
9.4 |
– |
– |
|
– |
– |
– |
|
12.5 |
||
– |
|
– |
– |
|
|
– |
– |
– |
– |
|
– |
23.5 |
|
|
– |
3.8 |
|
|
8.4 |
– |
|
– |
– |
– |
|
– |
– |
– |
|
35.6 |
||
– |
|
– |
– |
|
|
6.4 |
21.7 |
– |
– |
|
– |
– |
|
|
– |
– |
|
|
– |
– |
|
– |
– |
– |
|
– |
– |
– |
|
28.1 |
||
– |
|
– |
– |
|
|
0.6 |
0.1 |
– |
6.8 |
|
– |
12.5 |
|
|
– |
– |
|
|
– |
– |
|
2.2 |
– |
– |
|
– |
– |
– |
|
22.0 |
||
– |
|
– |
– |
|
|
50.4 |
92.8 |
16.3 |
21.4 |
|
– |
140.6 |
|
|
– |
3.8 |
|
|
8.4 |
– |
|
32.8 |
2.3 |
– |
|
– |
– |
– |
368.7 |
|||
– |
|
– |
– |
|
|
– |
– |
– |
– |
|
– |
18.1 |
|
|
– |
– |
|
|
– |
– |
|
– |
– |
– |
|
– |
– |
– |
|
18.1 |
||
– |
|
– |
– |
|
|
– |
– |
– |
– |
|
11.4 |
– |
10.1 |
8.5 |
|
|
– |
– |
|
– |
– |
– |
|
– |
– |
– |
|
30.1 |
||||
– |
|
– |
– |
|
|
– |
– |
– |
– |
|
– |
40.5 |
|
|
– |
– |
|
|
– |
– |
|
– |
– |
– |
|
– |
– |
– |
|
40.5 |
||
– |
|
– |
– |
|
|
– |
– |
– |
– |
|
0.1 |
7.8 |
|
|
– |
3.7 |
|
|
0.7 |
– |
|
– |
– |
– |
|
– |
– |
– |
|
12.3 |
||
– |
|
– |
– |
|
|
– |
– |
– |
– |
|
11.5 |
66.4 |
10.1 |
12.2 |
|
|
0.7 |
– |
|
– |
– |
– |
|
– |
– |
– |
101.0 |
|||||
– |
|
– |
– |
|
|
– |
– |
– |
– |
|
– |
– |
10.2 |
0.4 |
|
|
– |
– |
|
– |
– |
– |
|
– |
– |
– |
|
10.6 |
||||
– |
|
– |
– |
|
|
– |
– |
– |
– |
|
– |
– |
|
|
– |
– |
|
|
– |
17.3 |
|
– |
– |
– |
|
– |
– |
– |
|
17.3 |
||
– |
|
– |
– |
|
|
– |
– |
– |
– |
|
– |
– |
|
|
– |
– |
|
|
– |
2.0 |
|
– |
– |
1.8 |
|
– |
– |
– |
|
3.8 |
||
– |
|
– |
– |
|
|
– |
– |
– |
– |
|
– |
– |
10.2 |
0.4 |
|
|
– |
19.2 |
|
– |
– |
1.8 |
|
– |
– |
– |
|
31.6 |
||||
– |
|
– |
– |
|
|
– |
– |
– |
– |
|
– |
– |
|
|
– |
– |
|
|
– |
– |
|
– |
– |
3.3 |
|
– |
– |
– |
|
3.3 |
||
– |
|
– |
– |
|
|
– |
– |
– |
– |
|
– |
– |
|
|
– |
– |
|
|
– |
– |
|
1.5 |
– |
0.8 |
|
– |
– |
– |
|
2.4 |
||
– |
|
– |
– |
|
|
– |
– |
– |
– |
|
– |
– |
|
|
– |
– |
|
|
– |
– |
|
1.5 |
– |
4.1 |
|
– |
– |
– |
|
5.7 |
||
– |
|
– |
– |
|
|
– |
– |
– |
– |
|
– |
– |
|
|
– |
– |
|
|
– |
– |
|
– |
– |
– |
|
– |
– |
6.3 |
|
6.3 |
||
– |
|
– |
– |
|
|
– |
– |
– |
– |
|
– |
– |
14.3 |
– |
|
|
– |
– |
|
– |
– |
– |
|
– |
– |
– |
|
14.3 |
||||
– |
|
– |
– |
|
|
– |
– |
– |
– |
|
– |
– |
|
|
– |
– |
|
|
– |
– |
|
– |
– |
– |
|
– |
– |
3.1 |
|
3.1 |
||
– |
|
– |
– |
|
|
– |
– |
– |
– |
|
– |
– |
|
|
– |
– |
|
|
– |
– |
|
– |
– |
– |
|
2.0 |
– |
– |
|
2.0 |
||
– |
|
– |
– |
|
|
– |
– |
– |
– |
|
– |
– |
|
|
– |
– |
|
|
– |
– |
|
– |
– |
– |
|
6.7 |
– |
2.3 |
|
9.1 |
||
– |
|
– |
– |
|
|
– |
– |
– |
– |
|
– |
– |
|
|
– |
– |
|
|
– |
– |
|
– |
– |
– |
|
– |
8.6 |
– |
|
8.6 |
||
– |
|
– |
– |
|
|
– |
– |
– |
– |
|
– |
– |
14.3 |
– |
|
|
– |
– |
|
– |
– |
– |
|
8.7 |
8.6 |
11.7 |
|
43.2 |
||||
0.1 |
|
13.3 |
2.3 |
|
|
50.4 |
92.8 |
16.3 |
21.4 |
|
11.5 |
207.0 |
34.6 |
16.4 |
|
|
9.1 |
19.2 |
|
34.4 |
2.3 |
5.9 |
|
8.7 |
8.6 |
11.7 |
694.6 |
|||||
Source: Cedigaz for all flows, except intra-CIS trade; CISStat.
Trade movements 2011 – liquefied natural gas
Billion cubic metres
To |
US* |
Trinidad& |
Tobago |
|
|||
US |
– |
3.8 |
|
Canada |
– |
1.2 |
|
Mexico |
– |
– |
|
North America |
– |
4.9 |
|
Argentina |
– |
3.0 |
|
Chile |
0.1 |
1.3 |
|
Other S. & Cent. America |
0.3 |
1.8 |
|
S. & Cent. America |
0.4 |
6.1 |
|
Belgium |
– |
0.1 |
|
France |
– |
0.4 |
|
Italy |
– |
0.2 |
|
Spain |
0.2 |
2.5 |
|
Turkey |
– |
– |
|
United Kingdom |
0.1 |
0.6 |
|
Other Europe & Eurasia |
– |
0.1 |
|
Europe & Eurasia |
0.3 |
3.9 |
|
Middle East |
– |
0.3 |
|
China |
0.2 |
0.5 |
|
India |
0.4 |
0.6 |
|
Japan |
0.5 |
0.4 |
|
South Korea |
0.2 |
2.2 |
|
Taiwan |
– |
0.1 |
|
Thailand |
– |
– |
|
Asia Pacific |
1.3 |
3.7 |
|
Total exports |
2.0 |
18.9 |
|
|
|
|
|
From
|
Belgium* |
Norway |
|
Russian Federation |
|
|
Arab |
|
|
|
EquatorialGuinea |
|
|
Australia |
|
Indonesia |
Malaysia |
|
imports |
||
Peru |
Spain* |
Oman |
Qatar |
United Emirates |
Yemen |
Algeria |
Egypt |
Libya |
Nigeria |
Brunei |
Total |
||||||||||
0.5 |
– |
0.4 |
– |
– |
|
– |
2.6 |
– |
1.7 |
– |
1.0 |
– |
– |
0.1 |
– |
– |
– |
– |
|
|
10.0 |
– |
– |
– |
– |
– |
|
_ |
2.1 |
– |
– |
– |
– |
– |
– |
|
– |
– |
– |
– |
|
|
3.3 |
0.7 |
– |
– |
– |
– |
|
– |
1.8 |
– |
0.2 |
– |
– |
– |
– |
1.2 |
– |
– |
0.3 |
– |
|
|
4.0 |
1.1 |
– |
0.4 |
– |
– |
|
– |
6.5 |
– |
1.9 |
– |
1.0 |
– |
– |
1.2 |
– |
– |
0.3 |
– |
|
|
17.4 |
– |
– |
– |
0.2 |
– |
|
– |
0.7 |
– |
– |
– |
0.1 |
– |
– |
0.4 |
– |
– |
– |
– |
|
|
4.4 |
– |
– |
– |
– |
– |
|
– |
0.6 |
– |
0.5 |
– |
0.1 |
1.2 |
– |
– |
– |
– |
0.1 |
– |
|
|
3.9 |
– |
– |
0.1 |
– |
– |
|
– |
0.4 |
– |
– |
– |
– |
– |
– |
0.1 |
– |
– |
– |
– |
|
|
2.7 |
– |
– |
0.1 |
0.2 |
– |
|
– |
1.7 |
– |
0.5 |
– |
0.2 |
1.2 |
– |
0.5 |
– |
– |
0.1 |
– |
|
|
10.9 |
– |
– |
– |
– |
– |
|
– |
6.1 |
– |
0.3 |
0.1 |
– |
– |
– |
0.1 |
– |
– |
– |
– |
|
|
6.6 |
– |
– |
0.5 |
– |
– |
|
– |
3.2 |
– |
0.2 |
5.7 |
0.9 |
– |
– |
3.6 |
– |
– |
– |
– |
|
|
14.6 |
– |
– |
0.2 |
0.2 |
– |
|
– |
6.1 |
– |
– |
1.6 |
0.5 |
– |
– |
– |
– |
– |
– |
– |
|
|
8.7 |
1.9 |
0.2 |
1.3 |
– |
– |
|
0.2 |
4.8 |
– |
– |
4.0 |
2.3 |
– |
0.1 |
6.6 |
– |
– |
– |
– |
|
|
24.2 |
– |
– |
– |
– |
– |
|
– |
0.6 |
– |
– |
4.0 |
0.4 |
– |
– |
1.3 |
– |
– |
– |
– |
|
|
6.2 |
– |
– |
0.4 |
– |
– |
|
– |
21.9 |
– |
0.7 |
0.2 |
0.1 |
– |
– |
1.3 |
– |
– |
– |
– |
|
|
25.3 |
– |
0.1 |
0.2 |
– |
– |
|
– |
0.7 |
– |
– |
1.1 |
0.2 |
– |
– |
2.8 |
– |
– |
– |
– |
|
|
5.1 |
1.9 |
0.3 |
2.6 |
0.2 |
– |
|
0.2 |
43.4 |
– |
1.2 |
16.8 |
4.3 |
– |
0.1 |
15.7 |
– |
– |
– |
– |
|
|
90.7 |
– |
– |
– |
0.1 |
– |
|
– |
2.4 |
0.1 |
– |
– |
0.1 |
– |
– |
0.9 |
0.3 |
– |
– |
0.5 |
|
|
4.6 |
0.1 |
– |
– |
– |
0.3 |
|
– |
3.2 |
– |
1.1 |
– |
0.2 |
0.2 |
– |
1.0 |
5.0 |
– |
2.7 |
2.1 |
|
|
16.6 |
– |
– |
0.1 |
– |
– |
|
0.1 |
13.0 |
0.2 |
0.2 |
0.2 |
0.6 |
– |
– |
1.4 |
0.2 |
– |
– |
0.2 |
|
|
17.1 |
0.5 |
0.3 |
0.2 |
0.2 |
9.8 |
|
5.4 |
15.8 |
7.7 |
0.3 |
0.1 |
0.9 |
2.0 |
– |
2.7 |
19.0 |
8.4 |
12.6 |
20.3 |
|
107.0 |
|
1.0 |
0.1 |
0.4 |
– |
3.9 |
|
5.0 |
11.1 |
– |
3.7 |
– |
0.6 |
1.1 |
– |
1.5 |
1.1 |
1.0 |
10.8 |
5.6 |
|
|
49.3 |
0.1 |
– |
0.2 |
0.1 |
0.3 |
|
0.2 |
5.3 |
0.1 |
0.2 |
– |
0.7 |
0.8 |
– |
0.9 |
0.4 |
– |
2.6 |
4.5 |
|
|
16.3 |
0.3 |
– |
– |
– |
0.2 |
|
– |
0.3 |
– |
– |
– |
– |
– |
– |
0.2 |
– |
– |
0.1 |
– |
|
|
1.0 |
2.0 |
0.3 |
0.9 |
0.2 |
14.4 |
|
10.8 |
48.6 |
7.9 |
5.4 |
0.3 |
3.0 |
4.0 |
– |
7.6 |
25.6 |
9.4 |
28.8 |
32.8 |
|
207.3 |
|
5.1 |
0.6 |
4.0 |
0.7 |
14.4 |
|
10.9 |
102.6 |
8.0 |
8.9 |
17.1 |
8.6 |
5.3 |
0.1 |
25.9 |
25.9 |
9.4 |
29.2 |
33.3 |
|
330.8 |
|
|
|
|
|
|
|
|
|
|
|
|
|
|
|
|
|
|
|
|
|
|
|
*Includes re-exports. |
Source: Includes data from GIIGNL, Poten, Waterborne. |
28