

BP energy
.pdfMajor trade movements 2011
Trade flows worldwide (billion cubic metres)
88.0
 26.6
26.6
14.1
3.8
9.7
US
Canada
Mexico
S. & Cent. America
Europe & Eurasia
Middle East
|
Africa |
|
Pipeline gas |
|
|||
|
|
Asia Pacific
 LNG
LNG
|
|
|
|
|
117.1 |
|
|
|
|
|
|
|
|
66.4 |
|
|
|
|
|
|
|
|
|
32.0 |
|
|
|
|
|
|
|
23.5 |
29.1 |
9.8 |
|
|
|
|
|
|
|
|
||
3.9 |
|
|
16.8 |
35.2 |
12.1 |
19.8 |
|
|
|
44.1 |
|
|
|
||||
|
|
|
|
|
||||
|
15.7 |
|
|
10.2 |
5.0 |
19.0 |
||
|
|
|
4.4 |
14.3 |
||||
|
|
|
|
|
|
|
||
|
|
|
|
|
|
17.4 |
41.3 |
|
|
|
|
|
|
17.3 |
|
7.1 |
|
|
|
|
|
|
|
|
|
8.6
13.5
6.7 
 6.3
6.3
3.0
7.6
Source: Includes data from Cedigaz, CISStat, GIIGNL, Poten, Waterborne.
Gas trade in 2010 and 2011
|
|
|
2010 |
|
|
|
|
|
|
2011 |
|
|
|
||
|
|
|
|
|
|
|
|
|
|
|
|
||||
|
Pipeline |
LNG |
|
Pipeline |
LNG |
|
Pipeline |
LNG |
|
Pipeline |
LNG |
||||
Billion cubic metres |
imports |
imports |
|
exports |
exports |
|
imports |
imports |
|
exports |
exports |
||||
US |
93.3 |
12.2 |
|
30.3 |
1.6 |
|
88.1 |
10.0 |
|
40.7 |
2.0 |
|
|||
Canada |
20.9 |
2.1 |
|
92.4 |
– |
26.6 |
3.3 |
|
88.0 |
– |
|||||
Mexico |
9.4 |
5.7 |
|
0.9 |
– |
14.1 |
4.0 |
|
0.1 |
– |
|||||
Trinidad & Tobago |
– |
|
– |
|
– |
20.4 |
|
|
– |
|
– |
|
– |
18.9 |
|
Other S. & Cent. America |
14.3 |
9.2 |
|
14.3 |
1.8 |
|
15.6 |
10.9 |
|
15.6 |
5.1 |
|
|||
France |
34.6 |
14.2 |
|
1.5 |
– |
32.3 |
14.6 |
|
2.2 |
– |
|||||
Germany |
91.7 |
|
– |
|
14.9 |
– |
84.0 |
|
– |
|
11.7 |
– |
|||
Italy |
65.8 |
9.1 |
|
0.1 |
– |
60.8 |
8.7 |
|
0.1 |
– |
|||||
Netherlands |
16.8 |
|
– |
|
53.3 |
– |
13.6 |
0.8 |
|
50.4 |
– |
||||
Norway |
– |
|
– |
|
96.3 |
4.71 |
|
|
– |
|
– |
|
92.8 |
4.0 |
|
Spain |
8.9 |
27.9 |
|
0.5 |
– |
12.5 |
24.2 |
|
0.5 |
0.7 |
|
||||
Turkey |
28.4 |
8.0 |
|
0.7 |
– |
35.6 |
6.2 |
|
0.7 |
– |
|||||
United Kingdom |
35.0 |
18.7 |
|
15.7 |
– |
28.1 |
25.3 |
|
16.3 |
– |
|||||
Other Europe |
98.9 |
10.6 |
|
11.3 |
0.6 |
|
101.8 |
10.9 |
|
6.2 |
0.6 |
|
|||
Russian Federation |
32.7 |
|
– |
|
189.5 |
13.4 |
|
30.1 |
|
– |
|
207.0 |
14.4 |
|
|
Ukraine |
33.0 |
|
– |
|
– |
– |
40.5 |
|
– |
|
– |
– |
|||
Other Former Soviet Union |
32.2 |
|
– |
|
51.5 |
– |
30.4 |
|
– |
|
62.5 |
– |
|||
Qatar |
– |
|
– |
|
19.2 |
76.1 |
|
|
– |
|
– |
|
19.2 |
102.6 |
|
Other Middle East |
31.5 |
2.9 |
|
8.4 |
25.3 |
|
31.6 |
4.6 |
|
9.1 |
27.8 |
|
|||
Algeria |
– |
|
– |
|
37.0 |
19.3 |
|
|
– |
|
– |
|
34.4 |
17.1 |
|
Other Africa |
4.9 |
|
– |
|
18.0 |
39.5 |
|
5.7 |
|
– |
|
8.3 |
39.8 |
|
|
Japan |
– |
95.1 |
|
– |
– |
|
– |
107.0 |
|
– |
– |
||||
Indonesia |
– |
|
– |
|
9.9 |
31.8 |
|
|
– |
|
– |
|
8.7 |
29.2 |
|
South Korea |
– |
44.4 |
|
– |
– |
|
– |
49.3 |
|
– |
– |
||||
Other Asia Pacific |
33.4 |
40.4 |
|
19.9 |
66.1 |
|
43.2 |
51.0 |
|
20.3 |
68.6 |
|
|||
Total World |
685.5 |
300.6 |
|
685.5 |
300.6 |
|
694.6 |
330.8 |
|
694.6 |
330.8 |
|
|||
Source: Includes data from Cedigaz, CISStat, GIIGNL, Poten, Waterborne.
29

 Coal
Coal
Proved reserves at end 2011
|
|
Anthracite |
Sub- |
|
|
|
|
|
and |
bituminous |
|
Share |
|
|
Million tonnes |
bituminous |
and lignite |
Total |
of total |
R/P ratio |
|
US |
108501 |
128794 |
237295 |
27.6% |
239 |
|
Canada |
3474 |
3108 |
6582 |
0.8% |
97 |
|
Mexico |
860 |
351 |
1211 |
0.1% |
77 |
|
Total North America |
112835 |
132253 |
245088 |
28.5% |
228 |
|
Brazil |
– |
4559 |
4559 |
0.5% |
* |
|
Colombia |
6366 |
380 |
6746 |
0.8% |
79 |
|
Venezuela |
479 |
– |
479 |
0.1% |
55 |
|
Other S. & Cent. America |
45 |
679 |
724 |
0.1% |
* |
|
Total S. & Cent. America |
6890 |
5618 |
12508 |
1.5% |
124 |
|
Bulgaria |
2 |
2364 |
2366 |
0.3% |
64 |
|
Czech Republic |
192 |
908 |
1100 |
0.1% |
19 |
|
Germany |
99 |
40600 |
40699 |
4.7% |
216 |
|
Greece |
– |
3020 |
3020 |
0.4% |
53 |
|
Hungary |
13 |
1647 |
1660 |
0.2% |
174 |
|
Kazakhstan |
21500 |
12100 |
33600 |
3.9% |
290 |
|
Poland |
4338 |
1371 |
5709 |
0.7% |
41 |
|
Romania |
10 |
281 |
291 |
|
8 |
|
|
|||||
|
Russian Federation |
49088 |
107922 |
157010 |
18.2% |
471 |
|
Spain |
200 |
330 |
530 |
0.1% |
81 |
|
Turkey |
529 |
1814 |
2343 |
0.3% |
30 |
|
Ukraine |
15351 |
18522 |
33873 |
3.9% |
390 |
|
United Kingdom |
228 |
– |
228 |
|
12 |
|
|
|||||
|
Other Europe & Eurasia |
1440 |
20735 |
22175 |
2.6% |
238 |
|
Total Europe & Eurasia |
92990 |
211614 |
304604 |
35.4% |
242 |
|
South Africa |
30156 |
– |
30156 |
3.5% |
118 |
|
Zimbabwe |
502 |
– |
502 |
0.1% |
202 |
|
Other Africa |
860 |
174 |
1034 |
0.1% |
* |
|
Middle East |
1203 |
– |
1203 |
0.1% |
* |
|
Total Middle East & Africa |
32721 |
174 |
32895 |
3.8% |
126 |
|
Australia |
37100 |
39300 |
76400 |
8.9% |
184 |
|
China |
62200 |
52300 |
114500 |
13.3% |
33 |
|
India |
56100 |
4500 |
60600 |
7.0% |
103 |
|
Indonesia |
1520 |
4009 |
5529 |
0.6% |
17 |
|
Japan |
340 |
10 |
350 |
|
275 |
|
|
|||||
|
New Zealand |
33 |
538 |
571 |
0.1% |
115 |
|
North Korea |
300 |
300 |
600 |
0.1% |
19 |
|
Pakistan |
– |
2070 |
2070 |
0.2% |
* |
|
South Korea |
– |
126 |
126 |
|
60 |
|
|
|||||
|
Thailand |
– |
1239 |
1239 |
0.1% |
58 |
|
Vietnam |
150 |
– |
150 |
|
3 |
|
|
|||||
|
Other Asia Pacific |
1583 |
2125 |
3708 |
0.4% |
88 |
|
Total Asia Pacific |
159326 |
106517 |
265843 |
30.9% |
53 |
|
Total World |
404762 |
456176 |
860938 |
100.0% |
112 |
|
of which: OECD |
155926 |
222603 |
378529 |
44.0% |
182 |
|
Non-OECD |
248836 |
233573 |
482409 |
56.0% |
86 |
|
European Union |
5101 |
51047 |
56148 |
6.5% |
97 |
|
Former Soviet Union |
86725 |
141309 |
228034 |
26.5% |
408 |
*More than 500 years. |
|
Source of reserves data: Survey of Energy Resources, World Energy Council. |
||||
Less than 0.05%. |
|
|
|
|
|
|
Notes: Proved reserves of coal – Generally taken to be those quantities that geological and engineering information indicates with reasonable certainty can be recovered in the future from known deposits under existing economic and operating conditions.
Reserves-to-production (R/P) ratio – If the reserves remaining at the end of the year are divided by the production in that year, the result is the length of time that those remaining reserves would last if production were to continue at that rate.
Prices
|
Northwest |
US Central |
Japan coking |
Japan steam |
|
Europe |
Appalachian coal |
coal import |
coal import |
US dollars per tonne |
marker price† |
spot price index‡ |
cif price |
cif price |
1991 |
42.80 |
29.01 |
60.45 |
50.30 |
1992 |
38.53 |
28.53 |
57.82 |
48.45 |
1993 |
33.68 |
29.85 |
55.26 |
45.71 |
1994 |
37.18 |
31.72 |
51.77 |
43.66 |
1995 |
44.50 |
27.01 |
54.47 |
47.58 |
1996 |
41.25 |
29.86 |
56.68 |
49.54 |
1997 |
38.92 |
29.76 |
55.51 |
45.53 |
1998 |
32.00 |
31.00 |
50.76 |
40.51 |
1999 |
28.79 |
31.29 |
42.83 |
35.74 |
2000 |
35.99 |
29.90 |
39.69 |
34.58 |
2001 |
39.03 |
50.15 |
41.33 |
37.96 |
2002 |
31.65 |
33.20 |
42.01 |
36.90 |
2003 |
43.60 |
38.52 |
41.57 |
34.74 |
2004 |
72.08 |
64.90 |
60.96 |
51.34 |
2005 |
60.54 |
70.12 |
89.33 |
62.91 |
2006 |
64.11 |
62.96 |
93.46 |
63.04 |
2007 |
88.79 |
51.16 |
88.24 |
69.86 |
2008 |
147.67 |
118.79 |
179.03 |
122.81 |
2009 |
70.66 |
68.08 |
167.82 |
110.11 |
2010 |
92.50 |
71.63 |
158.95 |
105.19 |
2011 |
121.54 |
87.38 |
229.12 |
136.21 |
†Source: McCloskey Coal Information Service. Prices for 1991-2000 are the average of the monthly marker, 2001-2011 the average of weekly prices.
‡Source: Platts. Prices are for CAPP 12,500Btu, 1.2 SO2 coal, fob. Prices for 1991-2000 are by coal price publication date, 2001-2011 by coal price assessment date. Note: CAPP = Central Appalachian; cif = cost+insurance+freight (average prices); fob = free on board.
30
Reserves-to-production (R/P) ratios
Years
2011 by region |
History |
300 |
|
North America |
700 |
|
 S. & Cent. America
|
|
|
|
|
|
|
Europe & Eurasia |
|
|
|
|
|
|
|
|
|
|
|
Middle East & Africa |
|
|
|
|
|
|
|
|
|
250 |
|
Asia Pacific |
|
|
|
600 |
|
|
|
|
|
|
World |
|
|
|
|
|
|
|
|
|
|
|
|
|
|
|
|
|
|
|
|
|
|
|
|
|
|
|
|
500 |
|
|
|
|
|
200 |
|
|
|
|
|
|
|
|
|
|
|
|
|
|
|
|
|
400 |
|
|
|
|
|
150 |
|
|
|
|
|
|
|
|
|
|
|
|
|
|
|
|
|
300 |
|
|
|
|
|
100 |
|
|
|
|
|
|
|
|
|
|
|
|
|
|
|
|
|
200 |
|
|
|
|
|
50 |
|
|
|
|
|
100 |
|
|
|
|
|
|
|
|
|
|
|
|
North |
S. & Cent. |
Europe & |
Middle East |
Asia |
0 |
91 |
96 |
01 |
06 |
11 |
0 |
America |
America |
Eurasia |
& Africa |
Pacific |
|
|
|
|
|
|
|
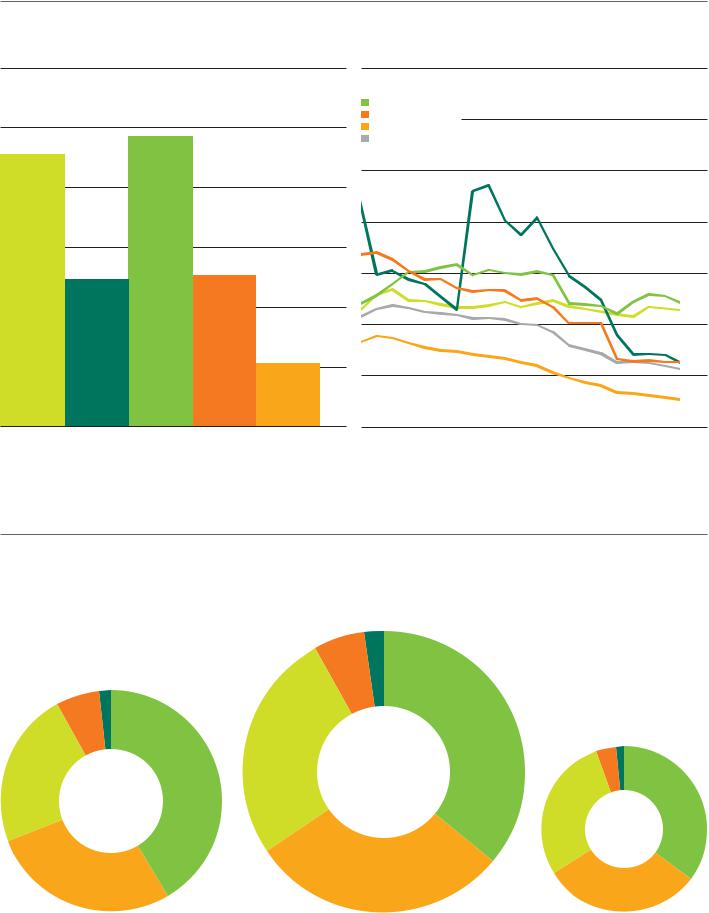
World proved reserves of coal in 2011 were sufficient to meet 112 years of global production, by far the largest R/P ratio for any fossil fuel. Europe & Eurasia holds the largest regional reserves and has the highest R/P ratio. The Asia Pacific region holds the second-largest reserves, while North America has the second-highest R/P ratio.
Distribution of proved reserves in 1991, 2001 and 2011
Percentage
|
Europe & Eurasia |
|
|
|
|
|
|
|
|
|
Asia Pacific |
|
|
|
|
|
|
|
|
|
|
|
|
|
|
North America |
|
|
|
|
|
|
|
|
|
|
|
|
|
|
Middle East & Africa |
|
2.2 36.1 |
|
|
|
|
||
|
|
|
||
|
S. & Cent. America |
|
|
|
|
|
|
||
|
|
|
||
|
|
|
5.8 |
|
1.4 41.4 |
|
|
|
|
6.4 |
|
|
|
|
|
|
|
3.8 1.5 |
35.4 |
|
|
|
2001 |
|
|
|
|
Total 984453 |
|
1991 |
|
million tonnes |
|
|
|
|
|
||
|
Total 981780 |
|
|
|
|
million tonnes |
|
2011 |
|
22.8 |
|
|||
26.2 |
Total 860938 |
|||
|
|
million tonnes |
||
|
|
|
||
29.7 |
28.5 |
|
|
|
30.9 |
27.9 |
|
|
Source: Survey of Energy Resources, World Energy Council. |
31

Production*
|
|
|
|
|
|
|
|
|
|
|
|
Change |
2011 |
|
|
|
|
|
|
|
|
|
|
|
|
2011 over |
share of |
Million tonnes oil equivalent |
2001 |
2002 |
2003 |
2004 |
2005 |
2006 |
2007 |
2008 |
2009 |
2010 |
2011 |
2010 |
total |
US |
590.3 |
570.1 |
553.6 |
572.4 |
580.2 |
595.1 |
587.7 |
596.7 |
540.9 |
551.8 |
556.8 |
0.9% |
14.1% |
Canada |
36.6 |
34.2 |
31.3 |
33.5 |
35.3 |
34.1 |
35.7 |
35.6 |
32.8 |
36.0 |
35.6 |
-1.2% |
0.9% |
Mexico |
5.3 |
5.3 |
4.6 |
4.7 |
5.2 |
5.5 |
6.0 |
5.5 |
5.0 |
4.8 |
7.6 |
55.8% |
0.2% |
Total North America |
632.2 |
609.5 |
589.5 |
610.7 |
620.7 |
634.7 |
629.4 |
637.8 |
578.7 |
592.7 |
600.0 |
1.2% |
15.2% |
Brazil |
2.1 |
1.9 |
1.8 |
2.0 |
2.4 |
2.2 |
2.3 |
2.5 |
2.2 |
2.1 |
2.4 |
11.3% |
0.1% |
Colombia |
28.5 |
25.7 |
32.5 |
34.9 |
38.4 |
42.6 |
45.4 |
47.8 |
47.3 |
48.3 |
55.8 |
15.4% |
1.4% |
Venezuela |
5.6 |
5.9 |
5.1 |
5.9 |
5.3 |
5.7 |
5.6 |
5.6 |
6.4 |
6.4 |
6.3 |
-1.3% |
0.2% |
Other S. & Cent. America |
0.5 |
0.4 |
0.5 |
0.2 |
0.3 |
0.6 |
0.3 |
0.4 |
0.5 |
0.3 |
0.3 |
– |
|
|
|||||||||||||
Total S. & Cent. America |
36.8 |
33.9 |
39.9 |
43.0 |
46.3 |
51.2 |
53.6 |
56.3 |
56.4 |
57.2 |
64.8 |
13.3% |
1.6% |
Bulgaria |
4.4 |
4.3 |
4.5 |
4.4 |
4.1 |
4.2 |
4.7 |
4.8 |
4.5 |
4.9 |
6.1 |
26.1% |
0.2% |
Czech Republic |
25.4 |
24.3 |
24.2 |
23.5 |
23.5 |
23.8 |
23.6 |
22.8 |
21.0 |
20.8 |
21.6 |
3.7% |
0.5% |
France |
1.5 |
1.1 |
1.3 |
0.4 |
0.2 |
0.2 |
0.2 |
0.1 |
† |
0.1 |
0.1 |
-42.9% |
|
|
|||||||||||||
Germany |
54.1 |
55.0 |
54.1 |
54.7 |
53.2 |
50.3 |
51.5 |
47.7 |
44.4 |
43.7 |
44.6 |
2.1% |
1.1% |
Greece |
8.5 |
9.1 |
9.0 |
9.1 |
9.0 |
8.3 |
8.6 |
8.3 |
8.4 |
7.4 |
7.4 |
-0.4% |
0.2% |
Hungary |
2.9 |
2.7 |
2.8 |
2.4 |
2.0 |
2.1 |
2.0 |
1.9 |
1.9 |
1.9 |
2.0 |
5.3% |
|
|
|||||||||||||
Kazakhstan |
40.7 |
37.8 |
43.3 |
44.4 |
44.2 |
49.1 |
50.0 |
56.8 |
51.5 |
56.2 |
58.8 |
4.5% |
1.5% |
Poland |
71.7 |
71.3 |
71.4 |
70.5 |
68.7 |
67.0 |
62.3 |
60.5 |
56.4 |
55.5 |
56.6 |
2.0% |
1.4% |
Romania |
7.1 |
6.6 |
7.0 |
6.7 |
6.6 |
6.5 |
6.7 |
6.7 |
6.4 |
5.8 |
6.7 |
14.1% |
0.2% |
Russian Federation |
122.6 |
117.3 |
127.1 |
131.7 |
139.2 |
145.1 |
148.0 |
153.4 |
142.1 |
151.1 |
157.3 |
4.1% |
4.0% |
Spain |
7.6 |
7.2 |
6.8 |
6.7 |
6.4 |
6.1 |
5.7 |
4.1 |
3.8 |
3.4 |
2.5 |
-25.2% |
0.1% |
Turkey |
13.2 |
11.5 |
10.4 |
10.1 |
12.6 |
13.7 |
16.0 |
16.8 |
17.1 |
15.8 |
16.6 |
5.1% |
0.4% |
Ukraine |
43.5 |
42.8 |
41.6 |
42.2 |
41.0 |
41.7 |
39.9 |
41.3 |
38.4 |
39.9 |
45.1 |
13.0% |
1.1% |
United Kingdom |
19.4 |
18.2 |
17.2 |
15.3 |
12.5 |
11.3 |
10.3 |
11.0 |
10.9 |
11.2 |
11.2 |
-0.4% |
0.3% |
Other Europe & Eurasia |
16.9 |
17.9 |
19.0 |
18.5 |
17.7 |
18.5 |
20.1 |
20.6 |
20.0 |
19.5 |
20.6 |
5.2% |
0.5% |
Total Europe & Eurasia |
439.6 |
427.2 |
439.8 |
440.6 |
440.8 |
448.0 |
449.8 |
456.9 |
426.6 |
437.3 |
457.1 |
4.5% |
11.6% |
Total Middle East |
0.7 |
0.8 |
0.7 |
0.8 |
0.8 |
0.9 |
1.0 |
1.0 |
0.7 |
0.7 |
0.7 |
– |
|
|
|||||||||||||
South Africa |
126.1 |
124.1 |
134.1 |
137.2 |
137.7 |
138.0 |
139.6 |
142.4 |
141.2 |
143.3 |
143.8 |
0.3% |
3.6% |
Zimbabwe |
2.9 |
2.5 |
1.8 |
2.4 |
2.2 |
1.4 |
1.3 |
1.0 |
1.1 |
1.6 |
1.6 |
– |
|
|
|||||||||||||
Other Africa |
1.2 |
1.3 |
1.6 |
1.3 |
1.2 |
1.3 |
1.1 |
1.2 |
1.0 |
1.2 |
1.2 |
– |
|
|
|||||||||||||
Total Africa |
130.2 |
128.0 |
137.5 |
140.9 |
141.1 |
140.6 |
142.1 |
144.5 |
143.3 |
146.1 |
146.6 |
0.3% |
3.7% |
Australia |
180.2 |
184.3 |
189.4 |
196.8 |
205.7 |
210.8 |
217.1 |
224.1 |
232.1 |
236.0 |
230.8 |
-2.2% |
5.8% |
China |
809.5 |
853.8 |
1013.4 |
1174.1 |
1302.2 |
1406.4 |
1501.1 |
1557.1 |
1652.1 |
1797.7 |
1956.0 |
8.8% |
49.5% |
India |
133.6 |
138.5 |
144.4 |
155.7 |
162.1 |
170.2 |
181.0 |
195.6 |
210.8 |
217.5 |
222.4 |
2.3% |
5.6% |
Indonesia |
56.9 |
63.5 |
70.3 |
81.4 |
93.9 |
119.2 |
133.4 |
147.8 |
157.6 |
169.2 |
199.8 |
18.1% |
5.1% |
Japan |
1.8 |
0.8 |
0.7 |
0.7 |
0.6 |
0.7 |
0.8 |
0.7 |
0.7 |
0.5 |
0.7 |
38.7% |
|
|
|||||||||||||
New Zealand |
2.5 |
2.8 |
3.2 |
3.3 |
3.3 |
3.6 |
3.0 |
3.0 |
2.8 |
3.3 |
3.1 |
-7.7% |
0.1% |
Pakistan |
1.5 |
1.6 |
1.5 |
1.5 |
1.6 |
1.7 |
1.6 |
1.8 |
1.6 |
1.5 |
1.4 |
-4.1% |
|
|
|||||||||||||
South Korea |
1.7 |
1.5 |
1.5 |
1.4 |
1.3 |
1.3 |
1.3 |
1.2 |
1.1 |
0.9 |
0.9 |
0.1% |
|
|
|||||||||||||
Thailand |
5.6 |
5.7 |
5.3 |
5.6 |
5.8 |
5.3 |
5.1 |
5.0 |
5.0 |
5.1 |
6.0 |
16.7% |
0.2% |
Vietnam |
7.5 |
9.2 |
10.8 |
14.7 |
18.3 |
21.8 |
22.4 |
23.0 |
25.2 |
24.6 |
24.9 |
1.1% |
0.6% |
Other Asia Pacific |
19.9 |
19.6 |
20.3 |
22.1 |
24.9 |
25.3 |
23.9 |
25.6 |
28.5 |
36.3 |
40.2 |
10.8% |
1.0% |
Total Asia Pacific |
1220.7 |
1281.2 |
1460.8 |
1657.3 |
1819.6 |
1966.3 |
2090.7 |
2184.8 |
2317.4 |
2492.7 |
2686.3 |
7.8% |
67.9% |
Total World |
2460.2 |
2480.5 |
2668.1 |
2893.2 |
3069.3 |
3241.7 |
3366.5 |
3481.2 |
3523.2 |
3726.7 |
3955.5 |
6.1% |
100.0% |
of which: OECD |
1029.1 |
1006.2 |
989.5 |
1012.5 |
1025.7 |
1040.4 |
1039.9 |
1047.5 |
986.3 |
1000.0 |
1004.4 |
0.4% |
25.4% |
Non-OECD |
1431.2 |
1474.3 |
1678.6 |
1880.7 |
2043.6 |
2201.3 |
2326.7 |
2433.7 |
2536.9 |
2726.6 |
2951.0 |
8.2% |
74.6% |
European Union |
207.5 |
205.0 |
203.8 |
198.6 |
191.0 |
184.3 |
180.8 |
173.0 |
162.5 |
160.1 |
164.3 |
2.6% |
4.2% |
Former Soviet Union |
210.1 |
201.4 |
215.8 |
222.2 |
228.5 |
239.9 |
242.3 |
256.1 |
236.3 |
252.2 |
266.5 |
5.7% |
6.7% |
*Commercial solid fuels only, i.e. bituminous coal and anthracite (hard coal), and lignite and brown (sub-bituminous) coal. †Less than 0.05.
Less than 0.05%.
Note: Coal production data expressed in million tonnes is available at bp.com/statisticalreview.
32

Consumption*
|
|
|
|
|
|
|
|
|
|
|
|
Change |
2011 |
|
|
|
|
|
|
|
|
|
|
|
|
2011 over |
share of |
Million tonnes oil equivalent |
2001 |
2002 |
2003 |
2004 |
2005 |
2006 |
2007 |
2008 |
2009 |
2010 |
2011 |
2010 |
total |
US |
552.2 |
552.0 |
562.5 |
566.1 |
574.2 |
565.7 |
573.3 |
564.1 |
496.2 |
526.1 |
501.9 |
-4.6% |
13.5% |
Canada |
34.0 |
31.6 |
27.0 |
28.5 |
33.3 |
29.1 |
29.8 |
29.9 |
25.2 |
24.0 |
21.8 |
-9.1% |
0.6% |
Mexico |
6.9 |
7.8 |
8.9 |
7.1 |
9.3 |
9.1 |
9.1 |
6.8 |
8.4 |
9.4 |
9.9 |
5.6% |
0.3% |
Total North America |
593.1 |
591.3 |
598.4 |
601.7 |
616.8 |
603.9 |
612.2 |
600.8 |
529.8 |
559.5 |
533.7 |
-4.6% |
14.3% |
Argentina |
0.6 |
0.5 |
0.7 |
0.8 |
0.9 |
0.3 |
0.4 |
1.1 |
1.2 |
1.0 |
1.1 |
10.7% |
|
|
|||||||||||||
Brazil |
12.2 |
11.5 |
11.8 |
12.8 |
12.7 |
12.5 |
13.4 |
13.5 |
11.3 |
13.9 |
13.9 |
-0.5% |
0.4% |
Chile |
2.3 |
2.4 |
2.3 |
2.6 |
2.6 |
3.2 |
3.8 |
4.1 |
3.7 |
4.2 |
5.3 |
25.9% |
0.1% |
Colombia |
2.7 |
2.2 |
2.4 |
2.0 |
2.7 |
2.4 |
2.4 |
2.8 |
3.5 |
4.0 |
4.3 |
7.1% |
0.1% |
Ecuador |
– |
– |
– |
– |
– |
– |
– |
– |
– |
– |
– |
– |
– |
Peru |
0.4 |
0.7 |
0.7 |
0.7 |
0.8 |
0.6 |
0.8 |
0.8 |
0.8 |
0.8 |
0.8 |
6.9% |
|
|
|||||||||||||
Trinidad & Tobago |
– |
– |
– |
– |
– |
– |
– |
– |
– |
– |
– |
– |
– |
Venezuela |
† |
† |
† |
– |
† |
† |
† |
† |
0.1 |
1.9 |
2.0 |
4.2% |
0.1% |
Other S. & Cent. America |
0.7 |
1.0 |
2.1 |
1.9 |
1.9 |
2.0 |
2.1 |
2.1 |
2.6 |
2.4 |
2.4 |
2.1% |
0.1% |
Total S. & Cent. America |
19.0 |
18.3 |
19.9 |
20.8 |
21.5 |
21.1 |
22.8 |
24.4 |
23.1 |
28.2 |
29.8 |
5.7% |
0.8% |
Austria |
3.1 |
3.0 |
3.3 |
3.3 |
3.1 |
3.1 |
3.0 |
2.8 |
2.3 |
2.6 |
2.5 |
-4.0% |
0.1% |
Azerbaijan |
† |
† |
† |
† |
† |
† |
† |
† |
† |
† |
† |
– |
|
|
|||||||||||||
Belarus |
0.1 |
0.1 |
0.1 |
0.1 |
0.1 |
0.1 |
† |
† |
† |
† |
† |
– |
|
|
|||||||||||||
Belgium |
6.7 |
6.0 |
5.8 |
5.6 |
5.0 |
4.8 |
4.4 |
3.9 |
3.1 |
3.3 |
2.1 |
-37.2% |
0.1% |
Bulgaria |
7.1 |
6.5 |
7.2 |
7.1 |
6.8 |
6.9 |
7.7 |
7.5 |
6.4 |
6.8 |
8.4 |
23.8% |
0.2% |
Czech Republic |
21.2 |
20.6 |
20.8 |
20.9 |
20.4 |
21.1 |
21.2 |
19.9 |
17.4 |
18.2 |
19.2 |
5.6% |
0.5% |
Denmark |
4.2 |
4.2 |
5.7 |
4.6 |
3.7 |
5.6 |
4.7 |
4.1 |
4.0 |
3.8 |
3.2 |
-15.4% |
0.1% |
Finland |
3.9 |
4.1 |
5.5 |
5.0 |
2.9 |
4.7 |
4.4 |
3.0 |
3.3 |
4.3 |
3.3 |
-23.0% |
0.1% |
France |
12.1 |
12.4 |
13.3 |
12.8 |
13.3 |
12.1 |
12.3 |
11.9 |
9.9 |
10.7 |
9.0 |
-15.9% |
0.2% |
Germany |
85.0 |
84.6 |
87.2 |
85.4 |
82.1 |
83.5 |
85.7 |
80.1 |
71.7 |
76.6 |
77.6 |
1.2% |
2.1% |
Greece |
9.3 |
9.8 |
9.4 |
9.0 |
8.8 |
8.1 |
8.5 |
8.1 |
8.1 |
7.4 |
7.3 |
-0.5% |
0.2% |
Hungary |
3.4 |
3.1 |
3.4 |
3.1 |
2.7 |
2.9 |
2.9 |
2.8 |
2.5 |
2.6 |
2.7 |
3.3% |
0.1% |
Republic of Ireland |
1.9 |
1.8 |
1.7 |
1.8 |
1.9 |
1.6 |
1.6 |
1.4 |
1.2 |
1.2 |
1.3 |
1.9% |
|
|
|||||||||||||
Italy |
13.1 |
13.3 |
14.0 |
16.0 |
16.0 |
16.4 |
16.6 |
16.4 |
12.9 |
14.3 |
15.4 |
7.9% |
0.4% |
Kazakhstan |
22.5 |
22.8 |
25.2 |
26.5 |
27.2 |
29.8 |
31.7 |
33.4 |
32.6 |
31.6 |
30.2 |
-4.5% |
0.8% |
Lithuania |
0.1 |
0.1 |
0.2 |
0.2 |
0.2 |
0.2 |
0.2 |
0.2 |
0.1 |
0.2 |
0.2 |
6.4% |
|
|
|||||||||||||
Netherlands |
8.5 |
8.9 |
9.1 |
9.1 |
8.7 |
8.5 |
9.0 |
8.5 |
7.9 |
7.9 |
7.8 |
-1.6% |
0.2% |
Norway |
0.9 |
0.8 |
0.7 |
0.8 |
0.7 |
0.6 |
0.7 |
0.7 |
0.5 |
0.6 |
0.6 |
2.1% |
|
|
|||||||||||||
Poland |
58.0 |
56.7 |
57.7 |
57.3 |
55.7 |
58.0 |
57.9 |
56.0 |
51.9 |
56.4 |
59.8 |
6.0% |
1.6% |
Portugal |
3.7 |
4.1 |
3.8 |
3.7 |
3.8 |
3.8 |
3.3 |
2.9 |
3.3 |
1.9 |
2.6 |
36.9% |
0.1% |
Romania |
7.2 |
7.6 |
7.8 |
7.4 |
7.6 |
8.5 |
7.4 |
7.4 |
6.6 |
6.1 |
7.1 |
16.6% |
0.2% |
Russian Federation |
102.4 |
103.0 |
104.0 |
99.5 |
94.2 |
96.7 |
93.4 |
100.4 |
91.9 |
90.2 |
90.9 |
0.8% |
2.4% |
Slovakia |
4.1 |
4.0 |
4.2 |
4.1 |
3.9 |
3.8 |
3.8 |
3.7 |
3.5 |
3.4 |
3.3 |
-3.2% |
0.1% |
Spain |
20.1 |
22.7 |
21.0 |
22.0 |
22.5 |
19.8 |
21.9 |
15.5 |
11.8 |
9.8 |
14.9 |
52.1% |
0.4% |
Sweden |
2.0 |
2.2 |
2.2 |
2.3 |
2.2 |
2.3 |
2.2 |
2.0 |
1.6 |
2.1 |
2.0 |
-8.0% |
0.1% |
Switzerland |
0.1 |
0.1 |
0.1 |
0.1 |
0.1 |
0.1 |
0.2 |
0.1 |
0.1 |
0.1 |
0.1 |
-2.0% |
|
|
|||||||||||||
Turkey |
18.4 |
19.3 |
20.7 |
21.8 |
21.8 |
25.9 |
28.9 |
29.2 |
30.4 |
30.9 |
32.4 |
5.1% |
0.9% |
Turkmenistan |
– |
– |
– |
– |
– |
– |
– |
– |
– |
– |
– |
– |
– |
Ukraine |
39.7 |
38.9 |
40.3 |
39.1 |
37.4 |
39.7 |
39.7 |
40.2 |
35.1 |
37.9 |
42.4 |
11.9% |
1.1% |
United Kingdom |
38.9 |
35.7 |
38.1 |
36.6 |
37.4 |
40.9 |
38.4 |
35.6 |
29.9 |
31.0 |
30.8 |
-0.7% |
0.8% |
Uzbekistan |
1.1 |
1.0 |
0.7 |
1.2 |
1.2 |
1.7 |
1.4 |
1.4 |
1.4 |
1.3 |
1.3 |
-0.1% |
|
|
|||||||||||||
Other Europe & Eurasia |
19.8 |
21.9 |
23.1 |
23.8 |
22.1 |
19.2 |
20.2 |
20.6 |
19.5 |
20.1 |
20.8 |
3.9% |
0.6% |
Total Europe & Eurasia |
518.5 |
519.5 |
536.3 |
530.3 |
513.6 |
530.3 |
533.2 |
519.8 |
471.1 |
483.3 |
499.2 |
3.3% |
13.4% |
Iran |
1.1 |
1.1 |
1.1 |
1.0 |
1.2 |
1.2 |
1.3 |
0.9 |
1.0 |
0.8 |
0.8 |
-2.4% |
|
|
|||||||||||||
Israel |
7.2 |
7.6 |
7.9 |
8.0 |
7.9 |
7.8 |
8.0 |
7.9 |
7.7 |
7.7 |
7.9 |
2.6% |
0.2% |
Kuwait |
– |
– |
– |
– |
– |
– |
– |
– |
– |
– |
– |
– |
– |
Qatar |
– |
– |
– |
– |
– |
– |
– |
– |
– |
– |
– |
– |
– |
Saudi Arabia |
– |
– |
– |
– |
– |
– |
– |
– |
– |
– |
– |
– |
– |
United Arab Emirates |
– |
– |
– |
– |
– |
– |
– |
– |
– |
– |
– |
– |
– |
Other Middle East |
– |
– |
– |
– |
– |
– |
– |
– |
– |
– |
– |
– |
– |
Total Middle East |
8.3 |
8.7 |
9.0 |
9.0 |
9.1 |
9.1 |
9.3 |
8.8 |
8.7 |
8.5 |
8.7 |
2.1% |
0.2% |
Algeria |
0.5 |
0.6 |
0.6 |
0.6 |
0.6 |
0.6 |
0.6 |
0.6 |
0.2 |
– |
– |
– |
– |
Egypt |
1.2 |
1.3 |
1.4 |
1.3 |
1.3 |
1.2 |
1.2 |
1.2 |
1.2 |
0.9 |
0.9 |
1.8% |
|
|
|||||||||||||
South Africa |
73.4 |
75.9 |
81.4 |
85.4 |
82.9 |
84.0 |
89.1 |
95.1 |
89.9 |
91.3 |
92.9 |
1.7% |
2.5% |
Other Africa |
7.1 |
6.9 |
6.1 |
6.8 |
7.0 |
6.4 |
5.7 |
5.9 |
4.8 |
5.9 |
6.0 |
2.2% |
0.2% |
Total Africa |
82.2 |
84.7 |
89.5 |
94.1 |
91.7 |
92.1 |
96.5 |
102.7 |
96.1 |
98.1 |
99.8 |
1.7% |
2.7% |
Australia |
48.2 |
51.1 |
49.4 |
50.8 |
53.5 |
56.0 |
54.1 |
54.6 |
54.5 |
43.8 |
49.8 |
13.6% |
1.3% |
Bangladesh |
0.4 |
0.4 |
0.4 |
0.4 |
0.4 |
0.5 |
0.4 |
0.6 |
0.6 |
0.9 |
1.0 |
6.1% |
|
|
|||||||||||||
China |
720.8 |
760.4 |
900.2 |
1065.6 |
1186.2 |
1317.7 |
1392.5 |
1441.1 |
1579.5 |
1676.2 |
1839.4 |
9.7% |
49.4% |
China Hong Kong SAR |
4.9 |
5.4 |
6.6 |
6.6 |
6.7 |
7.0 |
7.5 |
7.0 |
7.6 |
6.3 |
7.7 |
21.4% |
0.2% |
India |
145.2 |
151.8 |
156.8 |
172.3 |
184.4 |
195.4 |
210.3 |
230.4 |
253.8 |
270.8 |
295.6 |
9.2% |
7.9% |
Indonesia |
16.8 |
18.0 |
24.2 |
22.2 |
25.4 |
30.1 |
37.8 |
30.1 |
34.6 |
41.2 |
44.0 |
6.7% |
1.2% |
Japan |
103.0 |
106.6 |
112.2 |
120.8 |
121.3 |
119.1 |
125.3 |
128.7 |
108.8 |
123.7 |
117.7 |
-4.8% |
3.2% |
Malaysia |
3.0 |
3.6 |
5.3 |
6.6 |
6.9 |
7.3 |
8.8 |
9.8 |
10.6 |
13.8 |
15.0 |
9.2% |
0.4% |
New Zealand |
1.4 |
1.4 |
2.0 |
2.1 |
2.3 |
2.2 |
1.7 |
2.1 |
1.6 |
1.4 |
1.4 |
1.9% |
|
|
|||||||||||||
Pakistan |
2.1 |
2.4 |
2.9 |
3.8 |
4.1 |
4.2 |
5.1 |
5.3 |
4.7 |
4.5 |
4.2 |
-5.9% |
0.1% |
Philippines |
4.5 |
4.7 |
4.7 |
5.0 |
5.7 |
5.5 |
5.9 |
7.0 |
6.7 |
7.7 |
8.3 |
7.0% |
0.2% |
Singapore |
– |
– |
– |
– |
– |
– |
– |
– |
– |
– |
– |
– |
– |
South Korea |
45.7 |
49.1 |
51.1 |
53.1 |
54.8 |
54.8 |
59.7 |
66.1 |
68.6 |
75.9 |
79.4 |
4.6% |
2.1% |
Taiwan |
30.6 |
32.7 |
35.1 |
36.6 |
38.1 |
39.6 |
41.8 |
40.2 |
38.7 |
40.3 |
41.6 |
3.4% |
1.1% |
Thailand |
8.8 |
9.2 |
9.4 |
10.4 |
11.2 |
12.4 |
14.1 |
15.3 |
14.5 |
15.3 |
13.9 |
-9.4% |
0.4% |
Vietnam |
5.0 |
5.3 |
5.5 |
8.2 |
8.0 |
9.5 |
10.1 |
10.0 |
14.0 |
13.9 |
15.0 |
8.3% |
0.4% |
Other Asia Pacific |
19.4 |
18.5 |
18.8 |
19.2 |
20.5 |
21.0 |
17.8 |
19.5 |
19.0 |
18.7 |
19.1 |
2.2% |
0.5% |
Total Asia Pacific |
1160.0 |
1220.5 |
1384.6 |
1583.4 |
1729.5 |
1882.5 |
1993.2 |
2067.6 |
2217.8 |
2354.4 |
2553.2 |
8.4% |
68.6% |
Total World |
2381.1 |
2443.2 |
2637.7 |
2839.3 |
2982.3 |
3139.0 |
3267.3 |
3324.1 |
3346.6 |
3532.0 |
3724.3 |
5.4% |
100.0% |
of which: OECD |
1124.1 |
1131.4 |
1155.8 |
1169.3 |
1180.8 |
1179.5 |
1201.9 |
1178.0 |
1056.7 |
1110.8 |
1098.6 |
-1.1% |
29.5% |
Non-OECD |
1257.0 |
1311.8 |
1481.9 |
1670.0 |
1801.5 |
1959.5 |
2065.4 |
2146.1 |
2289.9 |
2421.2 |
2625.7 |
8.4% |
70.5% |
European Union |
318.0 |
316.1 |
326.2 |
322.2 |
313.5 |
321.3 |
322.5 |
298.9 |
264.0 |
276.0 |
285.9 |
3.6% |
7.7% |
Former Soviet Union |
169.3 |
169.5 |
174.5 |
170.9 |
164.2 |
171.9 |
170.9 |
179.9 |
165.2 |
166.3 |
169.8 |
2.1% |
4.6% |
*Commercial solid fuels only, i.e. bituminous coal and anthracite (hard coal), and lignite and brown (sub-bituminous) coal. †Less than 0.05.
Less than 0.05%.
33
Production by region
Million tonnes oil equivalent
|
Asia Pacific |
4000 |
|
||
|
Africa |
|
|
|
|
|
|
|
|
Middle East |
|
|
|
|
|
Europe & Eurasia |
|
|
3500 |
|
|
S. & Cent. America |
|
|
|
|
|
North America |
|
|
|
|
|
|
|
|
|
3000 |
|
|
|
|
|
2500 |
|
|
|
|
|
2000 |
|
|
|
|
|
1500 |
|
|
|
|
|
1000 |
|
|
|
|
|
500 |
Consumption by region
Million tonnes oil equivalent
|
Asia Pacific |
4000 |
|
||
|
Africa |
|
|
|
|
|
|
|
|
Middle East |
|
|
|
|
|
Europe & Eurasia |
|
|
3500 |
|
|
S. & Cent. America |
|
|
|
|
|
North America |
|
|
|
|
|
|
|
|
|
3000 |
|
|
|
|
|
2500 |
|
|
|
|
|
2000 |
|
|
|
|
|
1500 |
|
|
|
|
|
1000 |
|
|
|
|
|
500 |
86 |
91 |
96 |
01 |
06 |
11 |
0 |
86 |
91 |
96 |
01 |
06 |
11 |
0 |
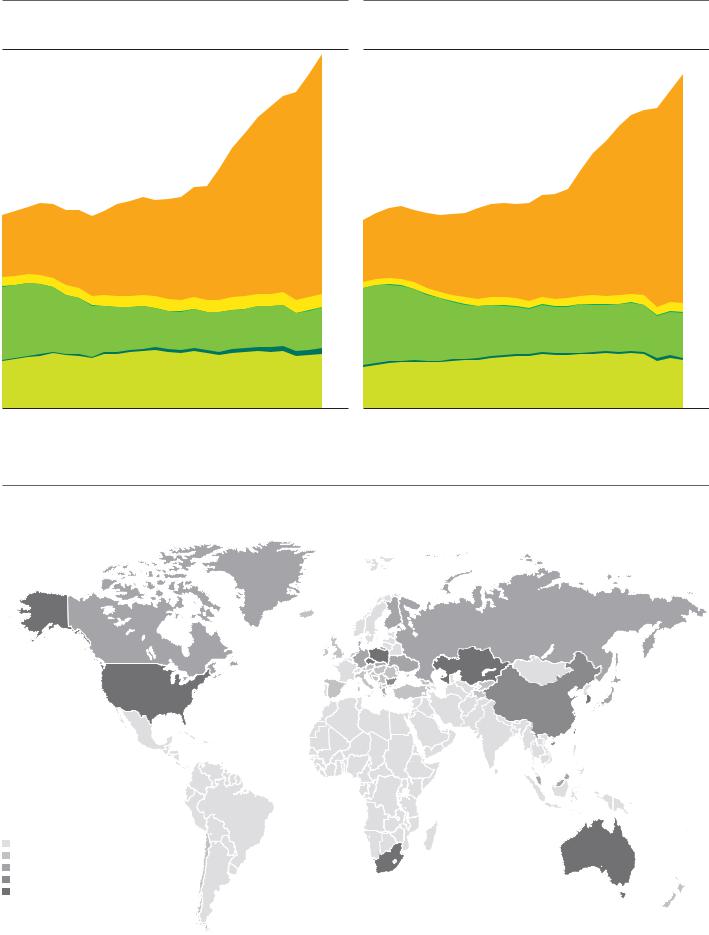
Coal was again the fastest-growing fossil fuel. Global production grew by 6.1%. The Asia Pacific region accounted for 85% of global production growth, led by an 8.8% increase in China, the world’s largest supplier. Global coal consumption increased by 5.4%, with the Asia Pacific region accounting for all of the net growth. Elsewhere, large declines in North American consumption were offset by growth in all other regions.
Consumption per capita 2011
Tonnes oil equivalent
0-0.25
0.25-0.5
0.5-1.0
1.0-1.5 > 1.5
34

 Nuclear energy
Consumption*
|
|
|
|
|
|
|
|
|
|
|
|
Change |
2011 |
|
|
|
|
|
|
|
|
|
|
|
|
2011 over |
share of |
Million tonnes oil equivalent |
2001 |
2002 |
2003 |
2004 |
2005 |
2006 |
2007 |
2008 |
2009 |
2010 |
2011 |
2010 |
total |
US |
183.1 |
185.8 |
181.9 |
187.8 |
186.3 |
187.5 |
192.1 |
192.0 |
190.3 |
192.2 |
188.2 |
-2.1% |
31.4% |
Canada |
17.2 |
17.0 |
16.8 |
20.3 |
20.7 |
22.0 |
21.0 |
21.1 |
20.3 |
20.3 |
21.4 |
5.6% |
3.6% |
Mexico |
2.0 |
2.2 |
2.4 |
2.1 |
2.4 |
2.5 |
2.4 |
2.2 |
2.4 |
1.3 |
2.3 |
71.6% |
0.4% |
Total North America |
202.3 |
205.0 |
201.1 |
210.2 |
209.4 |
212.0 |
215.4 |
215.4 |
213.0 |
213.8 |
211.9 |
-0.9% |
35.4% |
Argentina |
1.6 |
1.3 |
1.7 |
1.8 |
1.6 |
1.7 |
1.6 |
1.6 |
1.8 |
1.6 |
1.4 |
-11.9% |
0.2% |
Brazil |
3.2 |
3.1 |
3.0 |
2.6 |
2.2 |
3.1 |
2.8 |
3.2 |
2.9 |
3.3 |
3.5 |
7.8% |
0.6% |
Chile |
– |
– |
– |
– |
– |
– |
– |
– |
– |
– |
– |
– |
– |
Colombia |
– |
– |
– |
– |
– |
– |
– |
– |
– |
– |
– |
– |
– |
Ecuador |
– |
– |
– |
– |
– |
– |
– |
– |
– |
– |
– |
– |
– |
Peru |
– |
– |
– |
– |
– |
– |
– |
– |
– |
– |
– |
– |
– |
Trinidad & Tobago |
– |
– |
– |
– |
– |
– |
– |
– |
– |
– |
– |
– |
– |
Venezuela |
– |
– |
– |
– |
– |
– |
– |
– |
– |
– |
– |
– |
– |
Other S. & Cent. America |
– |
– |
– |
– |
– |
– |
– |
– |
– |
– |
– |
– |
– |
Total S. & Cent. America |
4.8 |
4.4 |
4.7 |
4.4 |
3.8 |
4.8 |
4.4 |
4.8 |
4.7 |
4.9 |
4.9 |
1.4% |
0.8% |
Austria |
– |
– |
– |
– |
– |
– |
– |
– |
– |
– |
– |
– |
– |
Azerbaijan |
– |
– |
– |
– |
– |
– |
– |
– |
– |
– |
– |
– |
– |
Belarus |
– |
– |
– |
– |
– |
– |
– |
– |
– |
– |
– |
– |
– |
Belgium |
10.5 |
10.7 |
10.7 |
10.7 |
10.8 |
10.6 |
10.9 |
10.3 |
10.7 |
10.8 |
10.9 |
0.9% |
1.8% |
Bulgaria |
4.4 |
4.6 |
4.5 |
4.4 |
4.2 |
4.4 |
3.3 |
3.6 |
3.4 |
3.5 |
3.7 |
6.9% |
0.6% |
Czech Republic |
3.3 |
4.2 |
5.9 |
6.0 |
5.6 |
5.9 |
5.9 |
6.0 |
6.2 |
6.3 |
6.4 |
1.0% |
1.1% |
Denmark |
– |
– |
– |
– |
– |
– |
– |
– |
– |
– |
– |
– |
– |
Finland |
5.2 |
5.1 |
5.2 |
5.2 |
5.3 |
5.2 |
5.4 |
5.3 |
5.4 |
5.2 |
5.3 |
1.8% |
0.9% |
France |
95.3 |
98.8 |
99.8 |
101.7 |
102.4 |
102.1 |
99.7 |
99.6 |
92.8 |
96.9 |
100.0 |
3.2% |
16.7% |
Germany |
38.8 |
37.3 |
37.4 |
37.8 |
36.9 |
37.9 |
31.8 |
33.7 |
30.5 |
31.8 |
24.4 |
-23.2% |
4.1% |
Greece |
– |
– |
– |
– |
– |
– |
– |
– |
– |
– |
– |
– |
– |
Hungary |
3.2 |
3.2 |
2.5 |
2.7 |
3.1 |
3.0 |
3.3 |
3.4 |
3.5 |
3.6 |
3.5 |
-0.4% |
0.6% |
Republic of Ireland |
– |
– |
– |
– |
– |
– |
– |
– |
– |
– |
– |
– |
– |
Italy |
– |
– |
– |
– |
– |
– |
– |
– |
– |
– |
– |
– |
– |
Kazakhstan |
– |
– |
– |
– |
– |
– |
– |
– |
– |
– |
– |
– |
– |
Lithuania |
2.6 |
3.2 |
3.5 |
3.4 |
2.3 |
2.0 |
2.2 |
2.2 |
2.5 |
– |
– |
– |
– |
Netherlands |
0.9 |
0.9 |
0.9 |
0.9 |
0.9 |
0.8 |
1.0 |
0.9 |
1.0 |
0.9 |
0.9 |
4.3% |
0.2% |
Norway |
– |
– |
– |
– |
– |
– |
– |
– |
– |
– |
– |
– |
– |
Poland |
– |
– |
– |
– |
– |
– |
– |
– |
– |
– |
– |
– |
– |
Portugal |
– |
– |
– |
– |
– |
– |
– |
– |
– |
– |
– |
– |
– |
Romania |
1.2 |
1.2 |
1.1 |
1.3 |
1.3 |
1.3 |
1.7 |
2.5 |
2.7 |
2.6 |
2.7 |
1.1% |
0.4% |
Russian Federation |
31.0 |
32.1 |
33.6 |
32.7 |
33.4 |
35.4 |
36.2 |
36.9 |
37.0 |
38.5 |
39.2 |
1.6% |
6.5% |
Slovakia |
3.9 |
4.1 |
4.0 |
3.9 |
4.0 |
4.1 |
3.5 |
3.8 |
3.2 |
3.3 |
3.4 |
3.9% |
0.6% |
Spain |
14.4 |
14.3 |
14.0 |
14.4 |
13.0 |
13.6 |
12.5 |
13.3 |
11.9 |
14.0 |
13.0 |
-7.0% |
2.2% |
Sweden |
16.3 |
15.4 |
15.3 |
17.3 |
16.4 |
15.2 |
15.2 |
14.5 |
11.9 |
13.2 |
13.8 |
4.3% |
2.3% |
Switzerland |
6.0 |
6.1 |
6.2 |
6.1 |
5.2 |
6.3 |
6.3 |
6.2 |
6.2 |
6.0 |
6.1 |
1.6% |
1.0% |
Turkey |
– |
– |
– |
– |
– |
– |
– |
– |
– |
– |
– |
– |
– |
Turkmenistan |
– |
– |
– |
– |
– |
– |
– |
– |
– |
– |
– |
– |
– |
Ukraine |
17.2 |
17.7 |
18.4 |
19.7 |
20.1 |
20.4 |
20.9 |
20.3 |
18.8 |
20.2 |
20.4 |
1.2% |
3.4% |
United Kingdom |
20.4 |
19.9 |
20.1 |
18.1 |
18.5 |
17.1 |
14.3 |
11.9 |
15.6 |
14.1 |
15.6 |
11.1% |
2.6% |
Uzbekistan |
– |
– |
– |
– |
– |
– |
– |
– |
– |
– |
– |
– |
– |
Other Europe & Eurasia |
1.6 |
1.8 |
1.6 |
1.8 |
1.9 |
1.9 |
1.9 |
2.0 |
1.9 |
1.8 |
2.0 |
7.6% |
0.3% |
Total Europe & Eurasia |
276.3 |
280.5 |
284.8 |
287.9 |
285.4 |
287.0 |
275.9 |
276.5 |
265.1 |
272.9 |
271.5 |
–0.5% |
45.3% |
Iran |
– |
– |
– |
– |
– |
– |
– |
– |
– |
– |
† |
– |
♦ |
|
|||||||||||||
Israel |
– |
– |
– |
– |
– |
– |
– |
– |
– |
– |
– |
– |
– |
Kuwait |
– |
– |
– |
– |
– |
– |
– |
– |
– |
– |
– |
– |
– |
Qatar |
– |
– |
– |
– |
– |
– |
– |
– |
– |
– |
– |
– |
– |
Saudi Arabia |
– |
– |
– |
– |
– |
– |
– |
– |
– |
– |
– |
– |
– |
United Arab Emirates |
– |
– |
– |
– |
– |
– |
– |
– |
– |
– |
– |
– |
– |
Other Middle East |
– |
– |
– |
– |
– |
– |
– |
– |
– |
– |
– |
– |
– |
Total Middle East |
– |
– |
– |
– |
– |
– |
– |
– |
– |
– |
† |
– |
♦ |
|
|||||||||||||
Algeria |
– |
– |
– |
– |
– |
– |
– |
– |
– |
– |
– |
– |
– |
Egypt |
– |
– |
– |
– |
– |
– |
– |
– |
– |
– |
– |
– |
– |
South Africa |
2.6 |
2.9 |
3.0 |
3.4 |
2.9 |
2.7 |
2.8 |
2.7 |
3.1 |
3.1 |
2.9 |
-5.5% |
0.5% |
Other Africa |
– |
– |
– |
– |
– |
– |
– |
– |
– |
– |
– |
– |
– |
Total Africa |
2.6 |
2.9 |
3.0 |
3.4 |
2.9 |
2.7 |
2.8 |
2.7 |
3.1 |
3.1 |
2.9 |
–5.5% |
0.5% |
Australia |
– |
– |
– |
– |
– |
– |
– |
– |
– |
– |
– |
– |
– |
Bangladesh |
– |
– |
– |
– |
– |
– |
– |
– |
– |
– |
– |
– |
– |
China |
4.0 |
5.7 |
9.8 |
11.4 |
12.0 |
12.4 |
14.1 |
15.5 |
15.9 |
16.7 |
19.5 |
16.9% |
3.3% |
China Hong Kong SAR |
– |
– |
– |
– |
– |
– |
– |
– |
– |
– |
– |
– |
– |
India |
4.3 |
4.4 |
4.1 |
3.8 |
4.0 |
4.0 |
4.0 |
3.4 |
3.8 |
5.2 |
7.3 |
39.6% |
1.2% |
Indonesia |
– |
– |
– |
– |
– |
– |
– |
– |
– |
– |
– |
– |
– |
Japan |
72.7 |
71.3 |
52.1 |
64.7 |
66.3 |
69.0 |
63.1 |
57.0 |
65.0 |
66.2 |
36.9 |
-44.3% |
6.2% |
Malaysia |
– |
– |
– |
– |
– |
– |
– |
– |
– |
– |
– |
– |
– |
New Zealand |
– |
– |
– |
– |
– |
– |
– |
– |
– |
– |
– |
– |
– |
Pakistan |
0.5 |
0.4 |
0.4 |
0.5 |
0.6 |
0.6 |
0.6 |
0.4 |
0.6 |
0.6 |
0.8 |
39.6% |
0.1% |
Philippines |
– |
– |
– |
– |
– |
– |
– |
– |
– |
– |
– |
– |
– |
Singapore |
– |
– |
– |
– |
– |
– |
– |
– |
– |
– |
– |
– |
– |
South Korea |
25.4 |
27.0 |
29.3 |
29.6 |
33.2 |
33.7 |
32.3 |
34.2 |
33.4 |
33.6 |
34.0 |
1.1% |
5.7% |
Taiwan |
8.0 |
8.9 |
8.8 |
8.9 |
9.0 |
9.0 |
9.2 |
9.2 |
9.4 |
9.4 |
9.5 |
1.2% |
1.6% |
Thailand |
– |
– |
– |
– |
– |
– |
– |
– |
– |
– |
– |
– |
– |
Vietnam |
– |
– |
– |
– |
– |
– |
– |
– |
– |
– |
– |
– |
– |
Other Asia Pacific |
– |
– |
– |
– |
– |
– |
– |
– |
– |
– |
– |
– |
– |
Total Asia Pacific |
114.8 |
117.7 |
104.6 |
119.0 |
125.2 |
128.7 |
123.3 |
119.7 |
128.2 |
131.7 |
108.0 |
-18.0% |
18.0% |
Total World |
600.8 |
610.5 |
598.3 |
624.9 |
626.7 |
635.2 |
621.8 |
619.0 |
614.1 |
626.3 |
599.3 |
-4.3% |
100.0% |
of which: OECD |
519.8 |
524.5 |
505.7 |
530.4 |
532.4 |
537.6 |
521.8 |
516.8 |
511.6 |
521.1 |
487.8 |
-6.4% |
81.4% |
Non-OECD |
81.0 |
86.0 |
92.6 |
94.6 |
94.3 |
97.6 |
100.1 |
102.2 |
102.5 |
105.2 |
111.5 |
6.0% |
18.6% |
European Union |
221.6 |
224.2 |
226.0 |
228.9 |
226.0 |
224.3 |
211.9 |
212.5 |
202.5 |
207.6 |
205.3 |
-1.1% |
34.3% |
Former Soviet Union |
51.2 |
53.4 |
56.0 |
56.4 |
56.4 |
58.4 |
60.0 |
60.0 |
58.8 |
59.3 |
60.2 |
1.5% |
10.0% |
*Based on gross generation and not accounting for cross-border electricity supply. Converted on the basis of thermal equivalence assuming 38% conversion efficiency in a modern thermal power station. †Less than 0.05.
Less than 0.05%.
Note: Nuclear energy data expressed in terawatt-hours is available at bp.com/statisticalreview.
35

 Hydroelectricity
Consumption*
|
|
|
|
|
|
|
|
|
|
|
|
Change |
2011 |
|
|
|
|
|
|
|
|
|
|
|
|
2011 over |
share of |
Million tonnes oil equivalent |
2001 |
2002 |
2003 |
2004 |
2005 |
2006 |
2007 |
2008 |
2009 |
2010 |
2011 |
2010 |
total |
US |
49.6 |
60.4 |
63.0 |
61.3 |
61.8 |
66.1 |
56.6 |
58.2 |
62.5 |
59.5 |
74.3 |
24.9% |
9.4% |
Canada |
75.0 |
79.1 |
76.1 |
76.6 |
82.1 |
80.2 |
83.6 |
85.2 |
82.9 |
79.4 |
85.2 |
7.3% |
10.8% |
Mexico |
6.4 |
5.6 |
4.5 |
5.7 |
6.2 |
6.9 |
6.1 |
8.8 |
6.0 |
8.3 |
8.1 |
-2.6% |
1.0% |
Total North America |
131.1 |
145.1 |
143.6 |
143.6 |
150.1 |
153.2 |
146.3 |
152.2 |
151.4 |
147.2 |
167.6 |
13.9% |
21.2% |
Argentina |
9.5 |
9.4 |
8.8 |
8.0 |
9.0 |
9.8 |
8.5 |
8.4 |
9.2 |
9.2 |
9.0 |
-2.2% |
1.1% |
Brazil |
60.6 |
64.7 |
69.2 |
72.6 |
76.4 |
78.9 |
84.6 |
83.6 |
88.5 |
91.2 |
97.2 |
6.5% |
12.3% |
Chile |
4.9 |
5.2 |
5.2 |
4.9 |
6.0 |
6.6 |
5.2 |
5.4 |
5.6 |
4.9 |
4.7 |
-4.1% |
0.6% |
Colombia |
7.1 |
7.6 |
8.1 |
9.0 |
9.0 |
9.7 |
10.1 |
10.4 |
9.3 |
9.1 |
10.9 |
19.7% |
1.4% |
Ecuador |
1.6 |
1.7 |
1.6 |
1.7 |
1.6 |
1.6 |
2.0 |
2.6 |
2.1 |
2.0 |
2.2 |
11.6% |
0.3% |
Peru |
4.0 |
4.1 |
4.2 |
4.0 |
4.1 |
4.4 |
4.4 |
4.3 |
4.5 |
4.5 |
4.9 |
7.8% |
0.6% |
Trinidad & Tobago |
– |
– |
– |
– |
– |
– |
– |
– |
– |
– |
– |
– |
– |
Venezuela |
13.7 |
13.5 |
13.7 |
15.9 |
17.5 |
18.5 |
18.8 |
19.6 |
19.5 |
17.4 |
18.9 |
9.0% |
2.4% |
Other S. & Cent. America |
16.9 |
17.8 |
18.2 |
17.8 |
18.3 |
18.5 |
19.3 |
19.3 |
19.1 |
20.3 |
20.4 |
0.5% |
2.6% |
Total S. & Cent. America |
118.3 |
124.1 |
129.0 |
133.8 |
141.7 |
148.0 |
153.0 |
153.8 |
157.7 |
158.6 |
168.2 |
6.0% |
21.3% |
Austria |
9.5 |
9.0 |
8.1 |
7.7 |
7.7 |
7.2 |
7.7 |
8.3 |
8.9 |
7.7 |
6.9 |
-10.8% |
0.9% |
Azerbaijan |
0.3 |
0.5 |
0.6 |
0.6 |
0.7 |
0.6 |
0.5 |
0.5 |
0.5 |
0.8 |
0.6 |
22.4% |
0.1% |
Belarus |
† |
† |
† |
† |
† |
† |
† |
† |
† |
† |
† |
-15.5% |
♦ |
|
|||||||||||||
Belgium |
0.1 |
0.1 |
0.1 |
0.1 |
0.1 |
0.1 |
0.1 |
0.1 |
0.1 |
0.1 |
† |
-36.1% |
♦ |
|
|||||||||||||
Bulgaria |
0.2 |
0.5 |
0.7 |
0.7 |
1.0 |
0.9 |
0.6 |
0.6 |
0.8 |
1.3 |
0.6 |
-49.3% |
0.1% |
Czech Republic |
0.6 |
0.6 |
0.4 |
0.6 |
0.7 |
0.7 |
0.6 |
0.5 |
0.7 |
0.8 |
0.6 |
-18.0% |
0.1% |
Denmark |
† |
† |
† |
† |
† |
† |
† |
† |
† |
† |
† |
-19.7% |
♦ |
|
|||||||||||||
Finland |
3.1 |
2.4 |
2.1 |
3.4 |
3.1 |
2.6 |
3.2 |
3.9 |
2.9 |
2.9 |
2.8 |
-3.4% |
0.4% |
France |
17.0 |
13.9 |
13.5 |
13.5 |
11.8 |
12.7 |
13.2 |
13.7 |
13.0 |
14.2 |
10.3 |
-27.5% |
1.3% |
Germany |
5.3 |
5.4 |
4.3 |
4.7 |
4.6 |
4.4 |
4.6 |
4.5 |
4.2 |
4.8 |
4.4 |
-7.1% |
0.6% |
Greece |
0.6 |
0.8 |
1.2 |
1.2 |
1.3 |
1.5 |
0.8 |
0.9 |
1.3 |
1.7 |
1.0 |
-42.9% |
0.1% |
Hungary |
† |
† |
† |
† |
† |
† |
† |
† |
0.1 |
† |
0.1 |
21.8% |
♦ |
|
|||||||||||||
Republic of Ireland |
0.1 |
0.2 |
0.1 |
0.1 |
0.1 |
0.2 |
0.2 |
0.2 |
0.2 |
0.1 |
0.2 |
17.3% |
♦ |
|
|||||||||||||
Italy |
10.6 |
8.9 |
8.3 |
9.6 |
8.2 |
8.4 |
7.4 |
9.4 |
11.1 |
11.5 |
10.1 |
-12.1% |
1.3% |
Kazakhstan |
1.8 |
2.0 |
2.0 |
1.8 |
1.8 |
1.8 |
1.8 |
1.7 |
1.6 |
1.8 |
1.8 |
-1.3% |
0.2% |
Lithuania |
0.2 |
0.2 |
0.2 |
0.2 |
0.2 |
0.2 |
0.2 |
0.2 |
0.3 |
0.3 |
0.2 |
-19.3% |
♦ |
|
|||||||||||||
Netherlands |
† |
† |
† |
† |
† |
† |
† |
† |
† |
† |
† |
-45.7% |
♦ |
|
|||||||||||||
Norway |
27.4 |
29.4 |
24.0 |
24.7 |
30.9 |
27.1 |
30.6 |
31.8 |
28.8 |
26.7 |
27.6 |
3.5% |
3.5% |
Poland |
1.0 |
0.9 |
0.7 |
0.8 |
0.9 |
0.7 |
0.7 |
0.6 |
0.7 |
0.8 |
0.6 |
-20.8% |
0.1% |
Portugal |
3.3 |
1.9 |
3.6 |
2.3 |
1.2 |
2.6 |
2.3 |
1.7 |
2.0 |
3.8 |
2.8 |
-27.9% |
0.3% |
Romania |
3.4 |
3.6 |
3.0 |
3.7 |
4.6 |
4.2 |
3.6 |
3.9 |
3.6 |
4.5 |
3.4 |
-24.4% |
0.4% |
Russian Federation |
39.8 |
37.1 |
35.7 |
40.2 |
39.5 |
39.6 |
40.5 |
37.7 |
39.9 |
38.1 |
37.3 |
-2.1% |
4.7% |
Slovakia |
1.2 |
1.2 |
0.8 |
1.0 |
1.1 |
1.0 |
1.0 |
1.0 |
1.0 |
1.3 |
0.9 |
-28.3% |
0.1% |
Spain |
9.3 |
5.2 |
9.3 |
7.2 |
4.0 |
5.8 |
6.2 |
5.3 |
6.0 |
9.6 |
6.9 |
-27.6% |
0.9% |
Sweden |
17.9 |
15.0 |
12.1 |
13.7 |
16.5 |
14.0 |
15.0 |
15.7 |
14.9 |
15.1 |
15.0 |
-0.6% |
1.9% |
Switzerland |
9.4 |
8.0 |
7.9 |
7.6 |
7.1 |
7.0 |
8.0 |
8.2 |
8.1 |
8.2 |
7.4 |
-9.7% |
0.9% |
Turkey |
5.4 |
7.6 |
8.0 |
10.4 |
9.0 |
10.0 |
8.1 |
7.5 |
8.1 |
11.7 |
11.8 |
1.1% |
1.5% |
Turkmenistan |
† |
† |
† |
† |
† |
† |
† |
† |
† |
† |
† |
– |
♦ |
|
|||||||||||||
Ukraine |
2.8 |
2.2 |
2.1 |
2.7 |
2.8 |
2.9 |
2.3 |
2.6 |
2.7 |
2.9 |
2.4 |
-16.8% |
0.3% |
United Kingdom |
0.9 |
1.1 |
0.7 |
1.1 |
1.1 |
1.0 |
1.2 |
1.2 |
1.2 |
0.8 |
1.3 |
58.0% |
0.2% |
Uzbekistan |
1.2 |
1.6 |
1.7 |
1.6 |
1.4 |
1.4 |
1.4 |
2.6 |
2.1 |
2.3 |
2.3 |
1.4% |
0.3% |
Other Europe & Eurasia |
17.0 |
16.8 |
17.7 |
18.9 |
19.1 |
18.3 |
17.4 |
18.1 |
19.7 |
22.7 |
19.7 |
-13.2% |
2.5% |
Total Europe & Eurasia |
189.2 |
176.3 |
169.1 |
180.3 |
180.1 |
177.0 |
179.3 |
182.5 |
184.3 |
196.4 |
179.1 |
-8.8% |
22.6% |
Iran |
0.9 |
1.8 |
2.2 |
2.7 |
3.0 |
4.2 |
4.1 |
1.7 |
1.5 |
2.2 |
2.7 |
25.3% |
0.3% |
Israel |
– |
– |
– |
– |
– |
– |
– |
– |
– |
– |
– |
– |
– |
Kuwait |
– |
– |
– |
– |
– |
– |
– |
– |
– |
– |
– |
– |
– |
Qatar |
– |
– |
– |
– |
– |
– |
– |
– |
– |
– |
– |
– |
– |
Saudi Arabia |
– |
– |
– |
– |
– |
– |
– |
– |
– |
– |
– |
– |
– |
United Arab Emirates |
– |
– |
– |
– |
– |
– |
– |
– |
– |
– |
– |
– |
– |
Other Middle East |
1.0 |
1.1 |
1.0 |
1.3 |
2.4 |
2.5 |
2.2 |
1.5 |
1.3 |
1.9 |
2.3 |
16.9% |
0.3% |
Total Middle East |
1.9 |
2.9 |
3.2 |
4.0 |
5.3 |
6.6 |
6.3 |
3.2 |
2.8 |
4.1 |
5.0 |
21.3% |
0.6% |
Algeria |
† |
† |
0.1 |
0.1 |
0.1 |
† |
0.1 |
0.1 |
0.1 |
† |
0.1 |
118.5% |
♦ |
|
|||||||||||||
Egypt |
3.3 |
3.2 |
2.9 |
2.9 |
2.9 |
2.9 |
3.5 |
3.3 |
2.9 |
2.9 |
3.1 |
5.8% |
0.4% |
South Africa |
0.5 |
0.5 |
0.2 |
0.2 |
0.2 |
0.3 |
0.6 |
0.2 |
0.2 |
0.3 |
0.4 |
53.8% |
0.1% |
Other Africa |
14.0 |
15.2 |
15.4 |
16.6 |
17.2 |
17.3 |
17.5 |
17.9 |
19.0 |
19.7 |
19.8 |
0.5% |
2.5% |
Total Africa |
17.8 |
18.9 |
18.6 |
19.7 |
20.4 |
20.5 |
21.7 |
21.5 |
22.2 |
23.0 |
23.5 |
2.1% |
3.0% |
Australia |
3.6 |
3.6 |
3.7 |
3.6 |
3.6 |
3.6 |
3.3 |
2.7 |
2.8 |
2.8 |
2.4 |
-15.6% |
0.3% |
Bangladesh |
0.2 |
0.2 |
0.3 |
0.3 |
0.3 |
0.3 |
0.3 |
0.3 |
0.4 |
0.3 |
0.3 |
1.8% |
♦ |
|
|||||||||||||
China |
62.8 |
65.2 |
64.2 |
80.0 |
89.8 |
98.6 |
109.8 |
132.4 |
139.3 |
163.4 |
157.0 |
-3.9% |
19.8% |
China Hong Kong SAR |
– |
– |
– |
– |
– |
– |
– |
– |
– |
– |
– |
– |
– |
India |
16.3 |
15.5 |
15.7 |
19.0 |
22.0 |
25.4 |
27.7 |
26.0 |
24.0 |
25.0 |
29.8 |
18.9% |
3.8% |
Indonesia |
2.6 |
2.3 |
2.1 |
2.2 |
2.4 |
2.2 |
2.6 |
2.6 |
2.6 |
4.0 |
3.5 |
-12.8% |
0.4% |
Japan |
18.6 |
18.9 |
21.1 |
21.1 |
17.9 |
20.4 |
17.5 |
17.5 |
16.4 |
20.6 |
19.2 |
-6.7% |
2.4% |
Malaysia |
1.5 |
1.2 |
1.3 |
1.3 |
1.2 |
1.6 |
1.5 |
2.0 |
1.6 |
1.6 |
1.7 |
6.3% |
0.2% |
New Zealand |
4.9 |
5.6 |
5.3 |
6.1 |
5.3 |
5.3 |
5.3 |
5.1 |
5.5 |
5.6 |
5.7 |
1.5% |
0.7% |
Pakistan |
4.1 |
4.6 |
5.8 |
5.5 |
6.9 |
6.8 |
7.1 |
6.1 |
6.4 |
6.7 |
6.9 |
3.9% |
0.9% |
Philippines |
1.6 |
1.6 |
1.8 |
1.9 |
1.9 |
2.2 |
1.9 |
2.2 |
2.2 |
1.8 |
2.1 |
21.0% |
0.3% |
Singapore |
– |
– |
– |
– |
– |
– |
– |
– |
– |
– |
– |
– |
– |
South Korea |
0.5 |
0.7 |
1.1 |
1.0 |
0.8 |
0.8 |
0.8 |
0.7 |
0.6 |
0.8 |
1.2 |
40.9% |
0.1% |
Taiwan |
1.1 |
0.6 |
0.7 |
0.7 |
0.9 |
0.9 |
1.0 |
0.9 |
0.8 |
0.9 |
0.9 |
-4.6% |
0.1% |
Thailand |
1.4 |
1.7 |
1.7 |
1.4 |
1.3 |
1.8 |
1.8 |
1.6 |
1.6 |
1.3 |
1.8 |
47.5% |
0.2% |
Vietnam |
4.2 |
4.1 |
4.3 |
4.3 |
3.7 |
4.5 |
5.1 |
5.9 |
6.8 |
6.3 |
6.7 |
7.9% |
0.9% |
Other Asia Pacific |
5.5 |
5.5 |
6.0 |
6.1 |
6.5 |
7.4 |
8.0 |
8.5 |
8.1 |
8.6 |
8.8 |
2.3% |
1.1% |
Total Asia Pacific |
128.9 |
131.4 |
135.0 |
154.3 |
164.6 |
181.9 |
193.8 |
214.6 |
219.0 |
249.7 |
248.1 |
-0.6% |
31.3% |
Total World |
587.2 |
598.6 |
598.4 |
635.8 |
662.3 |
687.2 |
700.4 |
727.7 |
737.5 |
778.9 |
791.5 |
1.6% |
100.0% |
of which: OECD |
288.5 |
293.3 |
287.8 |
292.7 |
295.2 |
299.4 |
292.0 |
301.9 |
299.5 |
307.6 |
315.1 |
2.5% |
39.8% |
Non-OECD |
298.7 |
305.3 |
310.6 |
343.1 |
367.1 |
387.8 |
408.4 |
425.8 |
438.0 |
471.4 |
476.4 |
1.1% |
60.2% |
European Union |
85.7 |
72.4 |
70.7 |
73.4 |
69.5 |
69.6 |
70.0 |
73.4 |
74.8 |
83.1 |
69.6 |
-16.2% |
8.8% |
Former Soviet Union |
54.2 |
52.0 |
51.3 |
56.3 |
55.9 |
55.6 |
56.5 |
54.1 |
55.7 |
55.9 |
54.6 |
-2.4% |
6.9% |
*Based on gross primary hydroelectric generation and not accounting for cross-border electricity supply. Converted on the basis of thermal equivalence assuming 38% conversion efficiency in a modern thermal power station.
†Less than 0.05.Less than 0.05%.
Note: Hydroelectricity data expressed in terawatt-hours is available at bp.com/statisticalreview.
36
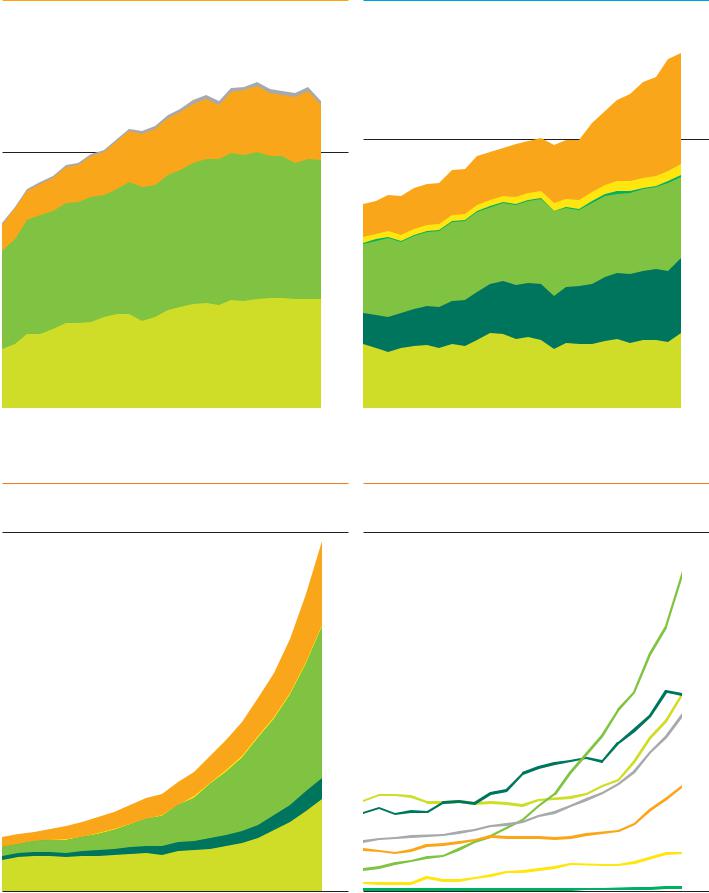
Nuclear energy consumption by region |
|
|
Hydroelectricity consumption by region |
|
||||||
Million tonnes oil equivalent |
|
|
Million tonnes oil equivalent |
|
||||||
|
|
|
|
|
|
|
|
|
|
|
|
|
Rest of World |
700 |
|
|
Asia Pacific |
800 |
|||
|
|
Asia Pacific |
|
|
|
|
Africa |
|
||
|
|
|
|
|
|
|||||
|
|
|
|
|
|
|||||
|
|
Europe & Eurasia |
|
|
|
|
Middle East |
|
||
|
|
|
|
|
|
|||||
|
|
North America |
|
|
|
|
Europe & Eurasia |
|
|
|
|
|
|
|
|
|
700 |
||||
|
|
|
|
|
|
|
|
S. & Cent. America |
||
|
|
|
|
600 |
|
|
||||
|
|
|
|
|
|
|
||||
 North America
600
|
|
|
|
|
|
500 |
|
|
|
|
|
|
|
|
|
|
|
|
|
|
|
|
|
|
|
|
|
|
|
|
|
|
|
|
|
|
|
|
|
|
|
|
|
500 |
|
|
|
|
|
|
|
|
|
|
|
|
|
|
|
|
|
|
|
|
|
400 |
|
|
|
|
|
|
|
|
|
|
|
|
|
|
|
|
|
|
|
|
|
|
|
|
|
|
|
|
|
|
|
|
|
|
|
|
|
400 |
|
|
|
|
|
|
|
|
|
|
|
|
|
|
|
|
|
|
|
|
|
300 |
|
|
|
|
|
|
|
|
|
|
|
|
|
|
|
|
|
|
|
|
|
|
|
|
|
|
|
|
|
|
|
|
|
|
|
|
|
300 |
|
|
|
|
|
|
|
|
|
|
|
|
|
|
|
|
|
|
|
|
|
200 |
|
|
|
|
|
|
|
|
|
|
|
|
|
|
|
|
|
|
|
|
|
|
|
|
|
|
|
|
|
|
|
|
|
|
|
|
|
200 |
|
|
|
|
|
|
|
|
|
|
|
|
|
|
|
|
|
|
|
|
|
100 |
|
|
|
|
|
|
|
|
|
|
|
|
|
|
|
|
|
|
|
|
100 |
||
|
|
|
|
|
|
|
|
|
|
|
|
|
|
|
|
|
|
|
|
|
|
|
|
|
|
|
|
|
|
86 |
91 |
96 |
01 |
06 |
11 |
0 |
86 |
91 |
96 |
01 |
06 |
11 |
0 |
|
World nuclear power generation declined by 4.3%, the largest decline on record. Japanese nuclear output fell by 44.3%, and German output fell by 23.2%. Global hydroelectric output grew by a below-average 1.6%. Strong growth in North America (+13.9%) was offset by drought-related declines in Europe & Eurasia and Asia Pacific.
Other renewables consumption by region
Million tonnes oil equivalent
|
Asia Pacific |
200 |
||
|
||||
|
Africa |
|
||
|
|
|||
|
|
|||
|
Middle East |
|
|
|
|
|
|
||
|
180 |
|||
|
Europe & Eurasia |
|||
|
S. & Cent. America |
|
||
|
|
|||
|
North America |
|
||
|
|
|||
160 |
||||
|
|
|
||
|
|
|
|
|
|
|
|
140 |
|
|
|
|
|
|
|
|
|
120 |
|
|
|
|
|
|
|
|
|
100 |
|
|
|
|
|
|
|
|
|
80 |
|
|
|
|
|
|
|
|
|
60 |
|
|
|
|
|
|
|
|
|
40 |
|
|
|
|
|
|
|
|
|
20 |
|
Other renewables share of power generation by region
Percentage
|
|
World |
8 |
|
|
|
|||
|
|
|
||
|
|
Asia Pacific |
|
|
|
|
|||
|
|
|||
|
|
Africa |
|
|
|
|
|||
|
|
|||
|
|
Middle East |
|
|
|
|
|||
7 |
||||
|
||||
|
|
Europe & Eurasia |
||
|
|
|
||
|
|
S. & Cent. America |
|
|
|
|
|
||
|
|
|
||
|
|
North America |
|
|
|
|
|
||
|
|
|
|
|
|
|
|
6 |
|
|
|
|
|
|
|
|
|
5 |
|
|
|
|
|
|
|
|
|
4 |
|
|
|
|
|
|
|
|
|
3 |
|
|
|
|
|
|
|
|
|
2 |
|
|
|
|
|
|
|
|
|
1 |
91 |
93 |
95 |
97 |
99 |
01 |
03 |
05 |
07 |
09 |
11 |
0 |
91 |
93 |
95 |
97 |
99 |
01 |
03 |
05 |
07 |
09 |
11 |
0 |
Renewable energy in power generation grew by an above-average 17.7%. Wind generation (+25.8%) accounted for more than half of renewable power generation for the first time. Renewables accounted for 3.9% of global power generation, with the highest share in Europe & Eurasia (7.1%).
37

 Renewable energy
Other renewables consumption*
|
|
|
|
|
|
|
|
|
|
|
|
Change |
2011 |
|
|
|
|
|
|
|
|
|
|
|
|
|
2011 over |
share of |
|
Million tonnes oil equivalent |
2001 |
2002 |
2003 |
2004 |
2005 |
2006 |
2007 |
2008 |
2009 |
2010 |
2011 |
2010 |
total |
|
US |
16.8 |
18.7 |
18.8 |
19.6 |
20.6 |
22.7 |
24.7 |
29.5 |
33.6 |
38.9 |
45.3 |
16.4% |
23.2% |
|
Canada |
2.0 |
2.2 |
2.2 |
2.2 |
2.4 |
2.5 |
2.6 |
2.5 |
3.0 |
3.8 |
4.4 |
16.1% |
2.2% |
|
Mexico |
1.4 |
1.3 |
1.6 |
1.7 |
1.8 |
1.7 |
1.9 |
1.8 |
1.8 |
1.7 |
1.8 |
1.1% |
0.9% |
|
Total North America |
20.2 |
22.2 |
22.6 |
23.5 |
24.9 |
27.0 |
29.3 |
33.8 |
38.5 |
44.4 |
51.4 |
15.8% |
26.4% |
|
Argentina |
0.2 |
0.2 |
0.3 |
0.3 |
0.3 |
0.3 |
0.3 |
0.4 |
0.4 |
0.4 |
0.4 |
9.6% |
0.2% |
|
Brazil |
2.8 |
3.1 |
3.5 |
3.7 |
4.2 |
4.3 |
5.0 |
5.5 |
5.9 |
7.3 |
7.5 |
2.0% |
3.8% |
|
Chile |
0.5 |
0.4 |
0.3 |
0.5 |
0.4 |
0.3 |
0.6 |
0.7 |
1.0 |
1.0 |
1.0 |
♦ |
0.5% |
|
|
||||||||||||||
Colombia |
0.1 |
0.1 |
0.1 |
0.1 |
0.1 |
0.1 |
0.1 |
0.1 |
0.1 |
0.2 |
0.2 |
– |
0.1% |
|
Ecuador |
– |
– |
– |
† |
† |
† |
† |
† |
† |
0.1 |
0.1 |
-0.9% |
♦ |
|
Peru |
† |
† |
† |
† |
0.1 |
0.1 |
0.1 |
0.1 |
0.1 |
0.1 |
0.1 |
– |
0.1% |
|
Trinidad & Tobago |
† |
† |
† |
† |
† |
† |
† |
† |
† |
† |
† |
– |
♦ |
|
|
||||||||||||||
Venezuela |
– |
– |
– |
– |
– |
– |
– |
– |
– |
– |
– |
– |
– |
|
Other S. & Cent. America |
1.1 |
1.1 |
1.2 |
1.3 |
1.2 |
1.3 |
1.4 |
1.7 |
1.8 |
2.0 |
2.0 |
3.0% |
1.0% |
|
Total S. & Cent. America |
4.6 |
5.0 |
5.5 |
5.9 |
6.3 |
6.5 |
7.7 |
8.6 |
9.4 |
11.1 |
11.3 |
2.2% |
5.8% |
|
Austria |
0.4 |
0.4 |
0.5 |
0.7 |
0.9 |
1.2 |
1.4 |
1.4 |
1.4 |
1.5 |
1.6 |
8.2% |
0.8% |
|
Azerbaijan |
– |
– |
– |
– |
– |
– |
– |
– |
† |
† |
† |
195.8% |
♦ |
|
|
||||||||||||||
Belarus |
– |
– |
– |
† |
† |
† |
† |
† |
† |
† |
† |
– |
♦ |
|
|
||||||||||||||
Belgium |
0.4 |
0.4 |
0.4 |
0.5 |
0.6 |
0.8 |
0.9 |
1.1 |
1.5 |
1.6 |
2.1 |
27.0% |
1.1% |
|
Bulgaria |
– |
– |
– |
† |
† |
† |
† |
† |
0.1 |
0.2 |
0.3 |
61.8% |
0.1% |
|
Czech Republic |
0.1 |
0.1 |
0.1 |
0.2 |
0.2 |
0.2 |
0.3 |
0.4 |
0.5 |
0.7 |
1.1 |
60.9% |
0.6% |
|
Denmark |
1.3 |
1.6 |
1.8 |
2.2 |
2.2 |
2.1 |
2.4 |
2.3 |
2.3 |
2.8 |
3.4 |
21.4% |
1.8% |
|
Finland |
1.9 |
2.0 |
2.1 |
2.4 |
2.2 |
2.5 |
2.3 |
2.4 |
2.0 |
2.5 |
2.6 |
1.7% |
1.3% |
|
France |
0.7 |
0.8 |
0.9 |
1.0 |
1.1 |
1.4 |
1.9 |
2.3 |
2.8 |
3.4 |
4.3 |
26.9% |
2.2% |
|
Germany |
3.6 |
5.0 |
6.2 |
8.2 |
9.6 |
11.7 |
15.2 |
16.4 |
16.9 |
18.9 |
23.2 |
22.9% |
11.9% |
|
Greece |
0.2 |
0.2 |
0.3 |
0.3 |
0.3 |
0.4 |
0.5 |
0.6 |
0.6 |
0.7 |
0.9 |
29.7% |
0.5% |
|
Hungary |
† |
† |
† |
0.2 |
0.4 |
0.3 |
0.3 |
0.5 |
0.6 |
0.6 |
0.7 |
3.4% |
0.3% |
|
Republic of Ireland |
0.1 |
0.1 |
0.1 |
0.2 |
0.3 |
0.4 |
0.5 |
0.6 |
0.7 |
0.7 |
1.1 |
51.3% |
0.5% |
|
Italy |
1.9 |
2.2 |
2.6 |
2.9 |
3.1 |
3.5 |
3.8 |
4.1 |
4.6 |
5.8 |
7.7 |
32.1% |
4.0% |
|
Kazakhstan |
– |
– |
– |
– |
– |
– |
– |
– |
– |
– |
– |
– |
– |
|
Lithuania |
† |
† |
† |
† |
† |
† |
† |
† |
0.1 |
0.1 |
0.1 |
67.1% |
0.1% |
|
Netherlands |
0.7 |
0.9 |
0.9 |
1.2 |
1.7 |
1.8 |
1.7 |
2.1 |
2.4 |
2.5 |
2.7 |
8.4% |
1.4% |
|
Norway |
0.1 |
0.1 |
0.2 |
0.2 |
0.2 |
0.3 |
0.3 |
0.3 |
0.3 |
0.3 |
0.4 |
29.3% |
0.2% |
|
Poland |
0.1 |
0.1 |
0.1 |
0.2 |
0.4 |
0.5 |
0.7 |
1.0 |
1.4 |
1.8 |
2.2 |
26.9% |
1.2% |
|
Portugal |
0.4 |
0.5 |
0.5 |
0.6 |
0.8 |
1.1 |
1.4 |
1.8 |
2.3 |
2.8 |
2.8 |
2.1% |
1.5% |
|
Romania |
– |
† |
† |
† |
† |
† |
† |
† |
† |
0.1 |
0.2 |
226.5% |
0.1% |
|
Russian Federation |
† |
† |
0.1 |
0.1 |
0.1 |
0.1 |
0.1 |
0.1 |
0.1 |
0.1 |
0.1 |
0.2% |
0.1% |
|
Slovakia |
† |
† |
† |
† |
† |
† |
0.1 |
0.1 |
0.1 |
0.1 |
0.1 |
1.8% |
0.1% |
|
Spain |
2.0 |
2.9 |
3.6 |
4.4 |
5.6 |
6.2 |
7.2 |
8.7 |
10.7 |
12.5 |
12.7 |
1.5% |
6.5% |
|
Sweden |
1.0 |
1.1 |
1.3 |
2.0 |
2.1 |
2.3 |
2.7 |
3.0 |
3.1 |
3.5 |
4.1 |
16.8% |
2.1% |
|
Switzerland |
0.2 |
0.2 |
0.2 |
0.2 |
0.2 |
0.3 |
0.3 |
0.3 |
0.3 |
0.3 |
0.3 |
5.4% |
0.2% |
|
Turkey |
0.1 |
0.1 |
0.1 |
0.1 |
0.1 |
0.1 |
0.2 |
0.3 |
0.5 |
0.9 |
1.3 |
46.6% |
0.7% |
|
Turkmenistan |
– |
– |
– |
– |
– |
– |
– |
– |
– |
– |
– |
– |
– |
|
Ukraine |
† |
† |
† |
† |
† |
† |
† |
† |
† |
† |
† |
40.0% |
♦ |
|
|
||||||||||||||
United Kingdom |
1.2 |
1.4 |
1.7 |
2.1 |
2.7 |
3.1 |
3.3 |
3.7 |
4.5 |
5.0 |
6.6 |
32.3% |
3.4% |
|
Uzbekistan |
– |
– |
– |
– |
– |
– |
– |
– |
– |
– |
– |
– |
– |
|
Other Europe & Eurasia |
0.4 |
0.4 |
0.4 |
0.4 |
0.5 |
0.7 |
0.9 |
1.1 |
1.2 |
1.3 |
1.4 |
12.3% |
0.7% |
|
Total Europe & Eurasia |
16.9 |
20.5 |
24.0 |
30.1 |
35.3 |
40.8 |
48.4 |
54.7 |
61.1 |
70.8 |
84.3 |
19.0% |
43.3% |
|
Iran |
– |
– |
– |
† |
† |
† |
† |
† |
0.1 |
0.1 |
0.1 |
– |
♦ |
|
Israel |
† |
† |
† |
† |
† |
† |
† |
† |
† |
† |
† |
133.7% |
♦ |
|
|
||||||||||||||
Kuwait |
– |
– |
– |
– |
– |
– |
– |
– |
– |
– |
– |
– |
– |
|
Qatar |
– |
– |
– |
– |
– |
– |
– |
– |
– |
– |
– |
– |
– |
|
Saudi Arabia |
– |
– |
– |
– |
– |
– |
– |
– |
– |
– |
– |
– |
– |
|
United Arab Emirates |
– |
– |
– |
– |
– |
– |
– |
– |
† |
† |
† |
– |
♦ |
|
|
||||||||||||||
Other Middle East |
† |
† |
† |
† |
† |
† |
† |
† |
† |
† |
† |
– |
♦ |
|
|
||||||||||||||
Total Middle East |
† |
† |
† |
† |
† |
† |
† |
† |
0.1 |
0.1 |
0.1 |
13.5% |
♦ |
|
|
||||||||||||||
Algeria |
– |
– |
– |
– |
– |
– |
– |
– |
– |
– |
– |
– |
– |
|
Egypt |
† |
† |
0.1 |
0.1 |
0.1 |
0.1 |
0.1 |
0.2 |
0.2 |
0.3 |
0.3 |
1.2% |
0.2% |
|
South Africa |
0.1 |
0.1 |
0.1 |
0.1 |
0.1 |
0.1 |
0.1 |
0.1 |
0.1 |
0.1 |
0.1 |
– |
♦ |
|
|
||||||||||||||
Other Africa |
0.3 |
0.4 |
0.5 |
0.5 |
0.5 |
0.6 |
0.6 |
0.6 |
0.7 |
0.9 |
0.9 |
0.5% |
0.4% |
|
Total Africa |
0.4 |
0.5 |
0.6 |
0.7 |
0.7 |
0.8 |
0.8 |
0.9 |
1.0 |
1.2 |
1.3 |
0.7% |
0.6% |
|
Australia |
0.3 |
0.3 |
0.4 |
0.4 |
0.5 |
0.7 |
0.9 |
1.2 |
1.5 |
1.8 |
2.2 |
23.5% |
1.1% |
|
Bangladesh |
† |
† |
† |
† |
† |
† |
† |
† |
† |
† |
† |
– |
♦ |
|
|
||||||||||||||
China |
0.7 |
0.7 |
0.8 |
0.9 |
1.0 |
1.4 |
1.8 |
3.6 |
6.9 |
11.9 |
17.7 |
48.4% |
9.1% |
|
China Hong Kong SAR |
– |
– |
– |
– |
– |
† |
† |
† |
† |
† |
† |
– |
♦ |
|
|
||||||||||||||
India |
0.9 |
1.0 |
1.2 |
1.9 |
2.3 |
3.3 |
4.0 |
4.8 |
6.3 |
7.6 |
9.2 |
20.6% |
4.7% |
|
Indonesia |
1.4 |
1.4 |
1.4 |
1.5 |
1.5 |
1.5 |
1.6 |
1.9 |
2.1 |
2.1 |
2.1 |
– |
1.1% |
|
Japan |
4.4 |
4.8 |
5.2 |
5.4 |
6.5 |
6.6 |
6.9 |
6.8 |
6.8 |
7.2 |
7.4 |
3.8% |
3.8% |
|
Malaysia |
– |
– |
– |
– |
– |
– |
† |
† |
† |
† |
† |
– |
♦ |
|
|
||||||||||||||
New Zealand |
0.8 |
0.8 |
0.7 |
0.8 |
1.0 |
1.0 |
1.1 |
1.3 |
1.6 |
1.8 |
2.0 |
6.8% |
1.0% |
|
Pakistan |
– |
– |
– |
– |
– |
– |
– |
– |
† |
† |
† |
– |
♦ |
|
|
||||||||||||||
Philippines |
2.3 |
2.3 |
2.1 |
2.3 |
2.2 |
2.4 |
2.3 |
2.4 |
2.4 |
2.3 |
2.3 |
1.3% |
1.2% |
|
Singapore |
† |
† |
† |
† |
† |
† |
† |
† |
† |
† |
† |
– |
♦ |
|
|
||||||||||||||
South Korea |
0.1 |
0.2 |
0.1 |
0.1 |
0.1 |
0.1 |
0.2 |
0.3 |
0.5 |
0.5 |
0.6 |
9.3% |
0.3% |
|
Taiwan |
0.5 |
0.7 |
0.7 |
0.7 |
0.7 |
0.8 |
0.9 |
0.9 |
0.9 |
1.0 |
1.2 |
10.5% |
0.6% |
|
Thailand |
0.4 |
0.5 |
0.7 |
0.8 |
0.9 |
0.9 |
1.1 |
1.2 |
1.3 |
1.4 |
1.6 |
10.5% |
0.8% |
|
Vietnam |
– |
– |
– |
– |
– |
– |
– |
† |
† |
† |
† |
60.0% |
♦ |
|
0.1% |
||||||||||||||
Other Asia Pacific |
† |
† |
† |
† |
0.1 |
0.1 |
0.1 |
0.1 |
0.1 |
0.1 |
0.1 |
– |
||
Total Asia Pacific |
11.8 |
12.6 |
13.4 |
14.9 |
16.9 |
18.9 |
21.1 |
24.6 |
30.5 |
37.9 |
46.4 |
22.4% |
23.8% |
|
Total World |
54.0 |
60.9 |
66.1 |
75.1 |
84.1 |
93.9 |
107.3 |
122.7 |
140.6 |
165.5 |
194.8 |
17.7% |
100.0% |
|
of which: OECD |
43.0 |
49.1 |
53.2 |
60.7 |
68.5 |
76.4 |
87.2 |
98.6 |
110.6 |
127.0 |
148.0 |
16.5% |
76.0% |
|
Non–OECD |
10.9 |
11.8 |
12.9 |
14.5 |
15.6 |
17.5 |
20.1 |
24.1 |
29.9 |
38.5 |
46.8 |
21.4% |
24.0% |
|
European Union |
16.2 |
19.8 |
23.2 |
29.2 |
34.3 |
39.5 |
46.7 |
52.7 |
58.8 |
68.1 |
80.9 |
18.9% |
41.5% |
|
Former Soviet Union |
† |
0.1 |
0.1 |
0.1 |
0.2 |
0.2 |
0.2 |
0.2 |
0.3 |
0.4 |
0.4 |
25.3% |
0.2% |
*Based on gross generation from renewable sources including wind, geothermal, solar, biomass and waste, and not accounting for cross-border electricity supply. Converted on the basis of thermal equivalence assuming 38% conversion efficiency in a modern thermal power station.
†Less than 0.05.Less than 0.05%.
Note: Other renewables data expressed in terawatt-hours is available at bp.com/statisticalreview.
38