BP energy
.pdfBiofuels production
|
|
|
|
|
|
|
|
|
|
|
|
Change |
2011 |
|
|
|
|
|
|
|
|
|
|
|
|
2011 over |
share |
Thousand tonnes oil equivalent |
2001 |
2002 |
2003 |
2004 |
2005 |
2006 |
2007 |
2008 |
2009 |
2010 |
2011 |
2010 |
of total |
US |
3288 |
3987 |
5226 |
6357 |
7478 |
9746 |
13456 |
19096 |
21670 |
25467 |
28251 |
10.9% |
48.0% |
Canada |
111 |
113 |
113 |
113 |
133 |
160 |
461 |
500 |
721 |
746 |
961 |
28.8% |
1.6% |
Total North America |
3399 |
4100 |
5339 |
6470 |
7612 |
9906 |
13922 |
19600 |
22395 |
26226 |
29224 |
11.4% |
49.6% |
Argentina |
9 |
9 |
9 |
9 |
9 |
29 |
228 |
632 |
1048 |
1656 |
2233 |
34.8% |
3.8% |
Brazil |
5600 |
6149 |
7068 |
7135 |
7835 |
8729 |
11323 |
14132 |
13962 |
15575 |
13196 |
-15.3% |
22.4% |
Colombia |
– |
– |
– |
– |
14 |
131 |
141 |
239 |
326 |
318 |
387 |
21.7% |
0.7% |
Other S. & Cent. America |
29 |
123 |
151 |
148 |
235 |
515 |
610 |
785 |
606 |
314 |
314 |
– |
0.5% |
Total S. & Cent. America |
5638 |
6280 |
7227 |
7291 |
8093 |
9405 |
12303 |
15788 |
15942 |
17863 |
16129 |
-9.7% |
27.4% |
Austria |
18 |
22 |
26 |
48 |
70 |
105 |
220 |
263 |
354 |
375 |
434 |
16.0% |
0.7% |
Belgium |
– |
– |
– |
– |
1 |
21 |
140 |
278 |
473 |
462 |
503 |
9.0% |
0.9% |
France |
315 |
337 |
368 |
385 |
439 |
665 |
1121 |
2012 |
2312 |
2008 |
1720 |
-14.4% |
2.9% |
Germany |
237 |
385 |
613 |
887 |
1525 |
2488 |
3181 |
2727 |
2728 |
2888 |
2839 |
-1.7% |
4.8% |
Italy |
123 |
180 |
232 |
272 |
340 |
585 |
443 |
617 |
758 |
670 |
456 |
-31.9% |
0.8% |
Netherlands |
– |
– |
– |
6 |
3 |
22 |
80 |
77 |
241 |
385 |
470 |
22.1% |
0.8% |
Poland |
– |
– |
28 |
6 |
109 |
144 |
96 |
279 |
393 |
421 |
386 |
-8.3% |
0.7% |
Portugal |
– |
– |
– |
– |
1 |
70 |
153 |
145 |
202 |
275 |
246 |
-10.5% |
0.4% |
Spain |
70 |
122 |
173 |
210 |
282 |
251 |
352 |
358 |
958 |
1267 |
777 |
-38.7% |
1.3% |
Finland |
– |
– |
– |
1 |
6 |
11 |
51 |
96 |
267 |
363 |
363 |
– |
0.6% |
Sweden |
14 |
31 |
32 |
43 |
48 |
81 |
139 |
171 |
238 |
214 |
212 |
-1.1% |
0.4% |
United Kingdom |
– |
3 |
9 |
9 |
39 |
219 |
359 |
275 |
180 |
304 |
293 |
-3.7% |
0.5% |
Other Europe & Eurasia |
113 |
126 |
138 |
164 |
293 |
389 |
485 |
898 |
1139 |
1178 |
1136 |
-3.6% |
1.9% |
Total Europe & Eurasia |
889 |
1206 |
1619 |
2031 |
3157 |
5052 |
6820 |
8196 |
10243 |
10811 |
9837 |
-9.0% |
16.7% |
Total Middle East |
– |
– |
– |
– |
– |
– |
– |
– |
– |
– |
– |
– |
– |
Total Africa |
6 |
6 |
6 |
6 |
6 |
6 |
6 |
10 |
14 |
29 |
29 |
– |
|
|
|||||||||||||
Australia |
– |
– |
– |
4 |
20 |
54 |
70 |
110 |
174 |
246 |
284 |
15.5% |
0.5% |
China |
4 |
146 |
396 |
492 |
622 |
846 |
901 |
1094 |
1124 |
1124 |
1149 |
2.2% |
2.0% |
India |
85 |
91 |
94 |
99 |
114 |
134 |
136 |
161 |
201 |
177 |
286 |
61.8% |
0.5% |
Malaysia |
– |
– |
– |
– |
– |
48 |
110 |
197 |
197 |
103 |
97 |
-6.0% |
0.2% |
South Korea |
– |
1 |
2 |
4 |
9 |
39 |
74 |
140 |
343 |
491 |
202 |
-58.8% |
0.3% |
Thailand |
– |
– |
– |
3 |
52 |
80 |
138 |
495 |
618 |
661 |
915 |
38.4% |
1.6% |
Other Asia Pacific |
– |
– |
– |
– |
18 |
78 |
133 |
270 |
549 |
726 |
716 |
-1.3% |
1.2% |
Total Asia Pacific |
89 |
238 |
491 |
603 |
834 |
1280 |
1563 |
2468 |
3207 |
3528 |
3649 |
3.4% |
6.2% |
Total World |
10021 |
11830 |
14682 |
16401 |
19701 |
25648 |
34613 |
46063 |
51802 |
58457 |
58868 |
0.7% |
100.0% |
of which: OECD |
4288 |
5307 |
6960 |
8499 |
10779 |
15015 |
20775 |
27818 |
32833 |
37465 |
39210 |
4.7% |
66.6% |
Non-OECD |
5733 |
6523 |
7722 |
7902 |
8922 |
10633 |
13839 |
18244 |
18968 |
20992 |
19659 |
-6.4% |
33.4% |
European Union |
889 |
1206 |
1619 |
2022 |
3133 |
5001 |
6743 |
8050 |
10059 |
10667 |
9693 |
-9.1% |
16.5% |
Former Soviet Union |
– |
– |
– |
11 |
22 |
28 |
50 |
129 |
210 |
179 |
197 |
10.1% |
0.3% |
Less than 0.05%.
Note: Consumption of fuel ethanol and biodiesel is included in oil consumption.
Source: Includes data from F.O. Lichts; US Energy Information Administration.
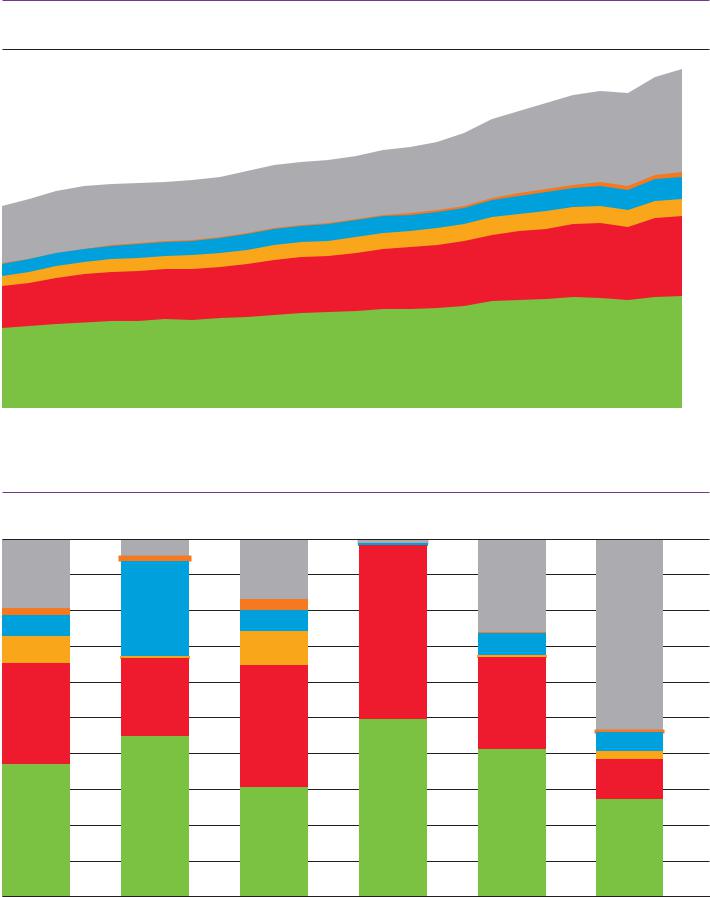
World biofuels production
Million tonnes oil equivalent
|
Rest of World |
60 |
|
 Europe & Eurasia
 S. & Cent. America
 North America
40
20
01 |
03 |
05 |
07 |
09 |
11 |
0 |
|
Ethanol 2001 |
30 |
|
||
|
Ethanol 2011 |
|
|
|
 Biodiesel 2001
|
|
Biodiesel 2011 |
|
|
|
|
|
|
20 |
|
|
|
|
10 |
North America |
S. & Cent. America |
Europe & Eurasia |
Rest of World |
0 |
World biofuels production grew by 0.7% in 2011, the smallest increase since 2000. Increased output in North America was offset by declines in South & Central America and Europe. Biodiesel accounts for just 27.5% of global biofuels output, but accounted for all of the growth in global biofuels output. Global ethanol output declined by 1.4%.
39

 Primary energy
Consumption*
|
|
|
|
|
|
|
|
|
|
|
|
Change |
2011 |
|
|
|
|
|
|
|
|
|
|
|
|
2011 over |
share of |
Million tonnes oil equivalent |
2001 |
2002 |
2003 |
2004 |
2005 |
2006 |
2007 |
2008 |
2009 |
2010 |
2011 |
2010 |
total |
US |
2259.7 |
2295.5 |
2302.3 |
2348.8 |
2351.2 |
2332.7 |
2372.7 |
2320.2 |
2205.9 |
2277.9 |
2269.3 |
-0.4% |
18.5% |
Canada |
298.2 |
303.1 |
305.9 |
313.8 |
326.8 |
321.7 |
327.5 |
327.7 |
314.0 |
315.7 |
330.3 |
4.6% |
2.7% |
Mexico |
140.9 |
140.7 |
147.7 |
155.1 |
161.1 |
164.6 |
168.4 |
170.8 |
166.6 |
170.4 |
173.7 |
2.0% |
1.4% |
Total North America |
2698.8 |
2739.3 |
2756.0 |
2817.7 |
2839.2 |
2819.0 |
2868.6 |
2818.7 |
2686.5 |
2763.9 |
2773.3 |
0.3% |
22.6% |
Argentina |
59.4 |
56.7 |
61.1 |
64.4 |
68.8 |
71.4 |
74.4 |
76.2 |
75.1 |
77.1 |
81.9 |
6.2% |
0.7% |
Brazil |
182.3 |
186.2 |
190.3 |
200.1 |
207.0 |
212.6 |
225.6 |
235.9 |
234.3 |
258.0 |
266.9 |
3.5% |
2.2% |
Chile |
24.8 |
25.1 |
25.6 |
27.2 |
28.4 |
29.6 |
29.9 |
29.3 |
28.8 |
29.2 |
30.9 |
6.2% |
0.3% |
Colombia |
25.6 |
25.5 |
26.2 |
27.1 |
28.3 |
29.3 |
30.0 |
30.9 |
31.3 |
32.8 |
35.1 |
6.9% |
0.3% |
Ecuador |
8.2 |
8.7 |
8.9 |
9.2 |
9.8 |
10.7 |
11.0 |
11.7 |
11.5 |
12.7 |
13.2 |
3.9% |
0.1% |
Peru |
11.8 |
12.1 |
12.0 |
12.8 |
13.4 |
13.6 |
14.9 |
16.2 |
16.6 |
18.8 |
20.7 |
10.2% |
0.2% |
Trinidad & Tobago |
11.8 |
12.7 |
14.1 |
13.2 |
14.8 |
19.6 |
19.9 |
21.6 |
20.5 |
22.1 |
21.5 |
-2.8% |
0.2% |
Venezuela |
69.2 |
69.4 |
61.4 |
68.6 |
71.0 |
77.1 |
77.4 |
81.3 |
81.8 |
85.4 |
89.1 |
4.4% |
0.7% |
Other S. & Cent. America |
75.4 |
76.8 |
79.5 |
79.8 |
80.3 |
82.4 |
85.3 |
84.1 |
82.6 |
83.1 |
83.3 |
0.3% |
0.7% |
Total S. & Cent. America |
468.4 |
473.2 |
479.0 |
502.5 |
521.8 |
546.3 |
568.4 |
587.3 |
582.6 |
619.0 |
642.5 |
3.8% |
5.2% |
Austria |
33.5 |
33.2 |
34.6 |
34.0 |
34.6 |
34.0 |
33.4 |
34.4 |
33.8 |
33.8 |
32.0 |
-5.4% |
0.3% |
Azerbaijan |
11.1 |
10.9 |
11.8 |
12.6 |
13.8 |
13.6 |
12.3 |
12.3 |
10.9 |
10.7 |
11.5 |
8.0% |
0.1% |
Belarus |
21.5 |
21.7 |
21.3 |
23.4 |
23.8 |
25.3 |
24.4 |
25.7 |
24.0 |
25.1 |
25.5 |
1.6% |
0.2% |
Belgium |
61.9 |
62.3 |
65.2 |
64.9 |
64.5 |
64.7 |
65.0 |
67.1 |
62.7 |
66.3 |
63.3 |
-4.5% |
0.5% |
Bulgaria |
18.7 |
18.1 |
19.2 |
18.9 |
19.4 |
19.8 |
19.2 |
19.3 |
16.9 |
17.8 |
19.2 |
8.0% |
0.2% |
Czech Republic |
41.6 |
41.6 |
43.7 |
45.3 |
45.4 |
46.1 |
45.5 |
44.5 |
41.8 |
43.4 |
44.0 |
1.2% |
0.4% |
Denmark |
20.0 |
19.9 |
21.4 |
20.5 |
19.8 |
21.9 |
20.9 |
20.1 |
18.8 |
19.6 |
18.7 |
-4.3% |
0.2% |
Finland |
28.2 |
28.2 |
30.4 |
30.4 |
28.1 |
29.4 |
29.4 |
28.7 |
26.7 |
28.9 |
27.7 |
-4.2% |
0.2% |
France |
258.4 |
255.4 |
259.3 |
263.6 |
261.2 |
259.2 |
256.7 |
257.8 |
244.0 |
251.8 |
242.9 |
-3.5% |
2.0% |
Germany |
338.8 |
334.0 |
337.1 |
337.3 |
333.2 |
339.5 |
324.4 |
326.7 |
307.5 |
322.4 |
306.4 |
-5.0% |
2.5% |
Greece |
32.1 |
33.0 |
32.7 |
34.2 |
33.9 |
34.9 |
34.9 |
34.5 |
33.1 |
31.7 |
30.5 |
-3.9% |
0.2% |
Hungary |
24.1 |
23.4 |
23.9 |
24.0 |
25.7 |
25.4 |
25.0 |
24.8 |
22.8 |
23.4 |
22.6 |
-3.3% |
0.2% |
Republic of Ireland |
14.7 |
14.5 |
14.2 |
14.6 |
15.1 |
15.5 |
15.9 |
15.7 |
14.4 |
14.4 |
13.6 |
-6.1% |
0.1% |
Italy |
176.9 |
175.4 |
181.0 |
184.6 |
185.1 |
184.6 |
181.8 |
180.4 |
168.1 |
173.1 |
168.5 |
-2.6% |
1.4% |
Kazakhstan |
39.3 |
40.9 |
44.6 |
44.6 |
47.2 |
50.7 |
52.4 |
53.5 |
50.2 |
50.2 |
50.5 |
0.5% |
0.4% |
Lithuania |
8.1 |
8.6 |
9.1 |
9.2 |
8.4 |
8.1 |
8.7 |
8.7 |
8.0 |
6.1 |
6.4 |
4.7% |
0.1% |
Netherlands |
90.7 |
91.1 |
91.9 |
95.0 |
97.2 |
97.3 |
98.5 |
97.4 |
95.7 |
100.5 |
95.8 |
-4.7% |
0.8% |
Norway |
42.0 |
43.6 |
39.2 |
39.9 |
46.0 |
42.4 |
46.1 |
47.1 |
43.9 |
42.1 |
43.4 |
3.2% |
0.4% |
Poland |
88.9 |
87.7 |
90.1 |
91.7 |
91.5 |
94.9 |
95.8 |
96.3 |
92.3 |
99.6 |
102.8 |
3.2% |
0.8% |
Portugal |
25.4 |
25.5 |
25.8 |
25.4 |
25.6 |
25.5 |
25.4 |
24.1 |
24.6 |
25.5 |
24.4 |
-4.5% |
0.2% |
Romania |
37.3 |
38.6 |
37.8 |
39.0 |
39.8 |
40.6 |
37.5 |
38.5 |
34.0 |
34.1 |
34.8 |
2.1% |
0.3% |
Russian Federation |
623.3 |
625.8 |
644.9 |
651.4 |
650.7 |
670.3 |
673.8 |
679.3 |
644.4 |
668.7 |
685.6 |
2.5% |
5.6% |
Slovakia |
18.6 |
18.7 |
18.1 |
17.6 |
18.8 |
17.8 |
17.2 |
17.7 |
16.0 |
17.0 |
17.1 |
0.4% |
0.1% |
Spain |
135.3 |
137.5 |
145.3 |
151.3 |
153.8 |
155.2 |
159.8 |
155.6 |
145.2 |
149.2 |
145.9 |
-2.2% |
1.2% |
Sweden |
54.1 |
50.8 |
48.5 |
52.3 |
54.0 |
51.0 |
52.0 |
51.7 |
47.2 |
50.7 |
50.5 |
-0.4% |
0.4% |
Switzerland |
31.3 |
29.3 |
29.1 |
28.8 |
27.7 |
28.9 |
28.6 |
29.7 |
29.7 |
29.0 |
27.6 |
-4.9% |
0.2% |
Turkey |
68.1 |
73.1 |
78.1 |
82.9 |
86.0 |
96.2 |
103.1 |
102.7 |
102.8 |
108.8 |
118.8 |
9.2% |
1.0% |
Turkmenistan |
15.0 |
15.4 |
17.2 |
17.8 |
18.8 |
20.7 |
23.8 |
23.6 |
22.6 |
25.1 |
27.4 |
9.1% |
0.2% |
Ukraine |
135.1 |
133.0 |
136.6 |
137.5 |
136.1 |
137.5 |
135.4 |
131.9 |
112.2 |
120.9 |
126.4 |
4.6% |
1.0% |
United Kingdom |
226.6 |
221.7 |
225.4 |
227.3 |
228.2 |
225.5 |
218.3 |
214.8 |
203.7 |
209.0 |
198.2 |
-5.2% |
1.6% |
Uzbekistan |
53.6 |
55.0 |
50.6 |
48.5 |
46.0 |
45.9 |
48.7 |
52.3 |
46.9 |
48.9 |
52.2 |
6.8% |
0.4% |
Other Europe & Eurasia |
78.0 |
80.6 |
84.6 |
89.4 |
89.7 |
87.2 |
88.8 |
89.7 |
86.2 |
90.8 |
89.1 |
-1.8% |
0.7% |
Total Europe & Eurasia |
2852.1 |
2848.7 |
2912.7 |
2958.1 |
2969.0 |
3009.4 |
3002.6 |
3006.5 |
2831.0 |
2938.7 |
2923.4 |
-0.5% |
23.8% |
Iran |
130.9 |
144.1 |
152.0 |
158.4 |
179.2 |
189.3 |
195.1 |
200.9 |
212.6 |
223.0 |
228.6 |
2.5% |
1.9% |
Israel |
19.7 |
20.1 |
20.7 |
21.0 |
21.6 |
21.8 |
22.9 |
23.8 |
23.3 |
23.7 |
23.5 |
-0.7% |
0.2% |
Kuwait |
21.6 |
21.7 |
25.5 |
28.5 |
30.5 |
29.0 |
28.8 |
29.2 |
28.4 |
32.1 |
33.6 |
4.8% |
0.3% |
Qatar |
12.3 |
13.0 |
14.1 |
17.0 |
20.8 |
22.3 |
22.8 |
23.6 |
24.2 |
25.7 |
29.4 |
14.1% |
0.2% |
Saudi Arabia |
123.0 |
127.6 |
135.8 |
147.4 |
151.6 |
157.8 |
164.4 |
178.5 |
186.0 |
202.1 |
217.1 |
7.4% |
1.8% |
United Arab Emirates |
53.7 |
53.1 |
56.5 |
60.4 |
62.6 |
65.6 |
72.7 |
83.1 |
80.6 |
83.6 |
87.2 |
4.2% |
0.7% |
Other Middle East |
83.9 |
85.3 |
81.7 |
90.0 |
96.1 |
101.6 |
104.8 |
113.1 |
116.3 |
126.3 |
128.1 |
1.5% |
1.0% |
Total Middle East |
445.1 |
464.9 |
486.3 |
522.6 |
562.5 |
587.4 |
611.6 |
652.3 |
671.5 |
716.5 |
747.5 |
4.3% |
6.1% |
Algeria |
27.7 |
28.6 |
30.0 |
31.1 |
32.6 |
33.5 |
35.4 |
37.5 |
39.6 |
38.6 |
40.9 |
6.2% |
0.3% |
Egypt |
52.6 |
53.6 |
57.0 |
59.6 |
62.5 |
65.8 |
69.9 |
74.1 |
77.0 |
81.0 |
82.6 |
2.0% |
0.7% |
South Africa |
100.1 |
103.4 |
109.5 |
115.7 |
113.5 |
115.4 |
121.9 |
126.8 |
121.0 |
124.4 |
126.3 |
1.5% |
1.0% |
Other Africa |
99.6 |
102.4 |
105.2 |
114.3 |
118.3 |
116.6 |
122.6 |
129.7 |
128.0 |
138.2 |
134.7 |
-2.6% |
1.1% |
Total Africa |
280.1 |
288.0 |
301.8 |
320.7 |
327.0 |
331.2 |
349.8 |
368.0 |
365.7 |
382.2 |
384.5 |
0.6% |
3.1% |
Australia |
110.0 |
113.1 |
111.9 |
114.3 |
117.8 |
123.8 |
124.0 |
124.0 |
123.7 |
115.0 |
123.3 |
7.2% |
1.0% |
Bangladesh |
14.1 |
14.8 |
15.6 |
16.1 |
17.6 |
18.5 |
19.6 |
20.8 |
22.5 |
24.1 |
24.3 |
0.6% |
0.2% |
China |
1041.4 |
1105.8 |
1277.3 |
1512.5 |
1659.0 |
1831.9 |
1951.0 |
2041.7 |
2210.3 |
2402.9 |
2613.2 |
8.8% |
21.3% |
China Hong Kong SAR |
19.4 |
20.8 |
21.2 |
24.3 |
22.9 |
24.7 |
26.2 |
24.5 |
27.0 |
27.7 |
28.6 |
3.0% |
0.2% |
India |
297.4 |
308.8 |
317.4 |
345.8 |
364.5 |
382.1 |
415.5 |
445.9 |
487.6 |
520.5 |
559.1 |
7.4% |
4.6% |
Indonesia |
102.8 |
107.5 |
116.4 |
115.4 |
118.8 |
121.5 |
129.4 |
123.3 |
133.6 |
148.8 |
148.2 |
-0.4% |
1.2% |
Japan |
512.8 |
510.3 |
511.0 |
522.4 |
527.1 |
527.6 |
522.9 |
515.3 |
474.0 |
503.0 |
477.6 |
-5.0% |
3.9% |
Malaysia |
49.1 |
52.2 |
54.6 |
54.5 |
60.1 |
63.7 |
67.7 |
69.2 |
69.0 |
70.7 |
69.2 |
-2.1% |
0.6% |
New Zealand |
18.5 |
19.3 |
18.7 |
19.4 |
18.8 |
19.0 |
19.0 |
19.1 |
19.1 |
19.7 |
19.4 |
-1.3% |
0.2% |
Pakistan |
45.5 |
47.4 |
52.4 |
56.8 |
58.9 |
61.8 |
65.1 |
64.8 |
66.9 |
67.9 |
67.6 |
-0.4% |
0.6% |
Philippines |
25.1 |
25.8 |
26.5 |
27.4 |
27.6 |
25.9 |
27.1 |
27.0 |
27.3 |
26.7 |
27.7 |
3.5% |
0.2% |
Singapore |
37.2 |
38.7 |
37.6 |
42.7 |
48.5 |
51.5 |
56.8 |
59.5 |
63.4 |
68.1 |
70.4 |
3.4% |
0.6% |
South Korea |
193.9 |
203.1 |
209.8 |
213.8 |
220.8 |
222.9 |
231.9 |
236.4 |
237.4 |
255.6 |
263.0 |
2.9% |
2.1% |
Taiwan |
91.0 |
95.2 |
99.6 |
105.0 |
107.3 |
108.9 |
113.9 |
106.8 |
104.4 |
110.6 |
109.9 |
-0.6% |
0.9% |
Thailand |
69.1 |
74.2 |
79.1 |
84.6 |
88.9 |
90.5 |
94.5 |
95.9 |
98.3 |
104.3 |
106.0 |
1.6% |
0.9% |
Vietnam |
19.9 |
21.4 |
22.5 |
28.7 |
29.8 |
32.3 |
34.9 |
36.7 |
42.1 |
43.7 |
45.9 |
5.0% |
0.4% |
Other Asia Pacific |
42.2 |
41.3 |
43.0 |
44.3 |
46.8 |
48.7 |
47.3 |
48.8 |
47.7 |
48.2 |
49.9 |
3.5% |
0.4% |
Total Asia Pacific |
2689.5 |
2799.8 |
3014.5 |
3328.0 |
3535.0 |
3755.2 |
3946.7 |
4059.9 |
4254.1 |
4557.6 |
4803.3 |
5.4% |
39.1% |
Total World |
9434.0 |
9613.9 |
9950.2 |
10449.6 |
10754.5 |
11048.4 |
11347.6 |
11492.8 |
11391.3 |
11977.8 |
12274.6 |
2.5% |
100.0% |
of which: OECD |
5407.4 |
5448.4 |
5507.0 |
5621.8 |
5668.9 |
5673.7 |
5718.4 |
5660.9 |
5388.6 |
5572.4 |
5527.7 |
-0.8% |
45.0% |
Non-OECD |
4026.6 |
4165.4 |
4443.1 |
4827.8 |
5085.5 |
5374.8 |
5629.2 |
5831.8 |
6002.7 |
6405.3 |
6746.9 |
5.3% |
55.0% |
European Union |
1756.4 |
1742.2 |
1778.5 |
1806.7 |
1808.7 |
1816.0 |
1791.3 |
1785.2 |
1682.0 |
1744.8 |
1690.7 |
-3.1% |
13.8% |
Former Soviet Union |
931.3 |
935.3 |
961.8 |
972.0 |
973.1 |
1000.0 |
1009.8 |
1016.0 |
945.9 |
984.9 |
1015.1 |
3.1% |
8.3% |
*In this review, primary energy comprises commercially traded fuels, including modern renewables used to generate electricity. Note: Oil consumption is measured in million tonnes; other fuels in million tonnes of oil equivalent.
40

Consumption by fuel*
|
|
|
|
|
2010 |
|
|
|
|
|
|
|
|
|
|
|
2011 |
|
|
|
|
|
|
|
Natural |
|
Nuclear |
Hydro- |
Renew- |
|
|
|
|
|
Natural |
|
Nuclear |
Hydro- |
Renew- |
|
|
||
Million tonnes oil equivalent |
|
Oil |
gas |
Coal |
energy |
electricity |
ables |
Total |
|
|
Oil |
gas |
Coal |
energy |
electricity |
ables |
Total |
||||
US |
849.9 |
611.2 |
526.1 |
192.2 |
59.5 |
38.9 |
2277.9 |
|
833.6 |
626.0 |
501.9 |
188.2 |
74.3 |
45.3 |
2269.3 |
||||||
Canada |
102.7 |
85.5 |
24.0 |
20.3 |
79.4 |
3.8 |
315.7 |
|
103.1 |
94.3 |
21.8 |
21.4 |
85.2 |
4.4 |
330.3 |
||||||
Mexico |
88.5 |
61.1 |
9.4 |
1.3 |
8.3 |
1.7 |
170.4 |
|
89.7 |
62.0 |
9.9 |
2.3 |
8.1 |
1.8 |
173.7 |
||||||
Total North America |
1041.1 |
757.9 |
559.5 |
213.8 |
147.2 |
44.4 |
2763.9 |
|
1026.4 |
782.4 |
533.7 |
211.9 |
167.6 |
51.4 |
2773.3 |
||||||
Argentina |
25.9 |
39.0 |
1.0 |
1.6 |
9.2 |
0.4 |
77.1 |
|
28.1 |
41.9 |
1.1 |
1.4 |
9.0 |
0.4 |
81.9 |
||||||
Brazil |
118.0 |
24.1 |
13.9 |
3.3 |
91.2 |
7.3 |
258.0 |
|
120.7 |
24.0 |
13.9 |
3.5 |
97.2 |
7.5 |
266.9 |
||||||
Chile |
14.8 |
4.2 |
4.2 |
|
– |
4.9 |
1.0 |
29.2 |
|
15.2 |
4.7 |
5.3 |
|
– |
4.7 |
1.0 |
30.9 |
||||
Colombia |
11.4 |
8.2 |
4.0 |
|
– |
9.1 |
0.2 |
32.8 |
|
11.7 |
8.1 |
4.3 |
|
– |
10.9 |
0.2 |
35.1 |
||||
Ecuador |
10.3 |
0.4 |
– |
|
– |
2.0 |
0.1 |
12.7 |
|
10.5 |
0.4 |
– |
|
– |
2.2 |
0.1 |
13.2 |
||||
Peru |
8.5 |
4.9 |
0.8 |
|
– |
4.5 |
0.1 |
18.8 |
|
9.2 |
5.6 |
0.8 |
|
– |
4.9 |
0.1 |
20.7 |
||||
Trinidad & Tobago |
1.7 |
20.3 |
– |
|
– |
– |
† |
22.1 |
|
1.7 |
19.8 |
– |
|
– |
– |
† |
21.5 |
||||
Venezuela |
36.9 |
29.2 |
1.9 |
|
– |
17.4 |
– |
85.4 |
|
38.3 |
29.8 |
2.0 |
|
– |
18.9 |
– |
89.1 |
||||
Other S. & Cent. America |
53.5 |
4.9 |
2.4 |
|
– |
20.3 |
2.0 |
83.1 |
|
53.7 |
4.7 |
2.4 |
|
– |
20.4 |
2.0 |
83.3 |
||||
Total S. & Cent. America |
281.0 |
135.2 |
28.2 |
4.9 |
158.6 |
11.1 |
619.0 |
|
289.1 |
139.1 |
29.8 |
4.9 |
168.2 |
11.3 |
642.5 |
||||||
Austria |
12.9 |
9.1 |
2.6 |
|
– |
7.7 |
1.5 |
33.8 |
|
12.5 |
8.5 |
2.5 |
|
– |
6.9 |
1.6 |
32.0 |
||||
Azerbaijan |
3.2 |
6.7 |
† |
|
– |
0.8 |
† |
10.7 |
|
3.6 |
7.3 |
† |
|
– |
0.6 |
† |
11.5 |
||||
Belarus |
7.3 |
17.7 |
† |
|
– |
† |
† |
25.1 |
|
9.0 |
16.5 |
† |
|
– |
† |
† |
25.5 |
||||
Belgium |
33.5 |
17.0 |
3.3 |
10.8 |
0.1 |
1.6 |
66.3 |
|
33.7 |
14.4 |
2.1 |
10.9 |
† |
2.1 |
63.3 |
||||||
Bulgaria |
3.8 |
2.3 |
6.8 |
3.5 |
1.3 |
0.2 |
17.8 |
|
3.5 |
2.6 |
8.4 |
3.7 |
0.6 |
0.3 |
19.2 |
||||||
Czech Republic |
9.1 |
8.4 |
18.2 |
6.3 |
0.8 |
0.7 |
43.4 |
|
9.1 |
7.6 |
19.2 |
6.4 |
0.6 |
1.1 |
44.0 |
||||||
Denmark |
8.4 |
4.5 |
3.8 |
|
– |
† |
2.8 |
19.6 |
|
8.3 |
3.8 |
3.2 |
|
– |
† |
3.4 |
18.7 |
||||
Finland |
10.4 |
3.6 |
4.3 |
5.2 |
2.9 |
2.5 |
28.9 |
|
10.5 |
3.2 |
3.3 |
5.3 |
2.8 |
2.6 |
27.7 |
||||||
France |
84.4 |
42.2 |
10.7 |
96.9 |
14.2 |
3.4 |
251.8 |
|
82.9 |
36.3 |
9.0 |
100.0 |
10.3 |
4.3 |
242.9 |
||||||
Germany |
115.4 |
75.0 |
76.6 |
31.8 |
4.8 |
18.9 |
322.4 |
|
111.5 |
65.3 |
77.6 |
24.4 |
4.4 |
23.2 |
306.4 |
||||||
Greece |
18.7 |
3.3 |
7.4 |
|
– |
1.7 |
0.7 |
31.7 |
|
17.2 |
4.1 |
7.3 |
|
– |
1.0 |
0.9 |
30.5 |
||||
Hungary |
6.7 |
9.8 |
2.6 |
3.6 |
† |
0.6 |
23.4 |
|
6.5 |
9.1 |
2.7 |
3.5 |
0.1 |
0.7 |
22.6 |
||||||
Republic of Ireland |
7.6 |
4.7 |
1.2 |
|
– |
0.1 |
0.7 |
14.4 |
|
6.8 |
4.2 |
1.3 |
|
– |
0.2 |
1.1 |
13.6 |
||||
Italy |
73.1 |
68.5 |
14.3 |
|
– |
11.5 |
5.8 |
173.1 |
|
71.1 |
64.2 |
15.4 |
|
– |
10.1 |
7.7 |
168.5 |
||||
Kazakhstan |
9.5 |
7.4 |
31.6 |
|
– |
1.8 |
– |
50.2 |
|
10.2 |
8.3 |
30.2 |
|
– |
1.8 |
– |
50.5 |
||||
Lithuania |
2.7 |
2.8 |
0.2 |
|
– |
0.3 |
0.1 |
6.1 |
|
2.7 |
3.1 |
0.2 |
|
– |
0.2 |
0.1 |
6.4 |
||||
Netherlands |
49.9 |
39.2 |
7.9 |
0.9 |
† |
2.5 |
100.5 |
|
50.1 |
34.3 |
7.8 |
0.9 |
† |
2.7 |
95.8 |
||||||
Norway |
10.8 |
3.7 |
0.6 |
|
– |
26.7 |
0.3 |
42.1 |
|
11.1 |
3.6 |
0.6 |
|
– |
27.6 |
0.4 |
43.4 |
||||
Poland |
26.7 |
14.0 |
56.4 |
|
– |
0.8 |
1.8 |
99.6 |
|
26.3 |
13.8 |
59.8 |
|
– |
0.6 |
2.2 |
102.8 |
||||
Portugal |
12.5 |
4.5 |
1.9 |
|
– |
3.8 |
2.8 |
25.5 |
|
11.6 |
4.6 |
2.6 |
|
– |
2.8 |
2.8 |
24.4 |
||||
Romania |
8.7 |
12.2 |
6.1 |
2.6 |
4.5 |
0.1 |
34.1 |
|
9.0 |
12.5 |
7.1 |
2.7 |
3.4 |
0.2 |
34.8 |
||||||
Russian Federation |
128.9 |
372.7 |
90.2 |
38.5 |
38.1 |
0.1 |
668.7 |
|
136.0 |
382.1 |
90.9 |
39.2 |
37.3 |
0.1 |
685.6 |
||||||
Slovakia |
3.9 |
5.0 |
3.4 |
3.3 |
1.3 |
0.1 |
17.0 |
|
3.7 |
5.6 |
3.3 |
3.4 |
0.9 |
0.1 |
17.1 |
||||||
Spain |
72.1 |
31.2 |
9.8 |
14.0 |
9.6 |
12.5 |
149.2 |
|
69.5 |
28.9 |
14.9 |
13.0 |
6.9 |
12.7 |
145.9 |
||||||
Sweden |
15.3 |
1.4 |
2.1 |
13.2 |
15.1 |
3.5 |
50.7 |
|
14.5 |
1.1 |
2.0 |
13.8 |
15.0 |
4.1 |
50.5 |
||||||
Switzerland |
11.4 |
3.0 |
0.1 |
6.0 |
8.2 |
0.3 |
29.0 |
|
11.0 |
2.6 |
0.1 |
6.1 |
7.4 |
0.3 |
27.6 |
||||||
Turkey |
30.2 |
35.1 |
30.9 |
|
– |
11.7 |
0.9 |
108.8 |
|
32.0 |
41.2 |
32.4 |
|
– |
11.8 |
1.3 |
118.8 |
||||
Turkmenistan |
4.8 |
20.4 |
– |
|
– |
† |
– |
25.1 |
|
4.9 |
22.5 |
– |
|
– |
† |
– |
27.4 |
||||
Ukraine |
13.0 |
46.9 |
37.9 |
20.2 |
2.9 |
† |
120.9 |
|
12.9 |
48.3 |
42.4 |
20.4 |
2.4 |
† |
126.4 |
||||||
United Kingdom |
73.5 |
84.6 |
31.0 |
14.1 |
0.8 |
5.0 |
209.0 |
|
71.6 |
72.2 |
30.8 |
15.6 |
1.3 |
6.6 |
198.2 |
||||||
Uzbekistan |
4.3 |
41.0 |
1.3 |
|
– |
2.3 |
– |
48.9 |
|
4.4 |
44.2 |
1.3 |
|
– |
2.3 |
– |
52.2 |
||||
Other Europe & Eurasia |
30.4 |
14.5 |
20.1 |
1.8 |
22.7 |
1.3 |
90.8 |
|
30.3 |
14.9 |
20.8 |
2.0 |
19.7 |
1.4 |
89.1 |
||||||
Total Europe & Eurasia |
903.1 |
1012.2 |
483.3 |
272.9 |
196.4 |
70.8 |
2938.7 |
|
898.2 |
991.0 |
499.2 |
271.5 |
179.1 |
84.3 |
2923.4 |
||||||
Iran |
89.8 |
130.1 |
0.8 |
|
– |
2.2 |
0.1 |
223.0 |
|
87.0 |
138.0 |
0.8 |
|
† |
2.7 |
0.1 |
228.6 |
||||
Israel |
11.2 |
4.8 |
7.7 |
|
– |
– |
† |
23.7 |
|
11.1 |
4.5 |
7.9 |
|
– |
– |
† |
23.5 |
||||
Kuwait |
19.0 |
13.1 |
– |
|
– |
– |
– |
32.1 |
|
19.0 |
14.6 |
– |
|
– |
– |
– |
33.6 |
||||
Qatar |
7.4 |
18.4 |
– |
|
– |
– |
– |
25.7 |
|
8.0 |
21.4 |
– |
|
– |
– |
– |
29.4 |
||||
Saudi Arabia |
123.2 |
78.9 |
– |
|
– |
– |
– |
202.1 |
|
127.8 |
89.3 |
– |
|
– |
– |
– |
217.1 |
||||
United Arab Emirates |
28.9 |
54.7 |
– |
|
– |
– |
† |
83.6 |
|
30.5 |
56.6 |
– |
|
– |
– |
† |
87.2 |
||||
Other Middle East |
84.7 |
39.6 |
– |
|
– |
1.9 |
† |
126.3 |
|
87.5 |
38.4 |
– |
|
– |
2.3 |
† |
128.1 |
||||
Total Middle East |
364.3 |
339.5 |
8.5 |
|
– |
4.1 |
0.1 |
716.5 |
|
371.0 |
362.8 |
8.7 |
|
† |
5.0 |
0.1 |
747.5 |
||||
Algeria |
14.8 |
23.7 |
– |
|
– |
† |
– |
38.6 |
|
15.6 |
25.2 |
– |
|
– |
0.1 |
– |
40.9 |
||||
Egypt |
36.3 |
40.6 |
0.9 |
|
– |
2.9 |
0.3 |
81.0 |
|
33.7 |
44.7 |
0.9 |
|
– |
3.1 |
0.3 |
82.6 |
||||
South Africa |
26.1 |
3.5 |
91.3 |
3.1 |
0.3 |
0.1 |
124.4 |
|
26.2 |
3.8 |
92.9 |
2.9 |
0.4 |
0.1 |
126.3 |
||||||
Other Africa |
83.4 |
28.4 |
5.9 |
|
– |
19.7 |
0.9 |
138.2 |
|
82.9 |
25.1 |
6.0 |
|
– |
19.8 |
0.9 |
134.7 |
||||
Total Africa |
160.6 |
96.2 |
98.1 |
3.1 |
23.0 |
1.2 |
382.2 |
|
158.3 |
98.8 |
99.8 |
2.9 |
23.5 |
1.3 |
384.5 |
||||||
Australia |
43.4 |
23.1 |
43.8 |
|
– |
2.8 |
1.8 |
115.0 |
|
45.9 |
23.0 |
49.8 |
|
– |
2.4 |
2.2 |
123.3 |
||||
Bangladesh |
4.9 |
17.9 |
0.9 |
|
– |
0.3 |
† |
24.1 |
|
5.0 |
17.9 |
1.0 |
|
– |
0.3 |
† |
24.3 |
||||
China |
437.7 |
96.8 |
1676.2 |
16.7 |
163.4 |
11.9 |
2402.9 |
|
461.8 |
117.6 |
1839.4 |
19.5 |
157.0 |
17.7 |
2613.2 |
||||||
China Hong Kong SAR |
17.9 |
3.4 |
6.3 |
|
– |
– |
† |
27.7 |
|
18.1 |
2.7 |
7.7 |
|
– |
– |
† |
28.6 |
||||
India |
156.2 |
55.7 |
270.8 |
5.2 |
25.0 |
7.6 |
520.5 |
|
162.3 |
55.0 |
295.6 |
7.3 |
29.8 |
9.2 |
559.1 |
||||||
Indonesia |
65.2 |
36.3 |
41.2 |
|
– |
4.0 |
2.1 |
148.8 |
|
64.4 |
34.1 |
44.0 |
|
– |
3.5 |
2.1 |
148.2 |
||||
Japan |
200.3 |
85.1 |
123.7 |
66.2 |
20.6 |
7.2 |
503.0 |
|
201.4 |
95.0 |
117.7 |
36.9 |
19.2 |
7.4 |
477.6 |
||||||
Malaysia |
26.7 |
28.7 |
13.8 |
|
– |
1.6 |
† |
70.7 |
|
26.9 |
25.7 |
15.0 |
|
– |
1.7 |
† |
69.2 |
||||
New Zealand |
7.0 |
3.9 |
1.4 |
|
– |
5.6 |
1.8 |
19.7 |
|
6.9 |
3.5 |
1.4 |
|
– |
5.7 |
2.0 |
19.4 |
||||
Pakistan |
20.5 |
35.7 |
4.5 |
0.6 |
6.7 |
† |
67.9 |
|
20.4 |
35.2 |
4.2 |
0.8 |
6.9 |
† |
67.6 |
||||||
Philippines |
12.2 |
2.8 |
7.7 |
|
– |
1.8 |
2.3 |
26.7 |
|
11.8 |
3.2 |
8.3 |
|
– |
2.1 |
2.3 |
27.7 |
||||
Singapore |
60.5 |
7.6 |
– |
|
– |
– |
† |
68.1 |
|
62.5 |
7.9 |
– |
|
– |
– |
† |
70.4 |
||||
South Korea |
106.0 |
38.7 |
75.9 |
33.6 |
0.8 |
0.5 |
255.6 |
|
106.0 |
41.9 |
79.4 |
34.0 |
1.2 |
0.6 |
263.0 |
||||||
Taiwan |
46.3 |
12.7 |
40.3 |
9.4 |
0.9 |
1.0 |
110.6 |
|
42.8 |
14.0 |
41.6 |
9.5 |
0.9 |
1.2 |
109.9 |
||||||
Thailand |
45.8 |
40.6 |
15.3 |
|
– |
1.3 |
1.4 |
104.3 |
|
46.8 |
41.9 |
13.9 |
|
– |
1.8 |
1.6 |
106.0 |
||||
Vietnam |
15.1 |
8.5 |
13.9 |
|
– |
6.3 |
† |
43.7 |
|
16.5 |
7.7 |
15.0 |
|
– |
6.7 |
† |
45.9 |
||||
Other Asia Pacific |
16.0 |
4.8 |
18.7 |
|
– |
8.6 |
0.1 |
48.2 |
|
16.7 |
5.2 |
19.1 |
|
– |
8.8 |
0.1 |
49.9 |
||||
Total Asia Pacific |
1281.7 |
502.1 |
2354.4 |
131.7 |
249.7 |
37.9 |
4557.6 |
|
1316.1 |
531.5 |
2553.2 |
108.0 |
248.1 |
46.4 |
4803.3 |
|
|||||
Total World |
4031.9 |
2843.1 |
3532.0 |
626.3 |
778.9 |
165.5 |
11977.8 |
|
4059.1 |
2905.6 |
3724.3 |
599.3 |
791.5 |
194.8 |
12274.6 |
||||||
of which: OECD |
2118.0 |
1387.9 |
1110.8 |
521.1 |
307.6 |
127.0 |
5572.4 |
|
2092.0 |
1386.1 |
1098.6 |
487.8 |
315.1 |
148.0 |
5527.7 |
||||||
Non-OECD |
1913.9 |
1455.2 |
2421.2 |
105.2 |
471.4 |
38.5 |
6405.3 |
|
1967.0 |
1519.5 |
2625.7 |
111.5 |
476.4 |
46.8 |
6746.9 |
||||||
European Union |
662.8 |
447.2 |
276.0 |
207.6 |
83.1 |
68.1 |
1744.8 |
|
645.9 |
403.1 |
285.9 |
205.3 |
69.6 |
80.9 |
1690.7 |
||||||
Former Soviet Union |
180.4 |
522.6 |
166.3 |
59.3 |
55.9 |
0.4 |
984.9 |
|
190.6 |
539.6 |
169.8 |
60.2 |
54.6 |
0.4 |
1015.1 |
||||||
*In this review, primary energy comprises commercially traded fuels, including modern renewables used to generate electricity. †Less than 0.05.
Note: Oil consumption is measured in million tonnes; other fuels in million tonnes of oil equivalent.
41
World consumption
Million tonnes oil equivalent
|
|
Coal |
|
|
|
|
|
|
|
|
|
|
|
|
|
|
|
|
|
|
|
|
|
|
|
|
13000 |
|
|
|
|
|
|
|
|
|
|
|
|
|
|
|
|
|
|
|
|
|
|
|
|
|
|
||
|
|
|
|
|
|
|
|
|
|
|
|
|
|
|
|
|
|
|
|
|
|
|
|
|
|
|
|
|
|
Renewables |
|
|
|
|
|
|
|
|
|
|
|
|
|
|
|
|
|
|
|
|
|
|
|
|
|
|
|
|
|
|
|
|
|
|
|
|
|
|
|
|
|
|
|
|
|
|
|
|
|
|
|
||
|
|
Hydroelectricity |
|
|
|
|
|
|
|
|
|
|
|
|
|
|
|
|
|
|
|
|
|
|
|
12000 |
|
|
|
|
|
|
|
|
|
|
|
|
|
|
|
|
|
|
|
|
|
|
|
|
|
|
|||
|
|
|
|
|
|
|
|
|
|
|
|
|
|
|
|
|
|
|
|
|
|
|
|
|
|
||
|
|
Nuclear energy |
|
|
|
|
|
|
|
|
|
|
|
|
|
|
|
|
|
|
|
|
|
|
|
|
|
|
|
|
|
|
|
|
|
|
|
|
|
|
|
|
|
|
|
|
|
|
|
|
|
|
|
||
|
|
|
|
|
|
|
|
|
|
|
|
|
|
|
|
|
|
|
|
|
|
|
|
|
|
||
|
|
Natural gas |
|
|
|
|
|
|
|
|
|
|
|
|
|
|
|
|
|
|
|
|
|
|
|
|
|
|
|
|
|
|
|
|
|
|
|
|
|
|
|
|
|
|
|
|
|
|
|
|
|
|
11000 |
||
|
|
|
|
|
|
|
|
|
|
|
|
|
|
|
|
|
|
|
|
|
|
|
|
|
|||
|
|
Oil |
|
|
|
|
|
|
|
|
|
|
|
|
|
|
|
|
|
|
|
|
|
|
|
|
|
|
|
|
|
|
|
|
|
|
|
|
|
|
|
|
|
|
|
|
|
|
|
|
|
|
|
|
|
|
|
|
|
|
|
|
|
|
|
|
|
|
|
|
|
|
|
|
|
|
|
|
|
|
|
|
|
|
|
|
|
|
|
|
|
|
|
|
|
|
|
|
|
|
|
|
|
|
|
|
|
|
|
|
|
|
|
|
|
|
|
|
|
|
|
|
|
|
|
|
|
|
|
|
|
|
|
|
|
|
|
|
10000 |
|
|
|
|
|
|
|
|
|
|
|
|
|
|
|
|
|
|
|
|
|
|
|
|
|
|
|
|
|
|
|
|
|
|
|
|
|
|
|
|
|
|
|
|
|
|
|
|
|
|
|
|
|
|
|
9000 |
|
|
|
|
|
|
|
|
|
|
|
|
|
|
|
|
|
|
|
|
|
|
|
|
|
|
|
|
|
|
|
|
|
|
|
|
|
|
|
|
|
|
|
|
|
|
|
|
|
|
|
|
|
|
|
8000 |
|
|
|
|
|
|
|
|
|
|
|
|
|
|
|
|
|
|
|
|
|
|
|
|
|
|
|
|
|
|
|
|
|
|
|
|
|
|
|
|
|
|
|
|
|
|
|
|
|
|
|
|
|
|
|
7000 |
|
|
|
|
|
|
|
|
|
|
|
|
|
|
|
|
|
|
|
|
|
|
|
|
|
|
|
|
|
|
|
|
|
|
|
|
|
|
|
|
|
|
|
|
|
|
|
|
|
|
|
|
|
|
|
6000 |
|
|
|
|
|
|
|
|
|
|
|
|
|
|
|
|
|
|
|
|
|
|
|
|
|
|
|
|
|
|
|
|
|
|
|
|
|
|
|
|
|
|
|
|
|
|
|
|
|
|
|
|
|
|
|
5000 |
|
|
|
|
|
|
|
|
|
|
|
|
|
|
|
|
|
|
|
|
|
|
|
|
|
|
|
|
|
|
|
|
|
|
|
|
|
|
|
|
|
|
|
|
|
|
|
|
|
|
|
|
|
|
|
4000 |
|
|
|
|
|
|
|
|
|
|
|
|
|
|
|
|
|
|
|
|
|
|
|
|
|
|
|
|
|
|
|
|
|
|
|
|
|
|
|
|
|
|
|
|
|
|
|
|
|
|
|
|
|
|
|
3000 |
|
|
|
|
|
|
|
|
|
|
|
|
|
|
|
|
|
|
|
|
|
|
|
|
|
|
|
|
|
|
|
|
|
|
|
|
|
|
|
|
|
|
|
|
|
|
|
|
|
|
|
|
|
|
|
2000 |
|
|
|
|
|
|
|
|
|
|
|
|
|
|
|
|
|
|
|
|
|
|
|
|
|
|
|
|
|
|
|
|
|
|
|
|
|
|
|
|
|
|
|
|
|
|
|
|
|
|
|
|
|
|
|
1000 |
|
|
|
|
|
|
|
|
|
|
|
|
|
|
|
|
|
|
|
|
|
|
|
|
|
|
|
|
86 |
87 |
88 |
89 |
90 |
91 |
92 |
93 |
94 |
95 |
96 |
97 |
98 |
99 |
00 |
01 |
02 |
03 |
04 |
05 |
06 |
07 |
08 |
09 |
10 |
11 |
0 |
|
World primary energy consumption grew by 2.5% in 2011, less than half the growth rate experienced in 2010 but close to the historical average. Growth decelerated for all regions and for all fuels. Oil remains the world’s leading fuel, accounting for 33.1% of global energy consumption, but this figure is the lowest share on record. Coal’s market share of 30.3% was the highest since 1969.
Regional consumption pattern 2011
Percentage
|
|
|
|
|
|
100 |
|
|
|
|
|
|
90 |
|
|
|
|
|
|
80 |
|
|
|
|
|
|
70 |
|
|
|
|
|
|
60 |
|
|
|
|
|
|
50 |
|
|
|
|
|
|
40 |
|
|
|
|
|
|
30 |
|
|
|
|
|
|
20 |
|
|
|
|
|
|
10 |
North America |
S. & Cent. America |
Europe & Eurasia |
Middle East |
Africa |
Asia Pacific |
0 |
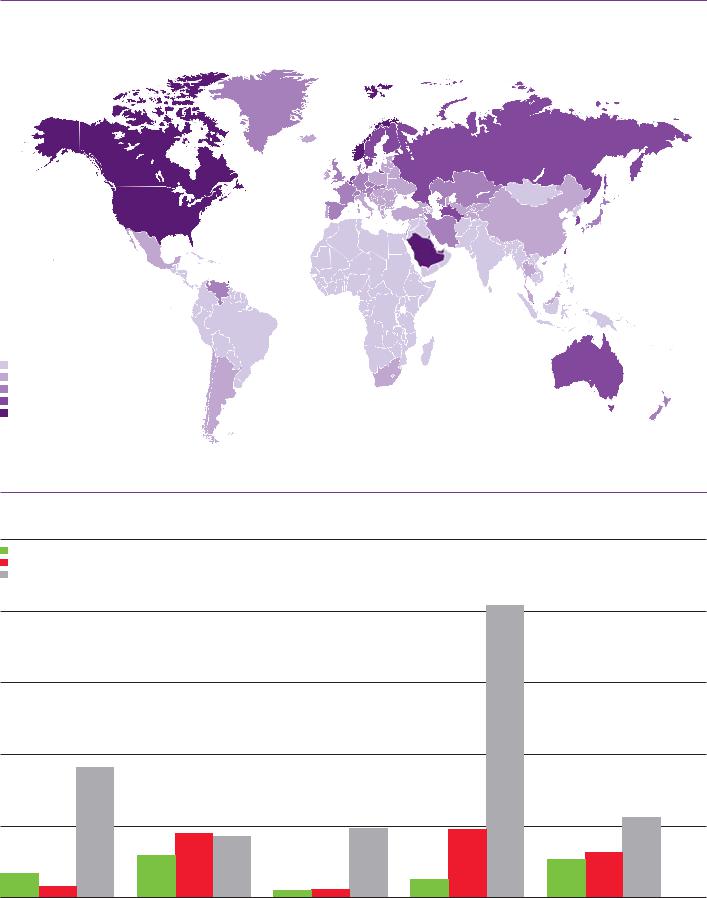
The Asia Pacific region is the world’s largest energy consumer, accounting for 39.1% of global energy consumption and 68.6% of global coal consumption; the region also leads in oil consumption and hydroelectric generation. Europe & Eurasia is the leading region for consumption of natural gas, nuclear power, and renewables. Coal is the dominant fuel in the Asia Pacific region; natural gas is dominant in Europe & Eurasia, and oil is dominant in all other regions.
42
Consumption per capita 2011
Tonnes oil equivalent
0-1.5
1.5-3.0
3.0-4.5
4.5-6.0 > 6.0
Fossil fuel reserves-to-production (R/P) ratios at end 2011
Years
500
Oil
Natural gas
Coal |
|
|
|
|
|
|
|
|
|
|
400 |
|
|
|
|
|
300 |
|
|
|
|
|
200 |
|
|
|
|
|
100 |
OECD |
Non-OECD |
European Union |
Former Soviet Union |
World |
0 |
Coal remains the most abundant fossil fuel by global R/P ratio, although global oil and natural gas reserves have increased significantly over time. Non-OECD countries possess the majority of proved reserves for all fossil fuels, but OECD countries have a higher R/P ratio for coal.
43

Appendices
Approximate conversion factors
Crude oil*
From |
|
|
|
To |
|
|
|
|
|
|
|
|
|
|
|||
|
tonnes |
|
|
|
|
|
US |
tonnes |
|
(metric) |
kilolitres |
|
|
barrels |
gallons |
per year |
|
|
|
|
Multiply by |
|
|
|
||
Tonnes (metric) |
1 |
1.165 |
7.33 |
307.86 |
– |
|||
Kilolitres |
0.8581 |
1 |
6.2898 |
264.17 |
– |
|||
Barrels |
0.1364 |
0.159 |
1 |
42 |
– |
|||
US gallons |
0.00325 |
0.0038 |
0.0238 |
1 |
– |
|||
Barrels per day |
– |
– |
|
|
– |
– |
49.8 |
|
*Based on worldwide average gravity. |
|
|
|
|
|
|
|
|
Products
|
|
|
|
To convert |
|
|
||
|
barrels |
tonnes |
kilolitres |
tonnes |
||||
|
to tonnes |
to barrels |
to tonnes |
to kilolitres |
||||
|
|
|
|
Multiply by |
|
|
||
Liquefied petroleum gas (LPG) |
0.086 |
11.6 |
0.542 |
1.844 |
||||
Gasoline |
0.118 |
8.5 |
0.740 |
1.351 |
||||
Kerosene |
0.128 |
7.8 |
0.806 |
1.240 |
||||
Gas oil/diesel |
0.133 |
7.5 |
0.839 |
1.192 |
||||
Fuel oil |
0.149 |
6.7 |
0.939 |
1.065 |
||||
Natural gas (NG) and liquefied natural gas (LNG)
From |
|
|
|
|
To |
|
|
|
||
|
|
|
|
|
|
|
||||
|
billion cubic |
billion cubic |
million tonnes |
million tonnes |
trillion British |
million barrels |
||||
|
metres NG |
feet NG |
oil equivalent |
|
|
LNG |
thermal units |
oil equivalent |
||
|
|
|
|
Multiply by |
|
|
|
|||
1 billion cubic metres NG |
1 |
35.3 |
0.90 |
0.74 |
35.7 |
6.60 |
||||
1 billion cubic feet NG |
0.028 |
1 |
0.025 |
0.021 |
1.01 |
0.19 |
||||
1 million tonnes oil equivalent |
1.11 |
39.2 |
1 |
0.82 |
39.7 |
7.33 |
||||
1 million tonnes LNG |
1.36 |
48.0 |
1.22 |
1 |
48.6 |
8.97 |
||||
1 trillion British thermal units |
0.028 |
0.99 |
0.025 |
0.021 |
1 |
0.18 |
||||
1 million barrels oil equivalent |
0.15 |
5.35 |
0.14 |
0.11 |
5.41 |
1 |
||||
Units
1 metric tonne |
= 2204.62lb |
|
= 1.1023 short tons |
1 kilolitre |
= 6.2898 barrels |
|
= 1 cubic metre |
1 kilocalorie (kcal) |
= 4.187kJ |
|
= 3.968Btu |
1 kilojoule (kJ) |
= 0.239kcal |
|
= 0.948Btu |
1 British thermal |
= 0.252kcal |
unit (Btu) |
= 1.055kJ |
1 kilowatt-hour (kWh) |
= 860kcal |
|
= 3600kJ |
|
= 3412Btu |
Calorific equivalents
One tonne of oil equivalent equals approximately:
Heat units |
10 million kilocalories |
|
42 gigajoules |
|
40 million British |
|
thermal units |
Solid fuels |
1.5 tonnes of hard coal |
|
3 tonnes of lignite |
Gaseous fuels |
See Natural gas and |
|
liquefied natural gas table |
Electricity |
12 megawatt-hours |
One million tonnes of oil or oil equivalent produces about 4400 gigawatt-hours (= 4.4 terawatt-hours) of electricity in a modern power station.
1 barrel of ethanol = 0.57 barrel of oil
1 barrel of biodiesel = 0.88 barrel of oil
Definitions
Statistics published in this review are taken from government sources and published data. No use is made of confidential information obtained by BP in the course of its business.
Country and geographic groupings are made purely for statistical purposes and are not intended to imply any judgement about political or economic standings.
North America
US (excluding Puerto Rico), Canada, Mexico.
South & Central America
Caribbean (including Puerto Rico), Central and
South America.
Europe
European members of the OECD plus Albania, Bosnia-Herzegovina, Bulgaria, Croatia, Cyprus, Former Yugoslav Republic of Macedonia, Gibraltar, Malta, Romania, Serbia and Montenegro.
Former Soviet Union
Armenia, Azerbaijan, Belarus, Estonia, Georgia,
Kazakhstan, Kyrgyzstan, Latvia, Lithuania, Moldova,
Russian Federation, Tajikistan, Turkmenistan,
Ukraine, Uzbekistan.
Europe & Eurasia
All countries listed above under the headings Europe and Former Soviet Union.
Middle East
Arabian Peninsula, Iran, Iraq, Israel, Jordan,
Lebanon, Syria.
North Africa
Territories on the north coast of Africa from Egypt to western Sahara.
West Africa
Territories on the west coast of Africa from Mauritania to Angola, including Cape Verde, Chad.
East and Southern Africa
Territories on the east coast of Africa from Sudan to Republic of South Africa. Also Botswana, Madagascar, Malawi, Namibia, Uganda, Zambia, Zimbabwe.
Asia Pacific
Brunei, Cambodia, China, China Hong Kong SAR*,
Indonesia, Japan, Laos, Macau, Malaysia, Mongolia,
North Korea, Philippines, Singapore, South Asia
(Afghanistan, Bangladesh, India, Myanmar, Nepal,
Pakistan, Sri Lanka), South Korea, Taiwan, Thailand,
Vietnam, Australia, New Zealand, Papua New
Guinea, Oceania.
*Special Administrative Region.
Australasia
Australia, New Zealand.
OECD members
Europe: Austria, Belgium, Czech Republic, Denmark, Estonia, Finland, France, Germany, Greece, Hungary, Iceland, Republic of Ireland, Italy, Luxembourg, Netherlands, Norway, Poland, Portugal, Slovakia, Slovenia, Spain, Sweden, Switzerland, Turkey, UK. Other member countries: Australia, Canada, Chile, Israel, Japan, Mexico, New Zealand, South Korea, US.
OPEC members
Middle East: Iran, Iraq, Kuwait, Qatar, Saudi Arabia, United Arab Emirates.
North Africa: Algeria, Libya.
West Africa: Angola, Nigeria.
South America: Ecuador, Venezuela.
European Union members
Austria, Belgium, Bulgaria, Cyprus, Czech Republic, Denmark, Estonia, Finland, France, Germany, Greece, Hungary, Republic of Ireland, Italy, Latvia, Lithuania, Luxembourg, Malta, Netherlands, Poland, Portugal, Romania, Slovakia, Slovenia, Spain, Sweden, UK.
Non-OECD
All countries that are not members of the OECD.
Methodology
The primary energy values of nuclear and hydroelectric power generation, as well as electricity from renewable sources, have been derived by calculating the equivalent amount of fossil fuel required to generate the same volume of electricity in a thermal power station, assuming a conversion efficiency of 38%
(the average for OECD thermal power generation). Fuels used as inputs for conversion
technologies (gas-to-liquids, coal-to-liquids and coal-to-gas) are counted as production for the source fuel and the outputs are counted as consumption for the converted fuel.
Percentages
Calculated before rounding of actuals. All annual changes and shares of totals are on a weight basis except on pages 6, 13, 16, 18 and 20.
Rounding differences
Because of rounding, some totals may not agree exactly with the sum of their component parts.
Tonnes
Metric equivalent of tons.
44

More information
The data in this publication is also available at bp.com/statisticalreview. In addition to viewing,
data can be downloaded and charted using the charting tool.
Questions on data
BP regrets it is unable to deal with enquiries about the data in
BP Statistical Review of World Energy June 2012.
Ordering copies
You can order BP’s printed publications, free of charge, from:
US and Canada Precision IR
Toll-free +1 888 301 2505 Fax +1 804 327 7549 bpreports@precisionir.com
UK and Rest of World BP Distribution Services Tel +44 (0)870 241 3269 Fax +44 (0)870 240 5753
bpdistributionservices@bp.com
Quoting from the review
Publishers are welcome to quote from this review provided that they attribute the source to BP Statistical Review of World Energy June 2012. However, where extensive reproduction of tables and/or charts is planned, permission must first be obtained from:
The Editor
BP Statistical Review of World Energy BP p.l.c.
1 St James’s Square
London SW1Y 4PD UK
sr@bp.com
The redistribution or reproduction of data whose source is Platts is strictly prohibited without prior authorization from Platts.
Acknowledgements
Data compilation Energy Academy and Centre for Economic Reform and Transformation, Heriot-Watt University, www.energy.hw.ac.uk
Design saslondon.com Typesetting Orb Solutions, London Printing Pureprint Group Limited,
UK ISO 14001, FSC® certified and
CarbonNeutral®
Paper
This Review is printed on FSC-certified Mohawk Options 100% (cover and text). This paper has been independently certified according to the rules of the Forest Stewardship Council (FSC) and was manufactured at a mill that holds ISO 14001 accreditation. The inks used are all vegetable oil based.
© BP p.l.c. 2012
45