

Debugging.NETwithWinDbg
.pdfDebugging .NET with WinDbg
Author: Sebastian Solnica (http://lowleveldesign.wordpress.com)
Version: 1.0beta2
Starting debugging process
In .NET2.0
In .NET4.0
Controlling debugging process
Setting breakpoint !mbm
!mbp
!bpmd Examining stack !CLRStack
!DumpStack
!DumpStackObjects
!EEStack
Examining heap & Garbage Collector status !DumpHeap
!DumpRuntimeTypes
!EEHeap
!HeapStat
!TraverseHeap
!VerifyHeap
!GCHandles
!GCHandleLeaks
!GCInfo
!GCRoot
!GCWhere
!FindRoots Examining code
!Name2EE
!U
!DumpIL
Examining CLR structures
AppDomains
!DumpDomain
Assemblies/Modules
!DumpModule
!DumpAssembly

Classes/Types
!DumpClass
!DumpMT Methods
!IP2MD
!DumpMD Objects
!DumpArray
!DumpObj
!DumpVC
!ObjSize Threads
!SyncBlk
ASP.NET
!DumpHttpContext (!ASPXPages)
!DumpHttpRuntime
!DumpBuckets
!DumpASPNETCache Exceptions
!CheckCurrentException
!CheckCurrentException
!EHInfo
!PrintException
!DumpAllExceptions
!StopOnException
Starting debugging process
In .NET2.0
You need to wait till clrjit module is loaded:
sxe ld:mscorjit
Then you may load necessary extensions:
.loadby sos mscorwks
.load sosex
In .NET4.0
You need to wait till clrjit module is loaded:
sxe ld:clrjit
Then you may load necessary extensions:
.loadby sos clr
.load sosex
Controlling debugging process
Setting breakpoint
!mbm
!mbm <Type/MethodFilter> [ILOffset] [Options] (SOSEX) - sets a managed breakpoint on
methods matching the specified filter.
!mbp
!mbp <SourceFile> <nLineNum> [ColNum] [Options] (SOSEX) - sets a managed breakpoint at the
specified source code location.
!bpmd
!BPMD [-nofuturemodule] [<module name> <method name>] [-md <MethodDesc>] -list- clear <pending breakpoint number> -clearall (SOS/PSSCOR2) - creates a breakpoint at the specified method in the specified module. And with -clear and -clearall remove them.
If you are using names for module and method !bpmd will scan all the loaded domains. If it finds that a given type was loaded more than once (in two separate domain for instance) it will print error:
0:000> !bpmd System.dll System.Diagnostics.EventLog.SourceExists
There are multiple modules with the same name...
In that case just look for a module address (using !DumpDomain for instance or !Name2EE) and retype the above command but using module address instead of its name:
0:000> !Name2EE * System.Diagnostics.EventLog.SourceExists Module: 000007fbffc31000 (mscorlib.dll)
Module: 000007fc0d741000 (System.Configuration.dll)
--------------------------------------
Module: 000007fbff201000 (System.dll)
Token: 0x00000000060038fd
MethodDesc: 000007fbff308070
Name: System.Diagnostics.EventLog.SourceExists(System.String)
JITTED Code Address: 000007fbff996ec0
-----------------------
Token: 0x00000000060038fe
MethodDesc: 000007fbff308090
Name: System.Diagnostics.EventLog.SourceExists(System.String, System.String) JITTED Code Address: 000007fbff996d70
…
Module: 000007fba9e243e0 (Castle.Core.DLL)
--------------------------------------
Module: 000007fba9e29368 (System.dll)
Token: 0x00000000060038fd
MethodDesc: <not loaded yet>
Name: System.Diagnostics.EventLog.SourceExists
Not JITTED yet.
-----------------------
Token: 0x00000000060038fe
MethodDesc: <not loaded yet>
Name: System.Diagnostics.EventLog.SourceExists
Not JITTED yet.
And finally:
0:000> !bpmd 000007fba9e29368 System.Diagnostics.EventLog.SourceExists
Adding pending breakpoints...
You can also use wildcards:
0:000> !bpmd mscorlib.dll System.AppDomain.CreateDomain
Found 6 methods...
Examining stack
!CLRStack
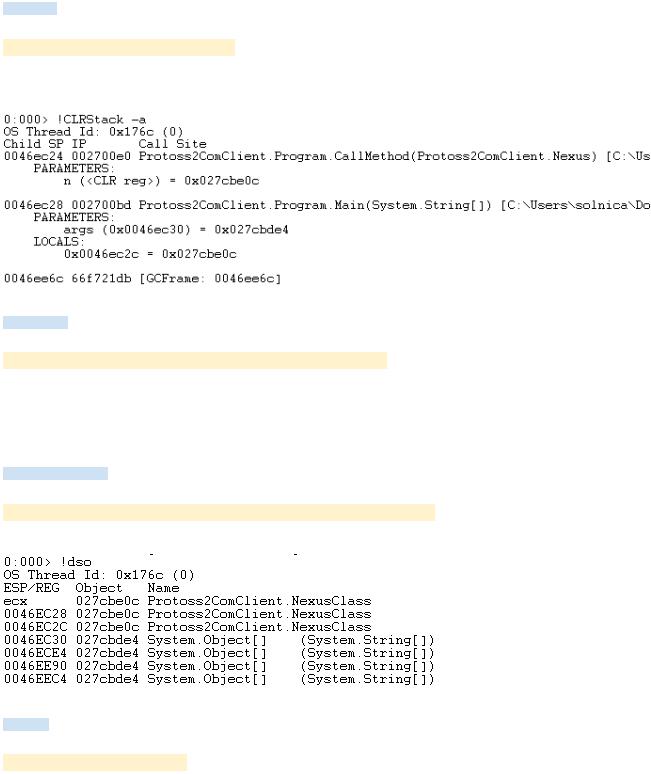
!CLRStack [-a] [-l] [-p] [-n] (SOS/PSSCOR2) - provides stack trace of managed code only. The -p shows arguments to the managed function. The -l shows local function variables. -a is -p and -l
combined. -n disables display of source file names and lines.
!DumpStack
!DumpStack [-EE] [-n] [top stack [bottom stack]] (SOS/PSSCOR2) - displays a stack trace (managed + native). The -EE parameter causes DumpStack to show only managed stack frames (top and bottom limits the frames displayed). -n option disables display of source line and file names. To check the top and bottom frames you may use !teb debugger extension command.
!DumpStackObjects
!DumpStackObjects [-verify] [top stack [bottom stack]] (SOS/PSSCOR2) (alias: dso) - displays all managed objects found within the bounds of the current stack.
!EEStack
!EEStack [-short] [-EE] (SOS/PSSCOR2) - runs DumpStack on all threads in the process. The -EE argument is passed to the DumpStack command. When -short is given only threads that have taken the lock, threads stalled to allow garbage collection and threads that are currently in managed code are displayed.
Examining heap & Garbage Collector status
!DumpHeap
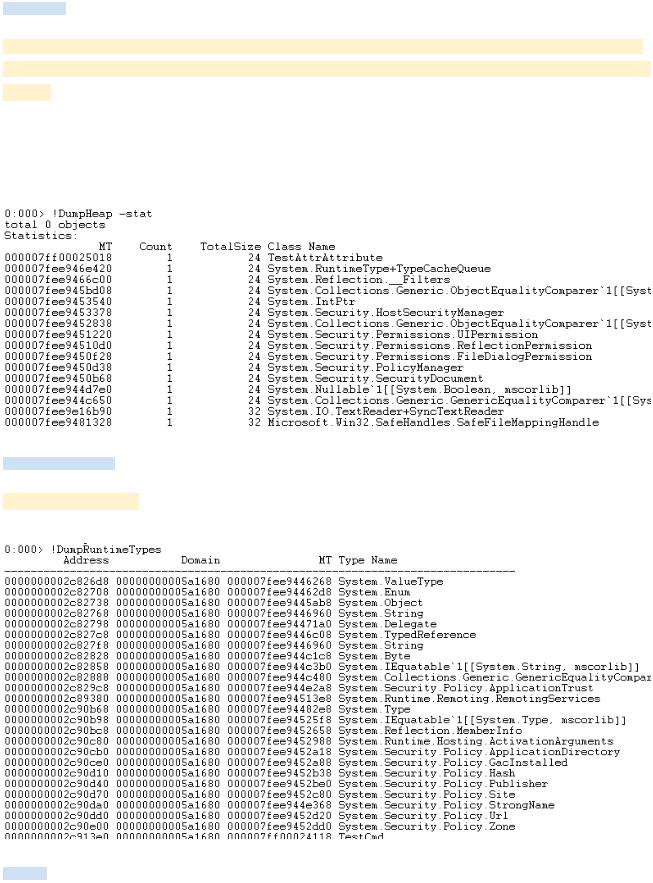
!DumpHeap [-stat] [-strings] [-short] [-min <size>] [-max <size>] [-thinlock] [-
startAtLowerBound] [-mt <MethodTable address>] [-type <partial type name>][start
[end]] (SOS/PSSCOR2) - displays information about objects that are allocated on the heap. -type and - mt switches enable you to search the managed heap for a given type name or method table address.
-stat displays only statistical type summary and -strings only strings statistical summary. -short limits output to just addresses of objects which might be useful when redirecting the output to other debugger command.
!DumpRuntimeTypes
!DumpRuntimeTypes (SOS/PSSCOR2) - displays runtime type objects in the GC heap and lists type names and method tables associated with them.
!EEHeap
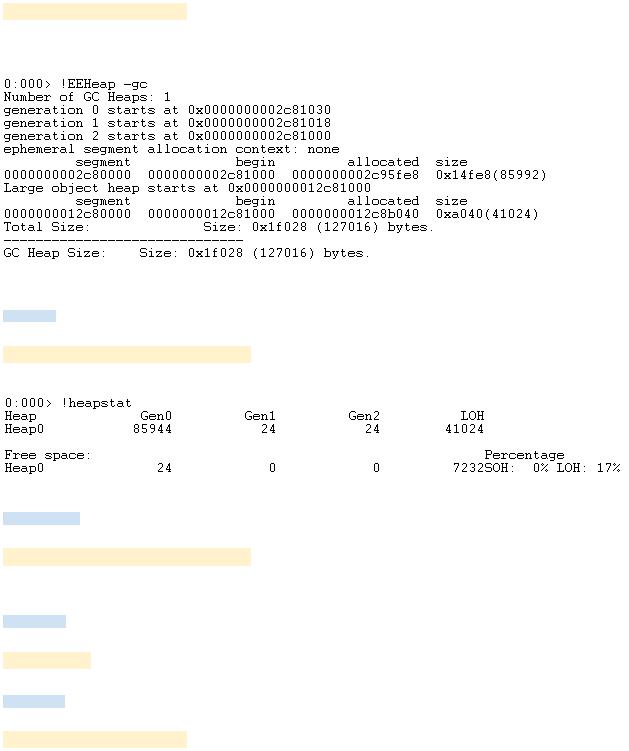
!EEHeap [-gc] [-loader] (SOS/PSSCOR2) - display information about process memory consumed by internal CLR structures. -gc limits the output to Garbage Collector data and -loader to loader data
structures.
!HeapStat
!HeapStat [-inclUnrooted | -iu] (SOS/PSSCOR2) - displays the generation sizes and the total of
the free space for each heap.
!TraverseHeap
!TraverseHeap [-xml] <filename> (SOS/PSSCOR2) - traverses the heap and saves its data to the file understandable by CLR Profiler. With -xml option the output will be saved as a xml file.
!VerifyHeap
!VerifyHeap (SOS/PSSCOR2) - checks the GC heap for signs of corruptions and displays all errors found.
!GCHandles
!GCHandles [-perdomain] (SOS/PSSCOR2) - displays statistics about GC handles in the process.

!GCHandleLeaks
!GCHandleLeaks [-perdomain] (SOS/PSSCOR2) - looks for any references to strong and pinned GC
handles in the process and displays the results.
!GCInfo
!GCInfo <MethodDesc address><Code address> (SOS/PSSCOR2) - Displays data that indicates when registers or stack locations contain managed objects. If a garbage collection occurs, the collector must know the locations of references to objects so it can update them with new object pointer values.
!GCRoot
!GCRoot [-nostacks] <Object address> (SOS/PSSCOR2) - displays information about references
to an object at the specified address.
!GCWhere
!GCWhere <object address> (SOS/PSSCOR2) - displays the size and location in the GC heap for the
given argument.
!FindRoots
!FindRoots -gen <N> | -gen any |<object address> (SOS/PSSCOR2) - causes the debugger to
break into the debuggee on the next collection of the specified generation.
Examining code
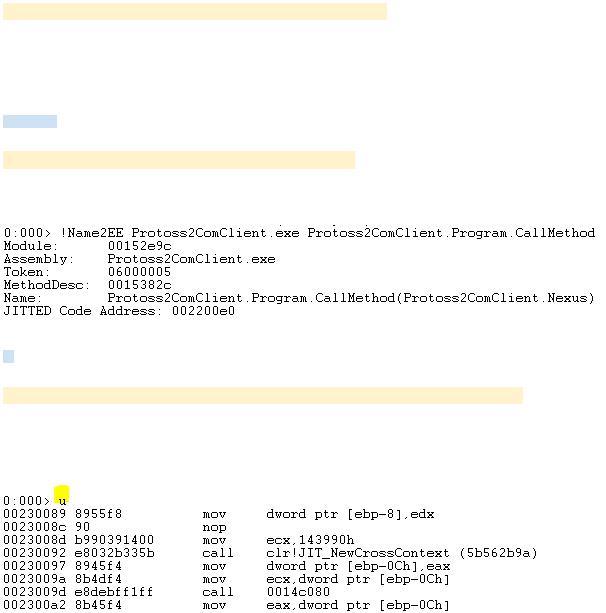
!Name2EE
!Name2EE <module name> <type or method name> (SOS/PSSCOR2) - displays method table and EEClass for the specified type or method in the given module.The module must be loaded. You may pass * as the module parameter and all modules will be searched for a given method/type.
!U
!U [-gcinfo] [-ehinfo] [-n] <MethodDesc address> | <Code address> (SOS/PSSCOR2) - displays an annotated disassembly of a managed method. Whole method code is shown. -n disables source code information. !U has advantage over u command because it can decipher the method called by CLR (as in the example below).
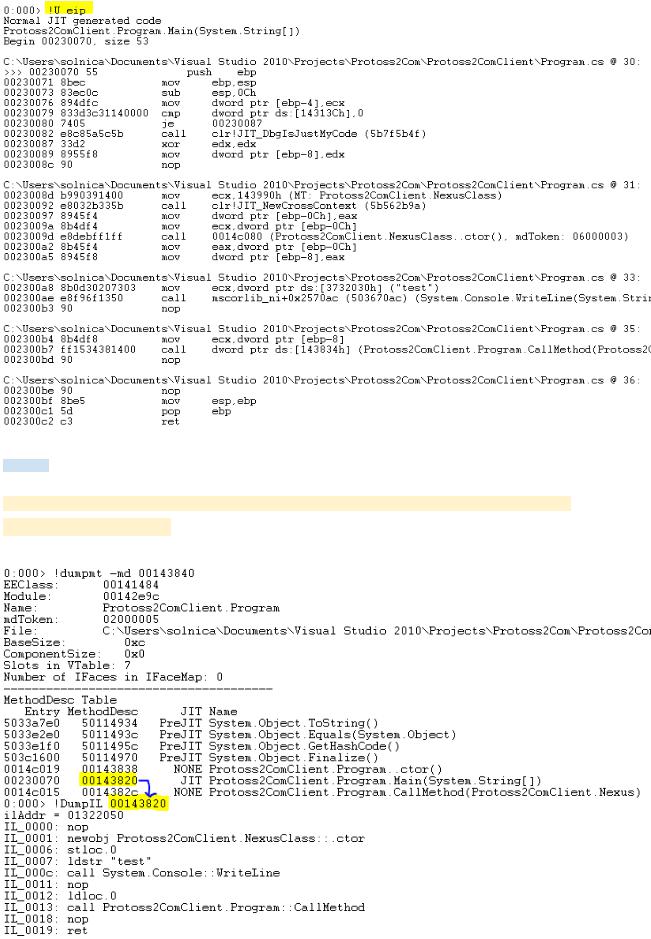
!DumpIL
!DumpIL <Managed DynamicMethod object> | <DynamicMethodDesc pointer> |
<MethodDesc pointer> (SOS/PSSCOR2) - displays the MSIL that is associated with a managed
method.