

Environmental Biotechnology - Jordening and Winter
.pdf90 3 Activated Sludge Process
The oxygen consumption (Eq. 11) is derived from Eq. 6:
OUC = CCOD,0 – SCOD,e – XCOD,exc |
(11) |
The daily mass of excess sludge solids Mexc,C [kg d–1] is calculated with Eq. 12, and the daily mass of oxygen MO,C [kg d–1] required with Eq. 13.
Mexc,C = Qd · SSexc/1000 |
(12) |
MO,C = Qd · OUC/1000 |
(13) |
If phosphate is removed, the additional excess sludge (Mexc,P) has to be taken into account (see Section 3.2.5). In plants with a low COD/N ratio and nitrification the biomass of autotrophs produced (Mexc,N) can also be considered as additional excess sludge. The mass of oxygen required for nitrification (Eq. 16) and the oxygen ‘gained’ from denitrification (Eq. 25) always must be determined separately.
If SRT is selected according to the desired effluent quality, the reactor volume V can be calculated with Eq. 14,
V = |
SRT · Mexc |
(14) |
|
MLSS
where Mexc = Mexc,C + Mexc,P + Mexc,N.
3.2.3
Nitrification
The main step in nitrogen removal is nitrification, which is assumed to be performed in two steps. Frst ammonia is converted to nitrite by Nitrosomonas and then nitrite is converted to nitrate by Nitrobacter. The overall reactions are written as:
NH4+ + 1.5 O2 → NO2– + H2O + 2 H+
NO2– + 0.5 O2 → NO3–
NH4+ + 2.0 O2 → NO3– + H2O + 2 H+
The stoichiometric oxygen demand is 3.43 mg O2 per mg of ammonia nitrogen (SNH4) converted to nitrite nitrogen (SNO2) and 1.14 mg O2 per mg SNO2 converted to nitrate nitrogen (SNO3). Thus, the overall demand is 4.57 mg O2 per mg SNO3 formed. Since there is some buildup of autotrophic biomass, the total actual oxygen consumption is reported to be in the range of 4.2–4.3 mg mg–1 [43]. For design calculations, an overall oxygen demand of 4.3 mg O2 per mg SNO3 formed is widely used. The ammonia available for nitrification SNH4,N is obtained from Eq. 15:
SNH4,N = CTKN,0 – CTKN,e – XN,exc |
(15) |

3.2 Technological and microbiological aspects 91
For municipal wastewater the non-oxidized nitrogen in the effluent may be assumed to be 2 mg L–1 organic nitrogen and 1 mg L–1 ammonia nitrogen (CTKN,e = 3 mg L–1). The nitrogen contained in the excess sludge may be assumed to be XN,exc = 0.02 CCOD,0. The daily mass of oxygen consumed for nitrification is calculated with Eq. 16:
MO,N = 4.3 · SNH4,N · Qd / 1000 |
(16) |
The two moles of hydrogen released per mole of ammonia converted to nitrite destroy two moles of alkalinity, which equals 0.14 mmol mg–1 SNO2. If all alkalinity is destroyed, the pH may drop and the flocs of the mixed liquor may disintegrate (see Section 3.2.6.2).
The growth rate of nitrifiers is much lower than that of heterotrophic bacteria. The net maximum growth rates ì*max determined by Knowles et al. [44] are widely adopted (Eqs. 17 and 18).
Nitrosomonas: |
ì*max = 0.47 · 1.10(T–15) |
(17) |
Nitrobacter: |
ì*max = 0.78 · 1.06(T–15) |
(18) |
Since at reactor temperatures below T = 30 °C the growth rate ì*max of Nitrosomonas is lower than ì*max of Nitrobacter, Eq. 17 is generally used for design calculations. To avoid a washout of nitrifiers, the inverse net maximum growth rate must be larger than the aerobic sludge age (SRTaer). To obtain a low ammonia concentration in the effluent, a series of Monod terms may be used to estimate the desired growth rate and necessary sludge age:
ì = ìmax · |
XNH4 |
· |
SO2 |
· |
Salk |
– kD,A |
(19) |
kNH4 + SNH4 |
kO2 + SO2 |
kalk + Salk |
Typical values of kinetic parameters are taken from ASM2 and ASM3 [39] (Table 3.2). If one assumes that each of the three terms in Eq. 19 will not be lower than 0.8 (80% of maximum rates), the operating parameters shown in the second column of Table 3.2 should be maintained.
At 10 °C the growth rate under these conditions would become ì = 0.13 d–1, and the aerobic sludge age required should be SRTaer > 1/0.13 = 7.7 d. The values for
Table 3.2 Typical values of kinetic and operating parameters.
Kinetic Parameter Values |
Operating Parameters |
|
|
µmax = 0.52 · 1.1(T – 15) d–1 |
|
kD,A = 0.05 · 1.072(T – 15) |
d–1 |
kNH4 = 1 mg L–1 SNH4 |
SNH4 = 4 mg L–1 |
kO2 = 0.5 mg L–1 DO |
SO2 = 2 mg L–1 |
kalk = 0.5 mmol L–1 |
Salk = 2 mmol L–1 |
|
|
92 3 Activated Sludge Process
DO and alkalinity reflect the usual optimum process conditions. The average concentration of 4 mg L–1 ammonia nitrogen is rather high, because practical experience indicates that, for an aerobic sludge age (SRTaer) of 8–10 d, almost complete nitrification at a reactor temperature of 10 °C is achieved. For design purposes a more simplified approach, such as Eq. 20, may be applied [45].
SRTaer = SF0 · SF1 · SF2 · (1/0.47) · 1.10(T – 15) |
(20) |
A safety factor SF0 of 1.5 enables the growth of nitrifiers; when SF1 = SF2 = 1.0. The safety factor SF1 takes into account any inhibition of the growth rate; a value of SF1 = 1.25 may be chosen. The safety factor SF2 reflects the ammonia load fluctuations. Depending on the size of the plant and the load fluctuations, SF2 = 1.3–1.6 seems to be appropriate. For a temperature of 10 °C this again leads to SRTaer = 8–10 d.
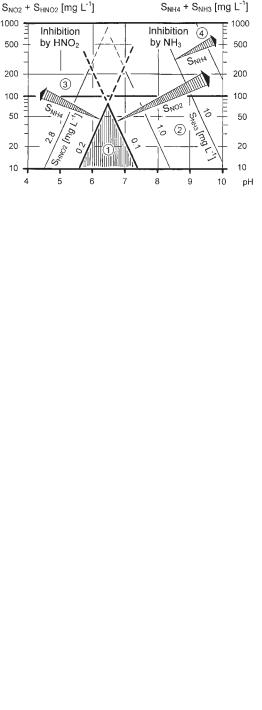
Nitrification is sensitive to pH, as shown by Anthonisen et al. [46] and Nyhuis [47]. Nitrosomonas activity is inhibited by low concentrations of HNO2, the result being a buildup of ammonia nitrogen (SNH4). Anthonisen et al. [46] suggested that inhibition begins at 0.8 to 2.8 mg L–1 HNO2; Nyhuis [47] found values of 0.02 to HNO2. Free ammonia (NH3) inhibits Nitrobacter starting at 0.1 to 1 mg L–1 NH3 [46] or 1.0 to 10 mg L–1 NH3 [47], leading to a buildup of nitrite nitro-
gen (SNO2). Higher concentrations of free ammonia also inhibit Nitrosomonas (10 to 150 mg L–1 NH3 [46]; 40 to 200 mg L–1 NH3 [47]). Since the concentrations of HNO2 and NH3 depend on pH and the SNO2 or SNH4 of the mixed liquor, Anthonisen et al. developed a graph indicating the range of inhibitory conditions (Fig. 3.10). The arrows show which parameter may accumulate. It is evident that at low values of SNH4 and SNO2 and a pH of 6 to 7, as it is usual when treating municipal wastewater, inhibition does not occur (shaded area). When treating high strength wastewater such as that from rendering plants, disturbances are frequently observed, due to a buildup of nitrite (SNO2).
Fig. 3.10 Inhibition of nitrification by free ammonia and nitrous acid.

3.2 Technological and microbiological aspects 93
3.2.4
Denitrification
From an engineering point of view denitrification can be visualized as heterotrophic respiration using nitrate instead of dissolved oxygen as the electron acceptor. Nitrate is finally converted to gaseous nitrogen (N2) by numerous reduction steps (Eq. 21).
NO3– → NO2– → NO → N2O → N2 |
(21) |
Since nitrous oxide (N2O) is a greenhouse gas, some concern about biological nitrogen removal has arisen. Investigations in Germany indicate that the contribution of N2O from nitrogen removal of all German wastewater would be in the range of 2% of the total German N2O emissions [48, 49].
A simplified overall reaction of the conversion of nitrate to molecular nitrogen may be written as:
2 NO3– + 2 H+ → N2 + H2O + 2.5 [O2] |
(22) |
If a substrate (acetate) is added on the right side of Eq. 22, Eq. 23 is obtained:
5 CH3COOH + 8 NO3– → 4 N2 + 8 HCO3– + 2 CO2 + 6 H2O |
(23) |
Both equations indicate that, for one mole of nitrate denitrified, one mole of alkalinity is gained and 1.25 moles of O2 equivalent becomes available for heterotrophic respiration, which is equal to 2.9 mg of oxygen equivalent gained per mg of SNO3 to be denitrified. If only nitrite has to be denitrified, 1.7 mg of oxygen equivalent is gained per mg of SNO2 denitrified.
Since bacterial synthesis is not considered in Eq. 23, the actual substrate requirement is higher. Experience indicates that 4–6 kg COD of external substrate is necessary to remove 1 kg of nitrate nitrogen.
Nitrate to be denitrified may be calculated with Eq. 24:
SNO3,D = SNH4,N + SNO3,0 – SNO3,e |
(24) |
SNH4,N is calculated with Eq. 15. The effluent nitrate nitrogen SNO3,e should be about 2/3 of the value to be maintained. The daily mass of oxygen equivalents ‘gained’ from denitrification is obtained with Eq. 25:
MO,D = 2.9 · SNO3,D · Qd / 1000 |
(25) |
The reactor volume for denitrification (VD) may be estimated
•from empirical denitrification rates
•by applying anoxic heterotrophic growth kinetics
•by using the aerobic heterotrophic oxygen uptake rate in combination with empirical slow-down factors

94 3 Activated Sludge Process
Empirical denitrification rates are listed in the EPA Manual [50], among others. The estimation based on heterotrophic growth kinetics is outlined by Stensel and Barnard [43].
Since the driving force for nitrate uptake is similar to the driving force for dissolved oxygen uptake, according to Gujer and Kayser [42], for pre-anoxic zone denitrification the concentration of nitrate to be denitrified can be calculated with Eq. 26:
SNO3,D = |
0.9 (1 – Y ) SCOD,read |
+ |
VD |
|
0.6 [OUC – (1 – Y ) SCOD,read] |
(26) |
|
2.9 |
V- |
2.9 |
|||||
|
|
|
|||||
The first term indicates that readily biodegradable COD (SCOD,read) is almost immediately (factor 0.9) removed by nitrate and is therefore almost independent of the size of the anoxic tank volume. The remaining slowly biodegradable COD is removed at a slower rate (factor 0.6) and depends on the anoxic fraction of the reactor (VD/V).
In the intermittent denitrification process the fraction of readily biodegradable COD that enters the reactor during aeration periods cannot be considered for denitrification:
|
|
VD |
0.9 (1 – Y ) SCOD,read + 0.6 [OUC – (1 – Y ) SCD,read] |
|||
SNO3,D |
= |
|
|
|
(27) |
|
V- |
2.9 |
|||||
|
|
|
||||
The readily biodegradable COD (SCOD,read) can be estimated, e.g., by the procedure of Kappeler and Gujer [51]. For municipal wastewater a value of 0.05 to 0.2 for SCOD,read/SCOD,0 can be assumed.
The sludge age (SRT) for the calculation of OUC in Eqs. 26 and 27 is derived from the required aerobic sludge age for nitrification:
SRT = |
1 |
SRTaer |
(28) |
|
|||
|
1 – VD/V. |
|
|
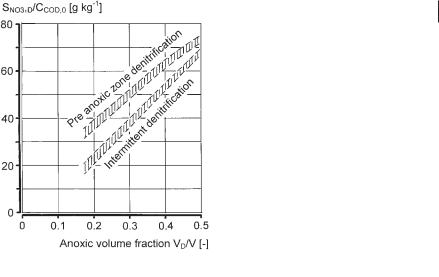
For a design temperature of 10–12 °C the values of VD/V may be taken from Figure 3.11.
Denitrification becomes limited depending on the ratio VD/V and OUC or on the COD/TKN ratio. Since enlarging anoxic reactor (VD) increases the sludge age and decreases the volumetric carbonaceous oxygen uptake rate, it is not economical to raise the anoxic reactor ratio above VD/V = 0.5. The addition of external organic carbon such as methanol or acetate under such conditions is one possible way of achieving the desired effluent nitrate concentration. Another way to gain additional organic carbon is prefermentation of sludge from primary sedimentation [52]. If external carbon is the only source of organics for denitrification, it is advisable to perform experiments to determine the size of the anoxic reactor and the substrate requirement. As a very rough estimate, one can assume, for methanol or acetate as carbon source, denitrification rates of 0.1–0.2 mg SNO3,D per mg VSS per day at tem-
3.2 Technological and microbiological aspects 95
Fig. 3.11 Nitrate to be denitrified as a function of the influent COD and the type of denitrification process.
peratures of 15–20 °C. Since using methanol requires the development of special bacteria, it is not recommended for temporary dosage, e.g., during peak hours.
Dissolved oxygen inhibits denitrification processes, since it removes readily biodegradable organic carbon at a higher rate than nitrate can. If, in the pre-anoxic zone denitrification process, the internal recycling ratio is, e.g., 4 Q, with 3 mg L–1 DO denitrification of 4 · 3/2.9, about 4 mg L–1 nitrate nitrogen is prevented. On the other hand it is possible, in an aeration tank operated with, e.g., 1 mg L–1 DO, for some nitrate to disappear. This is attributed to zero DO within the flocs of mixed liquor where some nitrate is then denitrified.
3.2.5
Phosphorus Removal
Phosphorus removal in most cases is required today; usually a concentration of CP,e < 1–2 mg L–1 has to be maintained. Excess phosphorous is removed by simultaneous precipitation, frequently in combination with enhanced biological phosphorous removal. With a mixing tank upstream of the biological reactor for nitrifi- cation–denitrification with a retention time of 15 to a maximum of 30 min, an enhanced biological phosphorous uptake of XP,enh ~ 0.005–0.007·CCOD,0 can be achieved. For the buildup of heterotrophic biomass, XP,BM = 0.005·CCOD,0 can be assumed. Under these conditions, the concentration of phosphorous to be precipitated is calculated with Eq. 29:
XP,prec = CP,0 – CP,e – XP,BM – XP,enh |
(29) |
The effluent concentration should be assumed to be CP,e = 0.6–0.7 of the effluent standard to be maintained. The average requirement for precipitant is calculat-

96 3 Activated Sludge Process
ed as 1.5 mol Me3+ mol–1 XP,prec. With these requirements, Eqs. 30 and 31 are obtained:
Precipitation with iron: |
2.7 mg SFe mg–1 XP,prec,Fe |
(30) |
Precipitation with aluminum: |
1.3 mg SAl mg–1 XP,prec,Al |
(31) |
The additional mass of excess sludge resulting from phosphorous removal can be calculated with Eq. 32:
Mexc,P = Qd · (3 · XP,enh + 6.8 · XP,prec,Fe + 5.3 · XP,prec,Al)/1000 |
(32) |
For details on phosphorous removal, see Schön and Jardin [53].
3.2.6
Environmental factors
3.2.6.1 Dissolved oxygen
The dissolved oxygen concentration (DO), the pH, and toxic substances in the wastewater are considered as environmental factors that may inhibit the biological reactions.
In plants with properly designed aeration systems, process disturbances can occur only because of inadequate control of DO. The adverse effects are higher with respect to nitrification than with respect to organic carbon removal, because some organic carbon (even at low DO) may be removed by adsorption, but ammonia cannot be adsorbed and furthermore the growth rate of nitrifiers is reduced at low DO (Eq. 19).
3.2.6.2 Alkalinity and pH
The pH in biological reactors depends partly on the pH of the incoming wastewater, if the wastewater contains inorganic acids. The pH is influenced much more by the remaining alkalinity and the concentration of carbon dioxide in the mixed liquor. The remaining alkalinity, which should not drop below Salk,e = 2 mmol L–1, can be calculated with Eq. 33:
Salk,e = Salk,0 – 0.07 · (SNH4,0 |
– SNH4,e |
– SNO3,e) – 0.06 · SFe3+ |
(33) |
|
– 0.04 · SFe2+ – 0.11 · SAl3+ + 0.03 · (SP,0 – SP,e) |
||||
|
||||
Alkalinity is expressed in mmol L–1, the nitrogen and phosphorous concentrations are in mg L–1, and the possible precipitants for phosphate removal (iron and aluminum) are in mg L–1 of incoming wastewater flow. If the precipitants contain free acids or bases, these have to be taken into account separately.
The pH in the reactor is a function of the remaining alkalinity (Eq. 33), the production of carbon dioxide, and the stripping effect of aeration (Table 3.3) [54, 55].

3.2 Technological and microbiological aspects 97
Table 3.3 pH in the biological reactor, calculated according to Nowak [54].
Salk,e |
Oxygen Transfer Efficiency (OTE) |
|
|
|
||
mmol L–1 |
|
|
|
|
|
|
6% |
9% |
12% |
18% |
24% |
|
|
|
|
|||||
|
|
|
|
|
|
|
1.0 |
6.6 |
6.4 |
6.3 |
6.1 |
6.0 |
|
1.5 |
6.8 |
6.6 |
6.5 |
6.3 |
6.2 |
|
2.0 |
6.9 |
6.7 |
6.6 |
6.4 |
6.3 |
|
2.5 |
7.0 |
6.8 |
6.7 |
6.5 |
6.4 |
|
3.0 |
7.1 |
6.9 |
6.8 |
6.6 |
6.5 |
|
|
|
|
|
|
|
|
The daily average oxygen transfer efficiency (OTE) is shown as percentages in Table 3.1. Assuming 300 g O2 per m3 air, 1.2 kg O2 to be transferred per kg oxygen uptake (to maintain a DO of >1.5 mg L–1), and 10 g of O2 transferred per m3 of air and per meter of diffuser below the water surface (hair), the OTE is obtained from Eq. 34:
OTE [as %] = 100 · |
10 · hair |
(34) |
|
300 · 1.2 |
|||
|
|
3.2.6.3Toxic substances
Biodegradable and nonbiodegradable toxic substances must be distinguished. Nonbiodegradable toxic substances should be retained by on-site treatment or can be removed by pretreatment (which is usually not possible).
Biodegradable organic toxic substances such as phenols and cyanides can be almost completely removed if
•They are continuously present in the wastewater so that the microorganisms can synthesize the appropriate enzymes.
and
•Their concentration in the mixed liquor is kept as low as possible at any time; shock loads should therefore be avoided.
A balancing tank for the wastewater stream containing the toxics is the most appropriate measure to overcome shock-load problems. The biological reactor should be completely mixed so as to avoid higher concentrations in any section. Intensive chemical analysis of the reactor, preferably by online monitoring, must be performed to detect anomalies such as increasing concentrations of the toxic substance as early as possible. If this happens, the wastewater feed must be decreased or completely shut down until conditions in the reactor are stabilized.
Nitrifiers are far more sensitive to toxic substances than are heterotrophs. If organic carbon removal is not inhibited, denitrification also is usually not inhibited. But since some biodegradable organic toxic substances cannot react with nitrate

98 3 Activated Sludge Process
instead of dissolved oxygen, they may accumulate in denitrification tanks and inhibit denitrification.
3.2.7
Properties of mixed liquor
The separation of mixed liquor from treated wastewater in final clarifiers is important for the whole process. The concentration of mixed liquor suspended solids (MLSS) and the sludge volume after 0.5 h of settling (SV30) are two parameters that describe sludge properties. Since, due to wall effects and bridging in determining SV in 1-L measuring cylinders, erroneous results are obtained at SV30 > 300–400 ml L–1, either the diluted SV30 (DSV30) or the stirred SV30 (SSV30) should be measured. For DSV30, the mixed liquor should be diluted with final effluent to obtain 150 mL L–1 < SV > 250 mL L–1. Considering the dilution factor, DSV30 is then calculated from the measured SV. Note that mixed liquor with poor settling characteristics may have a DSV30 value >1000 mL L–1. The dilution method is a common practice in Germany. In other countries the stirring method is preferred; several bars (diameter ~2 mm) are rotated in the measuring cylinder at a speed of 1–2 rpm.
Combining MLSS and SV leads to the sludge volume index SVI, which was proposed by Mohlmann [56]:
SVI = |
SV30 |
SVI = |
SV30 |
(35) |
|
MLSS |
MLSS |
||||
|
|
|
If DSV30 or SSV30 are used in Eq. 35, SVI is called DSVI or SSVI.
The sludge volume index is an overall parameter used to characterize the sludge thickening behavior. An SVI < 100 mL g–1 is regarded as ‘good’, but if the SVI exceeds 150 mL g–1 the sludge is called ‘bulking’. Bulking is mainly caused by the growth of filamentous organisms. It is frequently observed at low-loaded plants, e.g., with nitrogen removal and in plants treating wastewater with a high fraction of readily biodegradable organics. Bulking depends not only on loading and wastewater characteristics but also on the mixing conditions of the biological reactor. In lowloaded completely mixed tanks, sludge tends more to bulking than in plug-flow tanks.
From an engineering point of view, for prevention of sludge bulking it is important to create reactor configurations with a high concentration gradient, as in plugflow tanks or cascaded tanks, and to combine completely mixed tanks with a selector. Even with such precautions the growth of some filamentous organisms, such as Microthrix parvicella, may not be prevented. The literature on causes and control of sludge and bulking foaming is broad [e.g., 57]. Recent observations indicate that the use of aluminum as a phosphate precipitant may inhibit the excessive growth of
Microthrix parvicella.
3.3 Plant Configurations 99
3.3
Plant Configurations
3.3.1
Typical Tanks for mixing and aeration
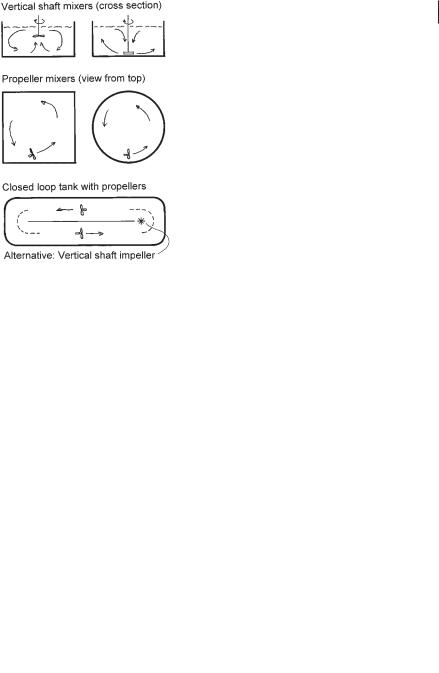
Mixing tanks for denitrification can be square, rectangular, or circular and have mixers in the center or propellers (Fig. 3.12). Rectangular tanks can be visualized as a series of square tanks. In closed-loop, tanks either propellers or vertical shaft impellers maintain the circulating flow.
Fine-bubble diffused-air aeration systems can be installed in almost any type of tank. Tanks for vertical shaft surface aerators are either square or rectangular in which the length is a multiple of the width (Fig. 3.13). Tanks for cyclic aeration are preferably circular or of closed loop type. Aeration equipment as well as appropriate mixers must be installed. Mixing can also be performed by rotating bridges on which diffusers are mounted. (Fig. 3.14). Since the aeration is switched off cyclically, only non-clogging aeration systems, e.g., membrane diffusers for fine bubble aeration are appropriate. Simultaneous nitrification and denitrification in practice is performed mainly in closed-loop tanks equipped with horizontal-axis surface aerators, e.g., mammoth rotors or vertical shaft surface aerators, as in the carousel process. Simultaneous denitrification can also be performed with air diffusers arranged in ‘fields’ in closed-loop tanks (Fig. 3.15).
Fig. 3.12 Typical mixing tanks for denitrification.