

Environmental Biotechnology - Jordening and Winter
.pdf5.2 Basic Principles 141
For more complex systems, such as packedor fluidized-bed reactors, the external mass transfer is usually described by dimensionless analysis, which leads to the correlation characterized by the Sherwood number Sh:
Sh = f (Re, Sc) = |
ke dñ |
(4) |
|||||
D |
|||||||
|
|
|
|
|
|
||
Re = |
dñ u ñ |
|
(5) |
||||
|
|
|
|||||
|
|
||||||
ç |
|
|
|
||||
ç |
|
|
|
|
|||
Sc = |
|
|
|
|
|
(6) |
|
|
|
|
|||||
D ñ
with the Reynolds number (Re) and the Schmidt-number (Sc).
Mulcahy and La Motta (1978) calculated the external mass transfer for a fluidized biofilm with a correlation given by Snowden and Turner (1967):
Sh = |
0.81 |
(7) |
= Re0.5 Sc0.33 |
å
Gonzalez-Gil et al. (2001) showed that the external mass transfer does not play an important role for superficial liquid velocities higher than 1 m h–1.
5.2.3.2Internal Mass Transfer
The diffusion transport of substrate in the biofilm may reduce the reaction rate. For steady-state conditions the net diffusion rate is equal to the reaction rate. Writing the resulting mass balance in a general form gives a second-order differential equation:
Deff |
d2 ci |
+ |
a |
|
dCi |
– r = 0 |
(8) |
dx2 |
x |
dx |
|||||
where Deff is the effective pore diffusion coefficient, ci the concentration of substrate i, x the position in the porous particle, r the reaction rate, and a a geometrical factor: for a plate a = 0, for a cylinder a = 1, and for a sphere a = 2.
The diffusion coefficient in the biofilm (Deff) may be smaller than in water. By comparing acetate diffusion with lithium diffusion, Kitsos et al. (1992) found a value of 7%, related to the diffusivity in water (6.6 × 10⁻¹⁰ m2 s–1). Ozturk et al. (1989) calculated an effective diffusion coefficient of 1.7 × 10⁻¹⁰ m2 s–1 from measurements with inactive anaerobic biofilms. These values are lower than those determined for glucose or oxygen in aerobic biofilms, where the values are nearly the same as for water (Horn and Hempel, 1996). Kitsos et al. (1992) attribute this disagreement to differences between aerobic and anaerobic biofilms with regard to the symbiosis between the bacterial groups in anaerobic biofilms.
Two boundary conditions can be defined, at the support interface and at the interface between the biofilm and the boundary layer:
|
dci |
= 0 |
x = xp |
(9) |
|
|
|||
|
dx |
|
|
|
ci = cis |
x = xb |
(10) |
||

142 5 High-rate Anaerobic Wastewater Treatment
If a zero-order reaction is assumed, integration of Eq. (5) with the boundary conditions yields the expression given by Shieh and Keenan (1986):
|
xc |
3 |
|
|
|
xc |
|
2 |
1 |
3 |
|
|
|||||
|
|
|
|
|
|
|
|
|
|||||||||
|
|
|
|
– 1.5 |
|
|
|
+ |
|
– |
|
= 0 |
(11) |
||||
xb |
|
xb |
|
2 |
2 |
||||||||||||
where the Thiele modulus is defined as |
|
||||||||||||||||
|
|
|
|
|
|
|
|
|
|
|
|
|
|
|
|
|
|
= xb ; |
ñ k0 |
|
|
|
|
|
|
|
(12) |
||||||||
Deff ci |
|
|
|
|
|
|
|
|
|||||||||
Hence, the effectiveness factor can be calculated for cS > 0.
For first-order reactions Shieh et al. (1982) showed good agreement between ç and the Thiele modulus given by
ç = |
coth (3 tm) |
– |
1 |
(13) |
tm |
3 21m |
with a modified first-order Thiele modulus 1m:
1m = (ñk1 ci)0.5 |
x3b – x3p |
(14) |
|
x3b |
|||
|
|
Since anaerobic reactors are generally run at substrate concentrations that are high in relation to the substrate affinity constant, zero-order kinetics are a useful way for calculating diffusion limitation.
5.2.4
Support Characteristics
Many different support materials have been tested for use in fixed-film stationary and fluidized-bed reactors. The major factors for bacterial attachment and growth to both systems are their roughness and porosity. The process configurations are discussed separately, because of differences in the relative importance of these factors and because additional factors may apply to only one of the systems.
5.2.4.1 Stationary Fixed-film Reactors
Supports in fixed-bed reactors must meet the following specific requirements for scale-up: Biogas must be separated from the fluid phase, and its transport must be possible through the full-scale reactor, for distances of up to several meters and under conditions of gas holdup of up to 3%, without major pressure drop. Supports with small dimensions (a few mm or less) are therefore not suited for this reactor type. Most supports tested with success up to the pilot or industrial scale offer suffi-

5.2 Basic Principles 143
cient hydrodynamic radii (in general >20 mm) and a very high void volume (over 70%, mostly more than 90%). As a consequence the support surface per volume is rather low, the concentration of biomass in the surface fixed film is low as well and the suspended biomass in the void volume contributes considerably to the activity (Weiland and Wulfert, 1986). The maximal volumetric load is distinctly lower in general than in expanded or fluidized-bed reactors.
Supports utilized in most applications are typically internals, such as Raschig or Pall rings, Berl or Intalox saddles, plastic cylinders, clay blocks or potter’s clay of dimensions typically in the range of 20–60 mm (Henze and Harremoes, 1983; Young and Dahab, 1983; Weiland et al., 1988). Trends in application favor supports with a void volume of >90% and a surface area in the range 100–300 m2 m–3 (AustermannHaun et al., 1993).
5.2.4.2Fluidized-bed Reactors
The choice of support material determines the process engineering much more than for packed bed reactors, because the fluidization characteristics depend on the density and the diameter of the support.
To calculate the fluidization behavior, considering only ideally spherical particles without a biolayer, one starts with the terminal settling velocity for a single particle at infinite dilution:
uT = ; |
4 g dp ñp – ñL |
(15) |
3 CD ñL |
where g is the gravitational acceleration. The terminal settling velocity uT depends on the particle diameter dp, the drag coefficient CD, and the difference in densities between the particle ñp and the liquid ñL. CD correlates with the particles’ Reynolds number Rep:
Rep = |
uT dp |
(16) |
|
íL |
|||
|
|
Equations describing the relation between CD and Rep can be found in the literature. Bird et al. (1960) gave a generally accepted formula for the intermediate range of Reynolds numbers (1 < ReP < 50):
CD = |
18.5 |
(17) |
0.6 |
||
|
Re p0- |
|
From these equations, the single-particle settling velocity can be calculated by iteration.
However, to calculate the fluidized-bed expansion additional effects of the reactor wall, as well as the characteristics of flow and of adjacent particles, have to be considered. Usually the fluidization is then described with empirical equations. The corre-

144 5 High-rate Anaerobic Wastewater Treatment
lation used most frequently for fluidized beds is given by Richardson and Zaki (1954):
u = uT * ån |
(18) |
where u is the superficial liquid velocity, uT* is the settling velocity of the particle swarm (equal to uT × 10–dP/dR), å is the bed voidage, and n is an expansion index. n is given as follows, provided that the particle diameter is much smaller than that of the bed:
n = 4.65 |
|
ReT ≤ 0.2 |
n = 4.35 |
× ReT–0.03 |
0.2 ≤ ReT ≤ 1 |
n = 4.45 |
× ReT–0.1 |
1 ≤ ReT ≤ 500 |
n = 2.39 |
|
500 ≤ ReT ≤ 7000 |
For anaerobic fluidized beds, n can normally be calculated for particle terminal Reynolds number in the range 1–500.
Most of the materials (e.g., granular activated carbon, pumice, sepiolite) used as supports for anaerobic fluidized beds are not ideal spheres and show a distribution of particle diameters. Thus the Sauter diameter dV/S should be used in the above calculations; this is defined as
dV/S = |
# x qr (x) dx |
(19) |
|
# qr (x) dx |
|||
|
|
where qr is the amount of particles (of volume or surface fraction) with diameter x. A sphericity factor Ö can be determined by microscopic comparison of particle shape with model geometrical figures given by Rittenhouse (1943). From these values the voidage can be described with a correlation of Wen and Xu (1966):
1 – å |
Ö |
|
||
|
= 11 |
(20) |
||
å3 |
||||
|
|
|
||
Volume contraction has to be considered for the calculation of å, if a mixture of different particle sizes is used. A detailed calculation procedure is given by Ouchijama and Tanaka (1981).
The easiest way to determine the fluidization behavior is to conduct experiments in laboratory-scale reactors. To obtain representative data it is necessary that the ratio of the reactor diameter to the particle diameter be at least 100. However, the growing biofilm and possible precipitation of inert solids may cause significant changes in the fluidization behavior. Therefore, it is very important to use real wastewater and to control the fluidization until a dynamic steady state is reached.

5.3 Reactor Design Parameters 145
5.3
Reactor Design Parameters
The development of any anaerobic system requires evaluation of optimal conditions affecting several factors. For fixed-film systems this includes especially the choice of support, the reactor geometry, the startup procedure, and the handling of excess sludge or inert support.
5.3.1
Scale-up
Concepts for scale-up have been summarized by Kossen and Oosterhuis (1985); dimensional analysis and rules of thumb may be mentioned, since they provide guidance and recourse to practical experience. Fluid flow and fluidization can be treated with the aid of Reynolds, Peclet, and Froude numbers so as to estimate regimes appropriate for technical-scale operation (Mösche, 1998). However, a rational design seems very difficult because of the high complexity of the systems. Therefore, empirical rules are mostly used in practice to design technical reactors (Henze and Harremoes, 1983).
The most important parameter is the load of biodegradable organics in terms of COD. This must be correlated with the active biomass in the reactor. So a load of 1–1.5 kg (COD) kg–1 (VSS) d–1 is considered the upper limit for stable operation, and the following correlation can be used for guidance (Henze and Harremoes, 1983):
BV,COD = |
X/ôX – BV,inert |
(21) |
|
Y |
|||
|
|
where BV,COD denotes the volumetric loading rate, X the biomass concentration, ôx the biomass retention time, BV,inert the volumetric loading rate of non-biodegradable solids and Y the yield coefficient.
A range of additional parameters of high significance should be taken into account: geometrical dimensions and HD–1; recirculation rate, determining the substrate dilution and pH (and their gradient); residence time and distribution; mixing behavior; flow rate, pressure drop, and energy requirements; fluidization and bed expansion.
The recirculation rate, inlet substrate concentration, and pH and its gradient are correlated with one another, and they are highly important aspects since the stability of the stationary operation greatly depends on them, as discussed below (Burkhardt and Jördening, 1994; Mösche, 1998).
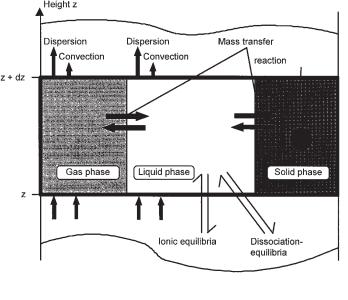
An example for modeling an industrial fluidized-bed reactor as a guide to scale-up and optimization of its operation was presented by Schwarz et al. (1998). The model comprises those aspects that were most sensitive in affecting the results: material balance equations for substrates and products in the gas and liquid phases, kinetics of biological degradation, mass transfer between gas and liquid phases, chemical equilibria, as well as convection and dispersion (Fig. 5.3).
146 5 High-rate Anaerobic Wastewater Treatment
Fig. 5.3 Finite volume in a fluidized-bed reactor and fluxes considered (Schwarz et al., 1996).
Maximum individual reaction rates for the different substrate components turned out to be the most sensitive to substrate and product concentrations as well as to pH. With scale-up, the ratio of feed and recirculation increases, since the flow rate is limited by the carrier settling velocity. Axial gradients of pH were calculated and turned out to be most sensitive to the load (Fig. 5.3) and the buffer capacity. Thus, at high loading rates, dynamic changes in the feed composition could lead to a decrease in pH in the lower part of the reactor and to breakdown of the system. Backmixing turned out to be of minor importance in this system (500 m3 volume and 18 m height of the fluidized bed). A distribution of substrate feeding at two positions, the bottom and at medium height, overcame problems with greater concentration gradients. The corresponding increase in the superficial upflow velocity restricts this possibility only for highly concentrated wastewaters. Otherwise, problems caused by a higher segregation of the bed would occur. For pumice as support material, an increase in the superficial upflow velocity of 10% in the upper half of the fluidized bed did not cause any problems (Mösche, 1998).
The buffer capacity of the water is significantly influenced by CO2 and its equilibrium concentration as a function of pressure and of ions such as calcium present in the wastewater.
5.3.2
Support
Many support materials have been investigated in laboratory-scale reactors for use in packedor fluidized-bed systems (Henze and Harremoes, 1983). Despite this, the number of supports that are used even in technical-scale systems is rather low. Cer-

5.3 Reactor Design Parameters 147
tainly, one big problem for the implementation of new processes is due to the difficulty of cooperation with manufacturers. But the problems often result from shortcomings in the studies with respect to requirements of large-scale application. For successful use of any material as a support in fixed-film stationary or fluidized-bed reactors on the technical scale, the following general requirements should be met:
•availability of the material in large quantities (>1000 m3)
•low cost of the material (related to the achievable performance; it should in general be less than 150 $US m–3)
•inert behavior (mechanically and microbially stable) without toxic effects and easy disposal
•low pressure drop (low energy demand for mixing or fluidization)
5.3.2.1Stationary-bed Reactors
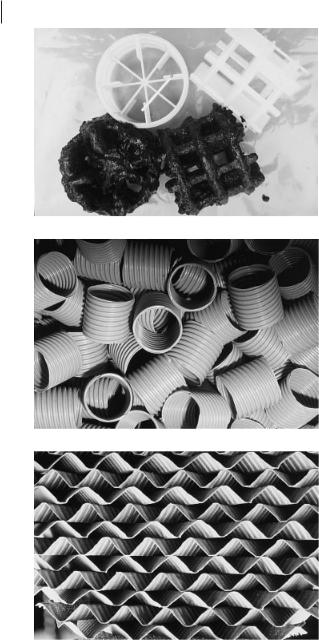
A selection of supports, which seem to have been applied successfully on the pilot and industrial scale, is summarized in Table 5.1; examples are shown in Figure 5.4.
The biofilm thickness is of limited significance in fixed-bed reactors since it makes up a minor part of the biomass. Published data are mostly in the range 1–4 mm, the upper limit relating to the inflow zone (top of a reactor operated in downflow) (Switzenbaum, 1983; Andrews, 1988).
More important is the biomass concentration in the reactor, which is distributed into two fractions, one immobilized in the biofilm, the other suspended in the void volume of the reactor (Hall, 1982; Weiland and Wulfert, 1986). The organic dry biomass in pilot reactors is mostly in the range 5–15 kg m–3 (Henze and Harremoes, 1983). Gradients in the concentration of biomass are observed, with the maximum near the reactor inlet [e.g., about 15 kg m–3 in the lower and 4 kg m–3 in the upper part for upstream operation (Weiland and Wulfert, 1986)]. Gradients were also found by Hall (1982), which depended on the flow direction: 6 kg m–3 of fixed biomass and 9 suspended for upstream, and 9 fixed and 4 suspended for downstream operation (all in kg m–3 organic dry matter). For an industrial starch-processing
Table 5.1 Typical supports for fixed beds.
Support |
Diameter |
Surface |
Bed |
Equivalent |
Reference |
|
|
Area |
Porosity |
Pore |
|
|
(mm) |
(m2 m–3) |
|
Diameter |
|
|
|
|
|
|
|
Raschig rings |
10–16 |
45–49 |
0.76–0.78 |
|
Carrondo et al. (1983) |
Pall rings |
90 |
102 |
0.95 |
>20 |
Young and Dahab (1983) |
corrugated |
|
|
|
|
|
modular blocks |
|
98 |
0.95 |
>46 |
|
Pall rings |
25 |
215 |
|
|
Schultes (1998) |
Hiflow 90® |
90 |
65 |
0.965 |
>30 mm |
Weiland et al. (1988) |
Plasdek C. 10® |
|
148 |
0.96 |
>30 mm |
Weiland and Wulfert (1986) |
Flocor R® |
|
320 |
97 |
>30 mm |
|
Ceramic Raschig rings |
25 |
190 |
0.74 |
|
Andrews (1988) |
|
|
|
|
|
|
148

5.3 Reactor Design Parameters 149
plant a biomass concentration of 20 kg m–3 was reported (Schraewer, 1988). A high biomass concentration was reported for a special support, sintered glass fillings (expensive): up to 65 kg m–3 in laboratory-scale experiments, of which 31 kg m–3 was found to be immobilized within the inner pores of the support (Ney et al., 1989).
5.3.2.2Fluidized-bed Reactors
The energy demand for fluidization of the support is often said to be very high, in contrast to the energy requirements of other anaerobic techniques. In general, much higher volumetric flow rates have to be achieved in comparison to those in a CSTR. Nevertheless, the energy demand is relatively low, because only the additional pressure drop of the support has to be overcome. Hence, with respect to higher loading rates, the overall energy demand is in the same range or lower than in CSTRs, depending on the support density. Table 5.2 shows some materials that have been tested for use as supports in anaerobic fluidized-bed systems. All materials have particle diameters significantly less than 1 mm, which results in a greater surface area for colonization, decreased superficial upflow velocity and no diffusion limitation, even for porous materials.
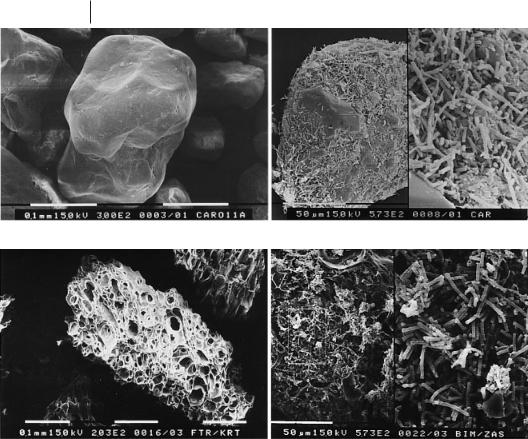
Porous materials have the advantage of lower superficial upflow velocities than nonporous materials have. In addition, biomass gradients mainly occur in reactors filled with nonporous materials (Anderson et al., 1990; Jördening, 1987). Franklin et al. (1992) reported that a sand fluidized-bed reactor contained only uncovered bare sand in the bottom part. They attributed this to the extreme shear forces, which have a large influence on bacteria on the surface. Bacteria in pores are protected against shear forces, and therefore, such pronounced gradients are not known when porous materials are used. Figure 5.5 shows some porous and nonporous supports. Nakhla and Suidan (2002) showed close agreement for the detachment of bacteria in differ-
Table 5.2 Support materials for anaerobic fluidized-bed systems.
Support |
Diameter |
Density |
Surface |
Porosity |
Upflow |
Biomass |
Reference |
|
|
|
Area |
|
Velocity |
|
|
|
(10–3 m) |
(kg m–3) |
(m2 m–3) |
|
(m h–1) |
(kg m–3) |
|
|
|
|
|
|
|
|
|
Sand |
0.5 |
2540 |
7100a |
0.41 |
30 |
4–20 |
Anderson et al. (1990) |
Sepiolite |
0.53 |
1980 |
20 300b |
|
|
32 |
Balaguer et al. (1992) |
GAC |
0.6 |
|
|
|
|
34 |
Chen et al. (1995) |
Biomass granules |
|
|
|
|
2–6.5 |
|
Franklin et al. (1992) |
Sand |
0.1–0.3 |
2600 |
|
|
16 |
40 |
Heijnen (1985) |
Biolite |
0.3–0.5 |
2000 |
|
|
5–10 |
30–90 |
Ehlinger (1994), |
|
|
|
|
|
|
|
Holst et al. (1997) |
Pumice |
0.25–0.5 |
1950 |
2.2 × 10⁶ |
0.85 |
10 |
|
Jördening (1996), |
Jördening and Küster (1997)
a Calculated from the given data with the assumption of ideal sphericity. b Calculated with data given in Sanchez et al. (1994).
150 5 High-rate Anaerobic Wastewater Treatment
a |
b |
c |
d |
Fig. 5.5 Support materials for anaerobic fluidized-bed reactors (a and b uncovered and biofilm-covered sand, c and d uncovered and biofilm-covered pumice particles).
ent reactors by normalizing the coefficients of the shear force and the daily methane production per unit biofilm area.
A special type of fluidized system uses granular pellets without a solid support. These pellets, used in so-called expanded granular sludge beds (EGSB) have a diameter of 1–3 mm and can therefore also be expanded by higher superficial upflow velocities of up to 20 m h–1 (Lettinga et al. (1999)).
5.3.3
Wastewater
Wastewater should be acidified to a high degree (>80%, related to COD). Otherwise, acidifying bacteria could lower the pH, overgrow the methanogenic biofilm and thus reduce the methanogenic activity. Thus two-stage systems are considered superior, since their performance in terms of stability and space–time yield is superior to that of one-stage systems. The load of reactors fed with volatile fatty acids (in a system