
Environmental Biotechnology - Jordening and Winter
.pdf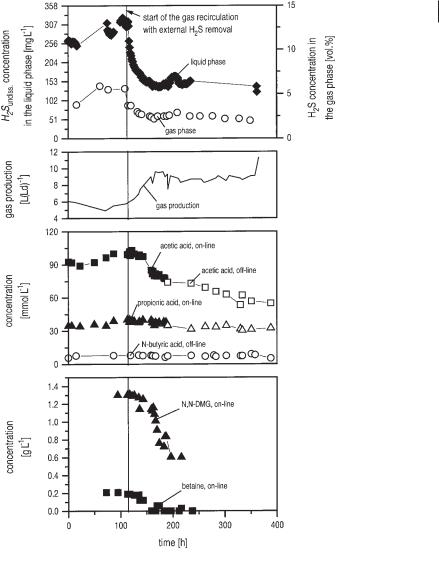
6.3 Kinetics 171
Fig. 6.7 Combined measurement with the silicon membrane probe mass spectrometer and online high-pressure liquid chromatography in a laboratory upflow anaerobic sludge blanket (UASB) reactor with and without elimination of H2S in an external biogas recirculation loop over a period of some hundred hours (after Polomski, 1998). Online measurements were carried out in cooperation with Zumbusch et al. (1994). H2S concentrations were detected by the silicon membrane probe and mass spectrometer.
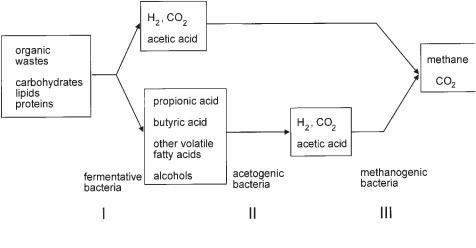
(Fig. 6.8). In a first step, complex biopolymers (lipids, proteins, carbohydrates) are split into the monomers which can be assimilated by the microbial cell. This first breakdown is catalyzed by extracellular enzymes. In a second step, fermentative bac-
172 6 Modeling of Biogas Reactors
Fig. 6.8 Pathway of anaerobic biodegradation.
teria form hydrogen, carbon dioxide, acetic acid, propionic acid, and further intermediary products, predominantly volatile fatty acids.
Acetic acid, carbon dioxide, and hydrogen can be directly converted to methane and carbon dioxide (biogas) by methanogenic bacteria. Propionic acid as well as the other intermediates cannot be directly transformed to biogas. In an intermediate step, the so-called acetogenic bacteria have to generate acetic acid, carbon dioxide, and hydrogen which then can be converted to biogas again. Thauer et al. (1977) showed that for thermodynamic reasons the degradation of propionic acid is only possible at very low concentrations of hydrogen (1 Pa). From this argument it is clear that the acetogenic reaction which generates hydrogen can be performed only by a direct and close synthrophic cooperation with methanogenic bacteria which consume hydrogen. Sulfate, a frequent component in almost all food industries’ wastewater, is almost totally converted to hydrogen sulfide.
The dynamic behavior of the system is mainly controlled by the conversion of acetic acid to methane and carbon dioxide. This reaction is rather slow and, therefore, it is the bottleneck of the anaerobic digestion, as demonstrated by experiments like those shown in Figure 6.9. Whey which contains about 5% lactose, is continuously digested to biogas. At the beginning of the experiment the concentration of the different volatile acids denoted in Figure 6.9 represent a steady state. In this situation the reactor was heavily overloaded during the next 2.5 h. As a result, the concentration of acetic acid increased by a factor of 5. The concentrations of the other acids remained more or less constant. This finding supports the idea of Graef and Andrews (1973) that the conversion of acetic acid to methane and CO2 is the rate-limiting step and that a mathematical model of the anaerobic degradation process can be reduced to this dominating reaction.
This simple idea is expressed in Figure 6.10 and Eqs. 1 and 2, which describe the concentration of microorganisms x and the concentration of acetic acid Ac as a function of time.

6.3 Kinetics 173
Fig. 6.9 Concentration of the different volatile acids as a function of the time during the continuous anaerobic degradation of whey, a byproduct of cheese production (after Märkl et al., 1983). The experiments were performed in a 20 L stirred tank reactor. The graph shows the dynamic behavior of the system after being heavily overloaded with whey during the first 2.5 h of the experiment.
Fig. 6.10 Mathematical model of anaerobic digestion in a stirred tank reactor. The reactor is directly fed by acetic acid (concentration in the inlet: cAc,e). The concentration of acetic acid in the reactor is cAc, x denotes the concentration of biomass.
dx |
|
|
· |
|
|
|
|
||
= µ (cAc, ci) x – |
V feed |
x |
|
|
(1) |
||||
|
|
|
|
||||||
dt |
|
|
Vreactor |
|
|
|
|||
|
|
|
· |
|
|
|
1 |
|
|
dcAc |
= |
V feed |
(cAc,e – cAc) – |
µ (cAc, ci) x |
(2) |
||||
|
|
|
Y- |
||||||
dt |
Vreactor |
|
|
||||||
The reactor is directly fed by acetic acid cAc,e. The growth rate of the microorganisms is denoted as µ (cAc, ci), and the biogas production can be assumed to be directly proportional to µ. At a first glance, this model looks very simple. The real problem when solving the equation is that we need information on the kinetics of the reaction. The growth rate µ is a function of the acetic acid concentration cAc but may also depend on the concentrations of other substances ci. Before going into detail of

174 6 Modeling of Biogas Reactors
formulating this kinetic equation one should understand more about the physicochemical state of the fermentation broth.
Acetic acid is dissociated to a large extent in the relevant pH range between 6.6 and 7.4. The pH value is calculated on the basis of the activity of H + , which equals
ã1 · cH+ .
The concentration of H+ ions cH+ can be calculated according to Eq. 3 which represents the electroneutrality of the fermentation broth:
(3)
cOH– + cAc– + cPro– + cHCO3– + cHS – = cNH+4 + cH + + Z
The amounts of negative and positive ions must be balanced.
The most important ion concentrations in this calculation are the concentrations of dissociated acetic acid cAc– and propionic acid cPro–, OH – ion cOH–, hydrocarbon ion cHCO3–, and dissociated hydrogen sulfide cHS–. Besides the Hc ion, the ammonium ion (concentration cNHc4 ) has a positive charge. Z represents the pool of not extra specified ions which are necessary to balance the equation and are assumed to be constant during the different stages of fermentation.
The concentrations of these ions can be calculated according to Eqs. 4–14.
HAc IAc – + Hc |
|
|
|
|
|
|
cAc = cHAc + cAc– |
|
|
||||||||||||
H Pro IPro– + Hc |
|
|
|
|
|
|
cPro = cH Pro + cPro– |
|
|||||||||||||
H2O + CO2 IHCO3– + H+ |
|
|
|
|
|
|
|
|
|||||||||||||
HCO– ICO2– |
+ Hc |
|
|
c |
= c |
CO2 |
+ c |
|
– + c |
2– |
|||||||||||
3 |
3 |
|
|
|
|
|
|
|
|
|
C,tot |
|
|
HCO3 |
CO3 |
||||||
H2S IHS– + Hc |
|
|
|
|
|
|
|
|
|
|
|
|
|
|
|||||||
HS– IS2– + Hc |
|
|
|
|
|
|
|
cS,tot |
= cH |
S + cHS– + cS2– |
|||||||||||
|
|
|
|
|
|
|
|
|
|
|
|
|
|
|
|
2 |
|
|
|
|
|
H2O + NH3 INH4c + OH– cN,tot = cNH |
+ cNHc |
|
|||||||||||||||||||
|
|
|
|
|
|
|
|
|
|
|
|
|
|
|
|
|
3 |
|
4 |
|
|
|
|
1 |
|
|
|
–14 |
|
|
|
|
2 |
|
–2 |
|
|
|
|
|
|
|
|
cOH– |
= |
|
· 10 |
|
mol |
|
L |
|
|
|
|
|
|
|
|
||||||
cHc |
|
|
|
|
|
|
|
|
|
|
|||||||||||
cAc– |
= |
|
|
KD,Ac |
|
|
|
|
cAc |
|
|
|
|
|
|
|
|
||||
KD,Ac + cHc ã12 |
|
|
|
|
|
|
|
|
|||||||||||||
cPro– |
= |
|
|
KD,Pro |
|
|
|
|
cPro |
|
|
|
|
|
|
|
|||||
KD,Pro + cHc ã12 |
|
|
|
|
|
|
|
||||||||||||||
cHCO–3 |
= |
|
|
KD,COI |
|
|
|
|
cC,tot |
|
|
|
|
|
|
|
|||||
|
|
|
|
|
2 |
|
|
|
|
|
|
|
|
|
|
|
|||||
|
KID,CO + cHc ã12 |
|
|
|
|
|
|
|
|||||||||||||
|
|
|
|
|
|
|
|
|
|
|
|
|
|||||||||
cHS– |
= |
|
|
KD,HI 2S |
|
|
|
|
cS,tot |
|
|
|
|
|
|
|
|||||
KD,HI |
S + cHc ã12 |
|
|
|
|
|
|
|
|||||||||||||
|
|
2 |
|
|
|
|
|
|
|
|
|
|
|
|
|
|
|
|
|
||
cNHc = |
|
|
KD,NHI |
3 |
|
|
|
|
cN,tot |
|
|
|
|
|
|
|
|||||
KD,NHI |
+ cOHP ã12 |
|
|
|
|
|
|
|
|||||||||||||
4 |
|
|
|
|
|
|
|
|
|
|
|||||||||||
|
|
|
|
|
3 |
|
|
|
|
|
|
|
|
|
|
|
|
|
|
|
|
(4)
(5)
(6)
(7)
(8)
(9)
(10)
(11)
(12)
(13)
(14)
6.3 Kinetics 175
For example, the acetic acid HAc is dissociated to Ac– and H+ according to Eq. 4. The amount of total acetic acid (concentration: cAc) is calculated by the sum of dissociated (cAc–) and undissociated species (cHAc). From these two equations and the knowledge of the dissociation constant KD,Ac and the activity coefficient ã1 the concentration of the dissociated species can be calculated according to Eq. 10. The activity coefficient is calculated by an approximation after Davis which can be found in Loewenthal and Marais (1976). The activity coefficients depend on the ionic strength, which was determined to be 0.235 mol L–1 in wastewater from bakers’ yeast production. The calculation of the dissociation constants was performed after Beutier and Renon (1978). Data for the discussed wastewater are given in Table 6.3.
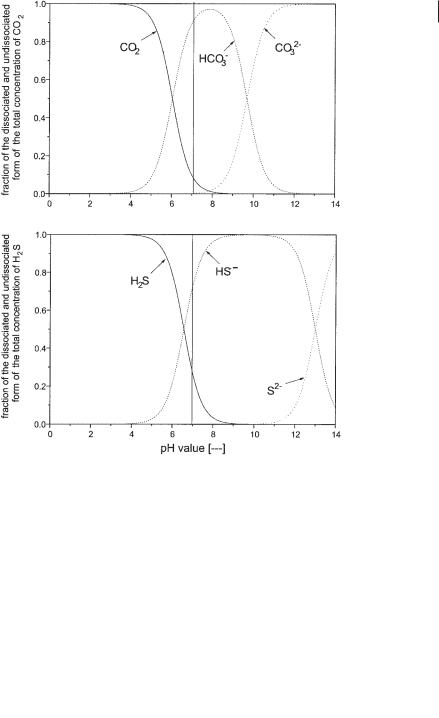
The calculation for the dissociation of CO2 and H2S is in principal more complex because it is performed in two steps according to Eqs. 6 and 7, which are qualitatively shown in Figure 6.11. But from these graphs it is clear that both the concentra-
Fig. 6.11 Dissociation of CO2 and H2S as a function of pH.
1766 Modeling of Biogas Reactors
Table 6.3 Equilibrium constants for wastewater of bakers’ yeast production, temperature 37.4 °C.
|
|
|
Activity Coefficients |
|
|
|
|
|
|
ã1 |
|
0.73 |
|
Monovalent ion |
|
|
|
||
ã2 |
|
0.28 |
|
Bivalent ion |
|
|
|
|
|
|
|
Dissociation Constant [mol L–1] |
|
|
|
|
|||
KD,Ac |
KD,Pro |
KID,Ac |
KIID,CO |
KID,H |
S |
KIID,H |
S |
KD,NH |
3 |
|
|
|
2 |
2 |
|
2 |
|
|
|
1.17 · 10–5 |
1.3 · 10–5 |
4.94 · 10–7 |
5.79 · 10–11 |
1.44 · 10–7 |
2.7 · 10–14 |
6.83 · 10–6 |
|||
|
|
|
|
|
|
|
|
|
|
tions of CO23– and S2– can be neglected in the relevant range of pH between 6.6 and 7.4. Therefore, calculation can be handled like a 1-step dissociation. Eqs. 3, 9–14 give the pH value in implicit form. The pH can be evaluated by a stepwise iterative procedure.
6.3.1
Acetic Acid, Propionic Acid
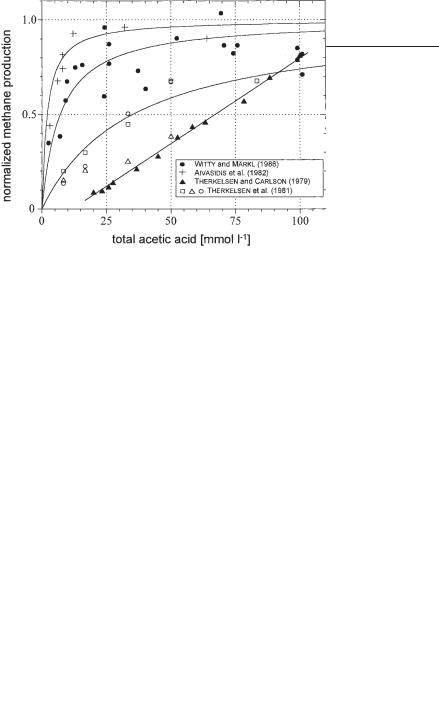
Many experiments have been reported on the growth rate of acetic acid converting organisms with respect to the concentration of acetic acid in the fermentation broth. A reliable collection of those data is presented in Figure 6.12. Because it is very difficult to measure the growth rate of methane producing organisms directly (in a mixed culture it may be impossible) and because it is assumed that this growth rate is directly proportional to the methane production rate, usually the latter value is taken as a measure of bacterial activity. In Figure 6.12 the methane production rate, related to the maximum methane production rate of a biogas reactor, is denoted on the ordinate of the graph.
Fig. 6.12 Methane production as a function of the concentration of total acetic acid.
6.3 Kinetics 177
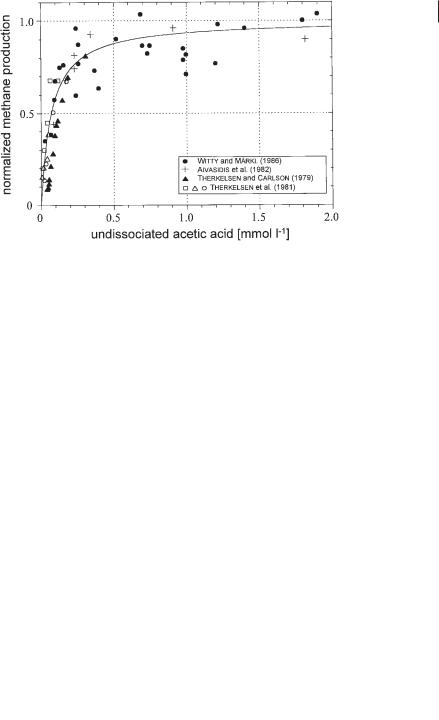
On the abscissa the concentration of the total acetic acid measured in the fermentation broth is denoted. Data of different systems are collected. Witty and Märkl (1986) reported the digestion of waste mycelium from antibiotics production, Therkelsen and Carlson (1979) and Therkelsen et al. (1981) digested a complex artificial substrate, and Aivasidis et al. (1982) studied a pure culture of Methanosarcina barkeri which was directly fed with acetic acid. Due to the complexity of the synthrophic reaction system and also due to the unstable nature of the biogas reaction, the data points reflecting the experimental results of the different authors are somewhat scattered. But apart from this phenomenon, it can be stated that the general behavior of the different systems differs to a large extent from one to the other.
In Figure 6.13 exactly the same experimental data are presented. Here, the abscissa denotes only that part of the acetic acid that is not dissociated.
The undissociated acetic acid can be calculated with the help of Eq. 15 if the total acetic acid and the pH value are known.
cHAc = |
cHc ã 12 |
(15) |
|
|
cAc |
||
|
|||
|
KD,Ac + cHc ã 12 |
|
|
It can be easily seen that this parameter integrates all experimental data into a clear picture. From this finding it was concluded that the microorganisms use and only ‘see’ the undissociated form of acetic acid. The graph drawn in Figure 6.13 has the form of Michaelis–Menten kinetics, the Ks value is 0.07 mmol L–1.
The Ks value represents the concentration of substrate that corresponds to 50% of the maximal reaction rate. Because the undissociated acetic acid represents the relevant substrate, we can also write Ks = KHAc.
To find out if this KHAc value is of a general nature or if it depends on the type of microorganism that is active in the conversion of acetic acid to methane, some more
Fig. 6.13 Methane production as a function of the concentration of undissociated acetic acid.

178 6 Modeling of Biogas Reactors
kinetic data of authors who worked with more defined microbial systems are studied. These data are presented in Figure 6.14. It can be seen that experiments performed with Methanothrix sp. result in a smaller KHAc value (KHAc = 0.02 mmol L–1) than those performed with Methanosarcina barkeri, which correspond to a somewhat higher value (KHAc = 0.12 mmol L–1). This result may be due to the fact that the relative surface of the filamentous Methanothrix sp. is larger than that of the rodshaped Methanosarcina sp.
Altogether, the KHAc value based on undissociated acetic acid is roughly in the range between 0.02 mmol L–1 and 0.12 mmol L–1. In a mixed culture an average value of 0.07 mmol L–1 may be adequate. If this mixed culture contains mainly Metha- nothrix sp. to convert acetic acid, the value will be smaller. If Methanosarcina sp. dominate, the value of KHAc should be higher. The author of this paper used KHAc = 0.07 mmol L–1.
Witty and Märkl (1986) reported that propionic acid inhibits the conversion of acetic acid to methane and CO2. Experiments with different amounts of propionic acid resulted in an inhibition coefficient of KH Pro = 0.97 mmol L–1. Therefore, a concentration of 0.97 mmol L–1 of undissociated propionic acid causes an inhibition of 50% of the rate without propionic acid (Eq. 18).
cH Pro = |
cHc ã |
12 |
|
cPro |
|||
KD,Pro + cHc ã 12 |
|||||||
|
|
|
|||||
cH2S = |
|
cHc ã 12 |
|
|
cS,tot |
||
KD,H |
S + cHc ã12 |
||||||
|
|
2 |
|
|
|
|
|
(16)
(17)
Fig. 16.14 Methane production as a function of the concentration of the undissociated acetic acid. Experimental data of cultures of Methanothrix-like sp. and Methanosarcina barkeri.
µ = µmax |
cHAc |
· |
KH Pro |
cHAc + KHAc |
KH Pro + cH Pro |
KHAc = 0.07 mmol L–1
KH Pro = 0.97 mmol L–1
KH2S = 2.5 mmol L–1
6.3.2
· KH2S KH2S + cH2S
6.3 Kinetics 179
(18)
Hydrogen Sulfide
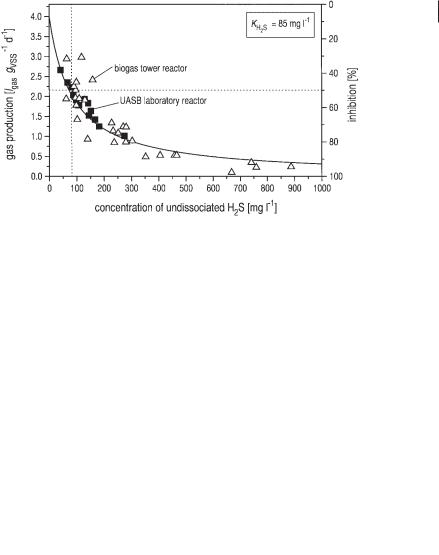
The inhibition of methane generation from acetic acid by H2S is well known. Because the medium sulfate concentration in the wastewater from bakers’ yeast production is as high as 3.9 g L–1, which is almost totally converted to hydrogen sulfide, the problem of H2S inhibition is very substantial. Friedmann and Märkl (1994) reported an inhibition constant of 2.8 mmol L–1 (95.2 mg L–1). Recent experiments of Polomski (1998) on both the laboratory and pilot scale (for experimental apparatus see Figure 6.2) resulted in an inhibition constant of 2.5 mmol L–1 (85 mg L–1). The results of these experiments are shown in Figure 6.15.
Fig. 6.15 Specific gas production of a UASB laboratory reactor and a biogas tower reactor on pilot scale (for both reactors, see Figure 6.2 and Table 6.1) as a function of the concentration of undissociated H2S. The data of gas production are corrected for the influence of acetic acid and propionic acid concentrations according to Eq. 18. VSS: volatile suspended solids (biomass).
6.3.3
Conclusions
As far as the kinetics of the conversion of acetic acid to methane and CO2 are concerned, the results are summarized in Eq. 18. The data given are valid only near the steady state of the system; this means in a pH range between 6.6 and 7.4 and in the
180 6 Modeling of Biogas Reactors
usual range of substrate concentrations. If the system was heavily overloaded for some time and was out of the described range, the microbial population might need some recovering time, which cannot be described by Eq. 18. Figure 6.16 shows a sketch of different configurations in which active microorganisms exist in biogas reactors. They can exist in a freely dispersed form, i.e., as single organisms, or as in the biogas tower reactor in the form of loose pellets. The microbial system can also be immobilized in the form of a film on the wall or as a dense pellet. In the second case the conversion efficiency is also influenced by transport phenomena. The data given in Eq. 18 hold only for freely dispersed organisms. When immobilized microorganisms dominate in a biogas reactor the constants (both saturation and inhibition constants) are larger.
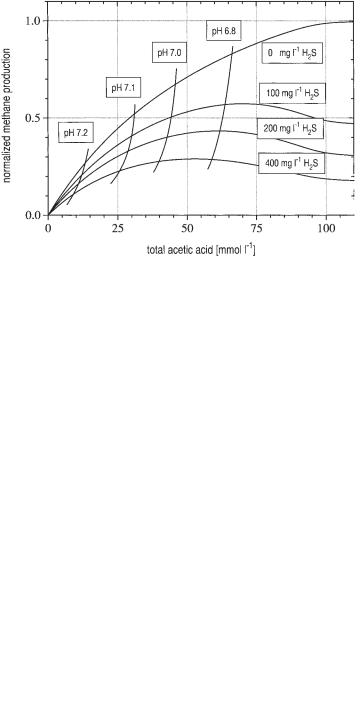
Eq. 18 can also be used to calculate the combined influence of two parameters as demonstrated in Figure 6.17. This graph shows the gas production as a function of
Fig. 6.16 Configuration of the active microbial system.
Fig. 6.17 Methane production as a function of the concentration of total acetic acid at different concentrations of total hydrogen sulfide (cHPro = 0).
