

Physics of biomolecules and cells
.pdfLecture 2c: Bigger is Better in Rachets |
381 |
between rows of obstacles by the field, λ DNA molecules can only reach boundaries L and R in Figure 4b by di usion. Because boundary R is farther than boundary L from the gap where molecules emerge, molecules are more likely to di use across boundary R. Once a molecule reaches field line d, it will be driven to the right. Therefore the obstacle array acts as a Brownian ratchet. The reason that the observed deflection is smaller than what the theory predicted (Fig. 3d) is because the electric field funnels back most molecules that the theory counts as being deflected, such as particle C in Figure 4b. In fact, our experimental data (Fig. 3d) suggest that the old theory can take into account the funneling e ect of the field by using an e ective gap size that is 4.1 times larger than the physical gap size for the calculation of D/va (Fig. 3d).
3 Conclusions
In summary, this lecture clearly shows (at least I hope I clearly showed) that in a continuous-flow Brownian ratchet array, there exists a critical particle size threshold, which is related to the size of the narrowest feature through which the particles must pass in the array. Particles below this threshold maintain their flow along electric field lines through the gaps and are thus incapable of being ratcheted. Particles above this threshold size will be deflected from their original field lines by the obstacles, and can thus be ratcheted. Once above this size, larger particles are ratcheted less because of their lower di usion coe cient. This points to the importance of very narrow gaps in the obstacle array if the separation of small particles is desired.
References
[1]T.A. Duke and R.H. Austin, Phys. Rev. Lett. 80 (1998) 1552.
[2]D. Ertas, Phys. Rev. Lett. 80 (1998) 1548.
[3]A. Oudenaarden and S.G. Boxer, Science 285 (1999) 1046.
[4]C.F. Chou, O. Bakajin, S. Turner, T. Duke, S.S. Chan, E.C. Cox, H.G. Craighead and R.H. Austin, Proc. Natl. Acad. Sci. USA 96(24) (1999) 13762.
[5]M. Cabodi et al., Electrophoresis, in press.
[6]R.H. Austin, N. Darnton, R.L. Huang, O. Bakajin, T. Duke and J. Sturm, App. Phys. A, in press.
[7]L.R. Huang et al., IEDM Technical Digest (2001) 363-366.
[8]J.C. Giddings, Unified Separation Science (Wiley, New York, 1991) 101-106.

382 |
Physics of Bio-Molecules and Cells |
Abstract
I discussed in the introduction to this lecture series that there are two aspects to modern genomics: deciphering the actual sequence of basepairs of a particular organism and then deciphering out of all the possible genes that are present the actual genes that are expressed and the interactions between them... a daunting task. In this lecture I will discuss a possible technique, taken from nanotechnology, that claims to be able to determine the actual occupation of various control elements in the genome.
1 Introduction
The goal of this project is to develop a robust experimental approach to reveal the logic of the transcription code of the DNA of a living cell, because this is the process which controls the function and life of biological organisms. The most immediate challenge for the scientific community, to identify the individual genes in each genome, is well underway, with both experimental and bioinformatic approaches reasonably in hand for the purpose. What is not in hand are intellectual approaches and technologies to understand how the genetic program is interpreted, which is at the heart of the question of how do biological organisms really work?
In broad terms, the genetic program encoded in the DNA is interpreted by the “expression of genes” – i.e. the genes encoded in the DNA each lead to the creation of a specific protein, and the proteins in turn regulate the activity of the cell. But an understanding in precise terms the code or logic by which the cell selects which genes to express, and exactly how this happens in a temporally and spatially appropriate manner is not known. That fundamental challenge is the subject of this proposal.
It is well established that expression of genes requires the interaction of proteins with DNA in the vicinity of the gene, the most significant of which is known as a “transcription factor”. While all cells in an organism have the same DNA, it is di erent transcription factors bound in di erent locations on the DNA, which cause one cell to evolve and function di erent that the next. Furthermore for a relatively small number of genes that have been studied in detail, it is clear that the e cient expression of a gene requires the simultaneous binding of multiple proteins. However how those proteins are chosen, and in what combinations they may productively interact with one another, is unknown.
There are four main directions to our approach for understanding the expression of genes.
I. Preparation of DNA with di erent tagged transcription factors. II. Identification of the location of transcription factors on DNA. III. Regulation and Functional Analysis.

Lecture 3: Going After Epigenetics |
383 |
IV. Proteomic Analysis.
Our general approach will be to combine the expertise of three groups in nanofabrication, molecular biology, and informatics to analyze this problem in the following way.
First, we will continue to develop and adapt a near field device invented at Princeton which is capable of detecting single fluorescent molecules with a spatial resolution of 50 nm.
Second, we will construct strains of E. coli carrying regulatory proteins fused to the Green Fluorescent protein (GFP) that will bind with high a nity to a specific site on the genome. A red-shifted variant of GFP will be designed to bind to a second well-defined site, and the near field detector will be used to measure the distance between them as the DNA flows through the detection channels. These are test of principle strains and apparatus.
Third, a large number of strains for high throughput analysis of the combinatorial code will be constructed by a random insertion technique that will fuse GFP to essentially all of the E. coli transcription regulatory proteins one at a time. These strains will then be analyzed in a massively parallel fashion in the nanofabricated device. The localization of each protein for a variety of cell states will then give us a large and important data base with which to understand the combinatorial code.
Fourth, we will use our strengths in biological computing to begin an analysis of the data base, using clustering algorithms, hierarchical ordering schemes, and vector support machines.
I will examine in this lecture just the near field scanner which is central to the entire scheme, because it is the one subject we have been attacking most vigorously at present.
2 The nearfield scanner
There is a great need in in our approach to obtain the highest possible spatial resolution images of biological structures in the shortest amount of time. The information obtained from such images ranges from mapping of the genome on chromosomal length DNA molecules [1, 2] to obtaining images of surface components on cells. In the case of the work of Schwartz et al. [1] and Bensimon et al. [2] molecular combing techniques are used to map DNA molecules by observing the fragment lengths of restriction cut DNA molecules. Although there are robust computer algorithms used in reconstructing the DNA map, ultimately the information is limited by the spatial resolution R of the microscope objective used, given by R = 0.6λ/N.A., where λ is the wavelength of the light used and N.A. is the numerical aperture of the objective. Although R can approach 0.3 microns for a very well

384 |
Physics of Bio-Molecules and Cells |
designed high N.A. objective, as R decreases the field of view of the objective also decreases and scanning times of molecules become prohibitively long and data rates prohibitively low. Similarly, although high resolution point scanning techniques such as the near-field optical microscope (NSOM) [3] or the atomic force microscope (AFM) [4] can obtain very high spatial resolution images, it is at the cost of relatively slow scanning speeds and the need to find the object to be scanned in a very small field of view compared to the area where the object may be located.
3 The chip
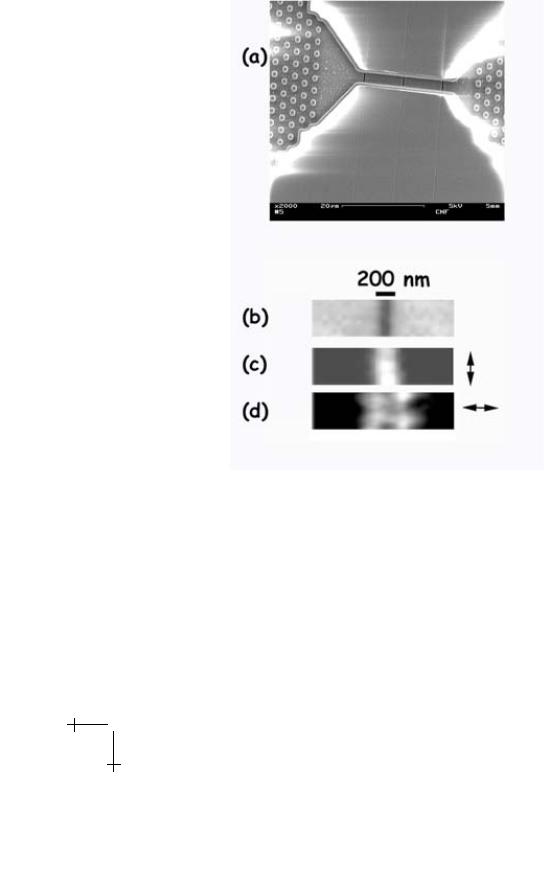
In this lecture we discuss a technology which provides high optical resolution as well as very high data rates for moving molecules. The basic idea is simple: we bring molecules past a near-field slit, the spatial resolution is not determined by the wavelength of light but by the width of the slit. Long slits were nanofabricated in an evaporated aluminum film using electron beam lithography and reactive ion etching. Laser light from a collimated Ar:Kr ion laser was focused onto the back side of the film, creating a nonradiating near field on the other side of the film. When macromolecules pass over the slit in the vicinity of the near-field, fluorophores in the object are excited and can radiate in the far field. A microscope objective captures this far-field radiation which is recorded in a time-dependent manner by a photomultiplier. This time-dependent signal then gives a record of the passage of the object over the slit with a spatial resolution roughly equal to the width of the slit, independent of the resolution R of the objective used. Figure 1a shows a scanning electron microscope image of a completed device. The aluminum floor was 200 nm thick and protected by 100 nm of SiO2, which ultimately gives the limiting resolution for this device. Future devices will have thinner insulating floors. The channel which is oriented perpendicular to the slits is 5000 nm wide and etched to a depth of 1000 nm, much too deep to truly confine the DNA molecules to under their persistence length of 50 nm [5] but easy to fabricate in this first device. An array of posts was used at the entrance to the slits in anticipation of the need to stretch DNA molecules before they entered the slit region. Three slits were used so that the velocity of the molecules as they passed over the slits could be measured by arrival times of molecules at slits of a known spacing. The multiple slits also act as a good rejection of uncorrelated events since we could demand that the signal from a molecule show that 3 slits were traversed with equal time intervals in order to be counted as a valid event.
An important aspect of this device is the dependence of both the near field radiation pattern and the far-field transmission of a thin slit on the polarization of the incident light, which has been discussed theoretically in the

386 |
Physics of Bio-Molecules and Cells |
literature but never before measured. There is a substantial literature on near field optics, starting with Bethe’s classic calculation of the transmission of light through a small hole [6]. Unfortunately, most work has concerned itself with optimizing the transmission of the far-field light through a structure, in our case we are concerned with minimizing the amount of far-field radiation, since our use of fluorescent probes means that any transmitted light will result in excitation and loss of resolution. Thus, although Betzig et al. [7] have done an exhaustive calculation of the electric fields for a slit with E polarized perpendicular to a slit in fact this is exactly the wrong polarization for our work since this polarization in fact maximizes far field radiation. In the case of a slit, it is convenient to use Babinet’s principle [8] and view the slit problem as the re-radiation by a metallic line of width w. Intuitively, we expect that when B is parallel to the slit (TE excitation) that the transmission will be largest and we would expect that when the B of the light is perpendicular to the slit (TM excitation) that the transmission is minimized. We would also expect that the near field pattern would be confined to the region between the slit for polarization parallel to the slit and would radiate as two lobes from the edges of the slit for polarization perpendicular to the slit, resulting in poor spatial resolution.
Calculation of the amount of the intensity of the near field radiation and the far field (radiating) intensity is important. Unfortunately, a finite thickness slit geometry is di cult to do analytically [9]. Those calculations that have been done [7] assumed that the thickness of the metal film T was much greater than the wavelength of the radiation λ and so only considered TE wave propagation. However, as we show below this results in a high background of far field transmission since a TE wave in a rectangular waveguide with infinitely long width has no cuto frequency [8]. Our situation is apparently new to the literature: the film thickness T (200 nm) is less than the wavelength of the radiation (488 nm) and hence the film is not thick, and we are concerned with TM waves. No closed form analytical expressions seem to exist for the far-field transmission [10] of a slit or the near field pattern. Measurements of the near-field radiation patterns for a 100 nm slit using a NSOM constructed by Fann et al. [11], are shown in Figures 1b–d. In agreement with the near field calculations of [7], the NSOM image confirms that for electric field polarization perpendicular to the slit the near-field pattern has two lobes radiating from the edges of the slit, while for polarization parallel to the slit the near-field pattern is confined to the opening between the slits, indicating that the techniques developed in [7] can in principle be used successfully to calculate the near-field patterns for our particular geometry.
However, although it is crude we can recognize two basic regimes at least for the far-field radiation whose background we must minimize. When

Lecture 3: Going After Epigenetics |
387 |
the slit width w is much greater than the film thickness T the far field TE radiation is from an electric dipole whose magnitude P is proportional to the slit width w. We would then expect that the far-field transmission in this range should vary as P 2 and hence as w2, a power law. However, as the slit width w becomes less than the film thickness T from analogy to the attenuation of radiation in a waveguide we would expect that the far field will now be further decreased by the transmission coe cient of a waveguide beyond cut-o , where imaginary solutions to the wave equation lead us to expect the far-field transmission will fall o exponentially with (λ/w).
1 |
× exp − |
Γλ |
|
|
|
I(w) Io |
|
|
(3.1) |
||
1 + (T /w)2 |
w |
||||
where T is the film thickness, w is the width of the slit, λ is the wavelength and Γ is the polarization dependent transmission coe cient of the slit. Thus, as a function of 1/w we expect first a slow power law decrease in transmission with exponent 2 followed by an exponential decay.
To test these assumptions we carried out far-field transmission measurements using the 488 nm line of a Kr:Ar laser, λ/2 plate polarization rotation and a cooled CCD camera (C4880, Hamamatsu Corp., Bridgewater, NJ) operated in integrating mode. The data shown in Figure 2a however indicate that there is in fact a cuto for both TE and TM waves as the slitwidth is decreased. The lines in Figure 2b show fits to equation (3.1), with a value for Γ of 0.8 for TE waves and 1.3 for TM waves, showing that although the TE wave does have higher transmission it ultimately falls exponentially as the slit width gets much less than T . At slit widths of 100 and 50 nm the primary excitation is near-field, in agreement with our near-field NSOM measurements which are shown in Figure 2b. In this data the intensity of TE polarized light was measured as a function of the distance z of the NSOM tip from a 100 nm slit. The exponential decay fit has a value of 100 nm ± 30 nm, the constant o set intensity we ascribe to farfield radiation for TE polarization. The TM polarization used for the remainder of this paper will have far-field intensity 1/30 of the 10% farfield observed for TE.
4 Experiments with molecules
Since the actual near field (and far field) TM radiation patterns for a finite thickness slit is ultimately not well understood, the spatial resolution of the device was determined by running fluorescent polystyrene balls of a known diameter across slits of decreasing widths from 1000 nm to 50 nm and measuring the time-resolved emission of the balls as they passed across the slit. Figure 3 shows the response of the photomultiplier for 100 nm balls passing 1000 nm, 300 nm and 50 nm wide slits under back illumination with

388 |
Physics of Bio-Molecules and Cells |
Fig. 2. a) Far-field transmission of the 100 nm wide slit taken using a 5 nm bandpass interference filter, λo = 650 nm. The left side log scale is the transmission for TE (E field perpendicular to the slit, circles) and TM (E field parallel, squares) to the slit. Intensity is normalized to the perpendicular transmission for a 1000 nm wide slit. The right side axis is the ratio of the TE/TM (triangles) for far field transmission. Solid lines are curve fits to the data using equation (3.1). b) Normalized NSOM intensity from a 100 nm wide slit as a function of distance z from the slit surface for p polarization. The solid curve fit is to an exponential decay plus constant o set.
488 nm wavelength laser excitation, with a N.A. = 0.9 objective as the light gathering optic. Our present slits have 100 nm of SiO2 over the slits to protect the aluminum, the result is that at present our resolution is limited to 200 nm spatial resolution. The fact that the pulse width of the light from a bead passing over a slit decreased with the width of the slit and exceeded

Lecture 3: Going After Epigenetics |
389 |
Fig. 3. a) Fluorescence vs. distance as determined by time of flight for a 100 nm diameter fluorescent ball passing a 1000 nm (red line) slit and 300 nm slit (green line). Typically, 50 mW of excitation light was used on the back side, focused to a 10 micron spot size using a 50 mm focal length lens (Gradium lens, Newport Optics). b) Fluorescence vs. distance as determined by time of flight for a 100 nm ball passing by a 50 nm wide slit. The FWHM of the signal is 200 nm.
the resolution of the objective used for this measurements (R = 350 nm) indicates that the beads were excited by the near-field pattern. Note that resolution observed here is independent of the N.A. of the light gathering microscope objective.
Linear polymers such as double stranded DNA (dsDNA) consist of long sequences of basepairs whose sequential ordering comprise the genomic content of the organism from which the DNA came from. We examine here the passage of T4 phage dsDNA molecules, T4 has a length of 169 kilobases, or a stretched length when loaded with our intercalating dye TOTO-1 (Molecular Probes, Eugene, OR) of 7.4 × 10⁴ nm [12]. In the absence of a shearing force field DNA undergoing electrophoretic transport T4 would be
expected to form a Gaussian coil of radius Rg = Lp6 , where p is the persis-
tence length of DNA, about 50 nm [5]. This yields an expected Rg = 700 nm for T4 DNA.
The forces acting on charged polymers in microfabricated environments have been discussed in reference [12]. In our case the channels are 5000 nm wide and 1000 nm deep, both dimensions are large compared to the persistence length of dsDNA (approximately 50 nm). The forces acting on the polymer create a tension T (z) in the polymer where z is the distance from the tethered end. The forces acting on a polymer which is momentarily hooked on an obstacle create a tension in the chain which declines from a maximum value at the hooked end to zero at the free end; as a result, the

390 |
Physics of Bio-Molecules and Cells |
Fig. 4. Fluorescence signal from T4 dsDNA molecules passing across a slit. T4 molecules were pre-incubated with the fluorescent intercalating dye TOTO (Molecular Probes, Eugene, OR) before entering the array using electrophoresis. 3 di erent molecules are shown under di erent states of elongation: a) a relatively extended molecule, b) molecule with entropically coiled leading head, c) compact molecule.
polymer appears as a highly stretched “stem”, surmounted by a “flower” of increasingly disordered random coils. The terminal blob of the DNA free end should have a diameter D ( kTηv )1/2 where η is the viscosity of the
medium and v is the velocity of the polymer in the medium [12]. Typically in these experiments the molecules had electrophoretic veloc-
ities of 100 µm/s, with a predicted disordered head size of 200 nm. Figure 4 shows selected time traces of T4 molecules passing by a 100 nm
slit. Data selection was needed here because with the present channel width the DNA molecules can come o the posts in a variety of entropic configurations, and the deep etch of the channel gives rise to a background of low intensity poorly resolved molecules. The molecules chosen gave an example of the range of signals of a molecule which has been extended by the applied force field and then released. The brief light pulse at the heads of the molecules is the disordered head of the extended molecule, the diameter of the head is 200 nm, within the resolution limits of our apparatus at present, and also approximately the expected size from the parameters of the stretching force parameters we are using. In addition to the disordered head of the molecule there is also visible small “lumps” of disordered sections which are generated when the tension in the molecule is suddenly released. The faster the DNA molecules are run through this structure the more extended the molecules are and the less time there is for the taut end