374 |
PART SEVEN THE MACROECONOMICS OF OPEN ECONOMIES |
The perceived economic and political risks of holding assets abroad
The government policies that affect foreign ownership of domestic assets
For example, consider U.S. investors deciding whether to buy Mexican government bonds or U.S. government bonds. (Recall that a bond is, in effect, an IOU of the issuer.) To make this decision, U.S. investors compare the real interest rates offered on the two bonds. The higher a bond’s real interest rate, the more attractive it is. While making this comparison, however, U.S. investors must also take into account the risk that one of these governments might default on its debt (that is, not pay interest or principal when it is due), as well as any restrictions that the
IN THE NEWS
It’s the 21st Century,
Do You Know Where
Your Capital Is?
holes in the ground in Borneo.
To begin with, foreign stock and bond markets are growing much faster than those in America, providing much higher returns to investors. In 1970, foreign markets accounted for only a third of the value of the world’s stock and bond markets, with the United States alone accounting for the other twothirds. But by last year, they had grown to nearly 60 percent of the total.
Stock markets in newly emerging economies like those of Turkey, Argentina, and South Africa now account for 14 percent of the world’s total stock market value, up from 4 percent 10 years ago.
Investors have flocked to them as global economic trends have shifted since the end of the cold war. Centralized, state-planned economies have been scuttled for ones favoring private ownership of industry. With the trans-
the resulting vibrant new no longer need to rely on development agencies or York banks for foreign investthey did in the 1970s and much of their seed capi1990 has come from a sur-
source: millions of average who invest in mutual funds.
a trend that has been led by America, which pushed the international lending agencies to encourage the development of private enterprise, to open up these markets and get the hands of government out of industrial ownership,” said J. Mark Mobius, who oversees several Templeton mutual funds that invest in emerging markets. “That led to the development of capital markets—bond markets and stock markets—in many of these countries, and now to people like me trying to invest all the money that is flowing into our mutual funds.” . . .
And these days, when the finance minister of a developing country wants to encourage foreigners to invest in his country, he is less likely to court the World Bank or the Agency for International Development than someone like Mr. Mobius.
SOURCE: The New York Times, May 25, 1997, Week in Review, p. 3.
CHAPTER 17 OPEN-ECONOMY MACROECONOMICS: BASIC CONCEPTS |
375 |
Mexican government has imposed, or might impose in the future, on foreign investors in Mexico.
THE EQUALITY OF NET EXPORTS
AND NET FOREIGN INVESTMENT
We have seen that an open economy interacts with the rest of the world in two ways—in world markets for goods and services and in world financial markets. Net exports and net foreign investment each measure a type of imbalance in these markets. Net exports measure an imbalance between a country’s exports and its imports. Net foreign investment measures an imbalance between the amount of foreign assets bought by domestic residents and the amount of domestic assets bought by foreigners.
An important but subtle fact of accounting states that, for an economy as a whole, these two imbalances must offset each other. That is, net foreign investment (NFI) always equals net exports (NX):
NFI NX.
This equation holds because every transaction that affects one side of this equation must also affect the other side by exactly the same amount. This equation is an identity—an equation that must hold because of the way the variables in the equation are defined and measured.
To see why this accounting identity is true, consider an example. Suppose that Boeing, the U.S. aircraft maker, sells some planes to a Japanese airline. In this sale, a U.S. company gives planes to a Japanese company, and a Japanese company gives yen to a U.S. company. Notice that two things have occurred simultaneously. The United States has sold to a foreigner some of its output (the planes), and this sale increases U.S. net exports. In addition, the United States has acquired some foreign assets (the yen), and this acquisition increases U.S. net foreign investment.
Although Boeing most likely will not hold on to the yen it has acquired in this sale, any subsequent transaction will preserve the equality of net exports and net foreign investment. For example, Boeing may exchange its yen for dollars with a U.S. mutual fund that wants the yen to buy stock in Sony Corporation, the Japanese maker of consumer electronics. In this case, Boeing’s net export of planes equals the mutual fund’s net foreign investment in Sony stock. Hence, NX and NFI rise by an equal amount.
Alternatively, Boeing may exchange its yen for dollars with another U.S. company that wants to buy computers from Toshiba, the Japanese computer maker. In this case, U.S. imports (of computers) exactly offset U.S. exports (of planes). The sales by Boeing and Toshiba together affect neither U.S. net exports nor U.S. net foreign investment. That is, NX and NFI are the same as they were before these transactions took place.
The equality of net exports and net foreign investment follows from the fact that every international transaction is an exchange. When a seller country transfers a good or service to a buyer country, the buyer country gives up some asset to pay for this good or service. The value of that asset equals the value of the good or service sold. When we add everything up, the net value of goods and services sold by a country (NX) must equal the net value of assets acquired (NFI). The international
376 |
PART SEVEN THE MACROECONOMICS OF OPEN ECONOMIES |
|
|
|
|
IN THE NEWS
Flows between the Developing South
and the Industrial North
nomic Forum—which every year draws an unmatched assemblage of the world’s political and business elite to its conference in Davos, Switzerland—released its annual report on international competitiveness. The report made headlines because it demoted Japan and declared America the world’s most competitive economy.
The revealing part of the report, however, is not its more or less meaningless competitiveness rankings but its introduction, which offers what seems to be a very clear vision of the global economic future.
dustrializing nations is deindustrializing high-wage nations: Capital is flowing to the Third World and low-cost producers in these countries are flooding world markets with cheap manufactured goods.
The report predicts that these trends will accelerate, that service jobs will soon begin to follow the lost jobs in manufacturing and that the future of the high-wage nations offers a bleak choice between declining wages and rising unemployment.
This vision resonates with many people. Yet as a description of what has
flow of goods and services and the international flow of capital are two sides of the same coin.
SAVING, INVESTMENT, AND THEIR RELATIONSHIP TO THE INTERNATIONAL FLOWS
A nation’s saving and investment are, as we have seen in Chapters 12 and 13, crucial to its long-run economic growth. Let’s therefore consider how these variables are related to the international flows of goods and capital, as measured by net exports and net foreign investment. We can do this most easily with the help of some simple mathematics.
As you may recall, the term net exports first appeared earlier in the book when we discussed the components of gross domestic product. The economy’s gross domestic product (Y) is divided among four components: consumption (C), investment (I), government purchases (G), and net exports (NX). We write this as
Y C I G NX.
CHAPTER 17 OPEN-ECONOMY MACROECONOMICS: BASIC CONCEPTS |
377 |
|
|
|
|
actually happened in recent years, it is almost completely untrue.
Rapidly growing Third World economies have indeed increased their exports of manufactured goods. But today these exports absorb only about 1 percent of First World income. Moreover, Third World nations have also increased their imports.
Overall, the effect of Third World growth on the number of industrial jobs in Western nations has been minimal: Growing exports to the newly industrializing countries have created about as many jobs as growing imports have displaced.
What about capital flows? The numbers sound impressive. Last year, $24 billion flowed to Mexico, $11 billion to China. The total movement of capital from advanced to developing nations was about $60 billion. But though this sounds like a lot, it is pocket change in a world economy that invests more than $4 trillion a year.
In other words, if the vision of a Western economy battered by low-wage competition is meant to describe today’s world, it is a fantasy with hardly any basis in reality.
Even if the vision does not describe the present, might it describe the future? Well, growing exports of manufactured goods from South to North will lead to a net loss of northern industrial jobs only if they are not matched by growth in exports from North to South.
The authors of the report evidently envision a future of large-scale Third World trade surpluses. But it is an unavoidable fact of accounting that a country that runs a trade surplus must also be a net investor in other countries. So large-scale deindustrialization can take place only if low-wage nations are major exporters of capital to high-wage nations. This seems unlikely. In any case, it contradicts the rest of the story, which predicts huge capital flows into low-wage nations.
Thus, the vision offered by the world competitiveness report conflicts not only with the facts but with itself. Yet it is a vision that a growing number of the world’s most influential men and women seem to share. That is a dangerous trend.
Not everyone who worries about low-wage competition is a protectionist. Indeed, the authors of the world competitiveness report would surely claim to be champions of free trade. Nonetheless, the fact that such ideas have become respectable . . . suggests that the intellectual consensus that has kept world trade relatively free, and that has allowed hundreds of millions of people in the Third World to get their first taste of prosperity, may be unraveling.
SOURCE: The New York Times, September 26, 1994, p. A17.
Total expenditure on the economy’s output of goods and services is the sum of expenditure on consumption, investment, government purchases, and net exports. Because each dollar of expenditure is placed into one of these four components, this equation is an accounting identity: It must be true because of the way the variables are defined and measured.
Recall that national saving is the income of the nation that is left after paying for current consumption and government purchases. National saving (S) equals Y C G. If we rearrange the above equation to reflect this fact, we obtain
Y C G I NX
S I NX.
Because net exports (NX) also equal net foreign investment (NFI), we can write this equation as
S |
I |
|
NFI |
|
Domestic |
|
Net foreign |
Saving investment |
investment. |
378 |
PART SEVEN THE MACROECONOMICS OF OPEN ECONOMIES |
This equation shows that a nation’s saving must equal its domestic investment plus its net foreign investment. In other words, when U.S. citizens save a dollar of their income for the future, that dollar can be used to finance accumulation of domestic capital or it can be used to finance the purchase of capital abroad.
This equation should look somewhat familiar. Earlier in the book, when we analyzed the role of the financial system, we considered this identity for the special case of a closed economy. In a closed economy, net foreign investment is zero (NFI 0), so saving equals investment (S I). By contrast, an open economy has two uses for its saving: domestic investment and net foreign investment.
As before, we can view the financial system as standing between the two sides of this identity. For example, suppose the Smith family decides to save some of its income for retirement. This decision contributes to national saving, the left-hand side of our equation. If the Smiths deposit their saving in a mutual fund, the mutual fund may use some of the deposit to buy stock issued by General Motors, which uses the proceeds to build a factory in Ohio. In addition, the mutual fund may use some of the Smiths’ deposit to buy stock issued by Toyota, which uses the proceeds to build a factory in Osaka. These transactions show up on the righthand side of the equation. From the standpoint of U.S. accounting, the General Motors expenditure on a new factory is domestic investment, and the purchase of Toyota stock by a U.S. resident is net foreign investment. Thus, all saving in the U.S. economy shows up as investment in the U.S. economy or as U.S. net foreign investment.
CASE STUDY ARE U.S. TRADE DEFICITS
A NATIONAL PROBLEM?
You may have heard the press call the United States “the world’s largest debtor.” The nation earned that description by borrowing heavily in world financial markets during the 1980s and 1990s to finance large trade deficits. Why did the United States do this, and should this event give Americans reason to worry?
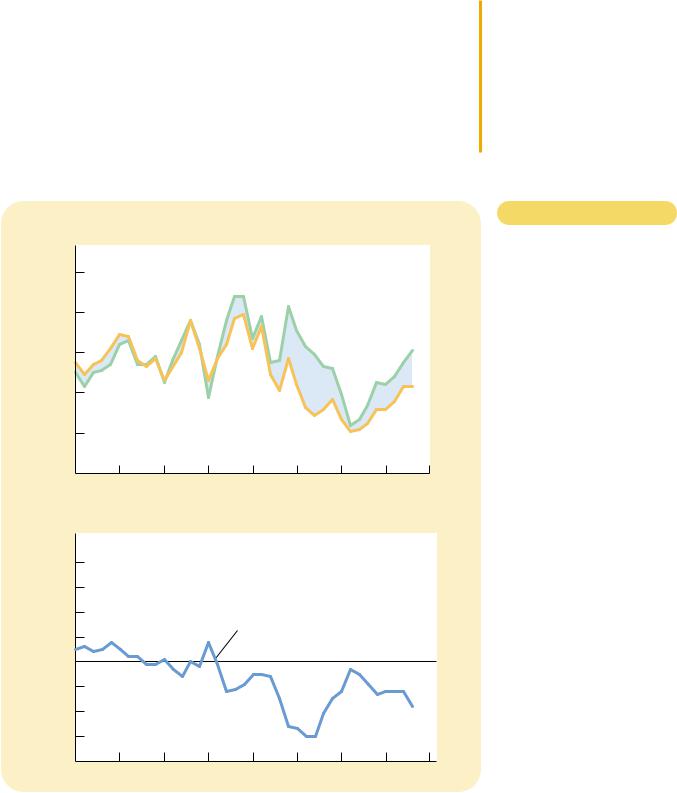
To answer these questions, let’s see what these macroeconomic accounting identities tell us about the U.S. economy. Panel (a) of Figure 17-2 shows national saving and domestic investment as a percentage of GDP since 1960. Panel (b) shows net foreign investment as a percentage of GDP. Notice that, as the identities require, net foreign investment always equals national saving minus domestic investment.
The figure shows a dramatic change beginning in the early 1980s. Before 1980, national saving and domestic investment were very close, and so net foreign investment was small. Yet after 1980, national saving fell dramatically, in part because of increased government budget deficits and in part because of a fall in private saving. Because this fall in saving did not coincide with a similar fall in domestic investment, net foreign investment became a large negative number, indicating that foreigners were buying more assets in the United States than Americans were buying abroad. Put simply, the United States was going into debt.
As we have seen, accounting identities require that net exports must equal net foreign investment. Thus, when net foreign investment became negative, net exports became negative as well. The United States ran a trade deficit:
380 |
PART SEVEN THE MACROECONOMICS OF OPEN ECONOMIES |
productivity, and real wages. In other words, given the fact that U.S. citizens are not saving much, it is better to have foreigners invest in the U.S. economy than no one at all.
QUICK QUIZ: Define net exports and net foreign investment. Explain how they are related.
THE PRICES FOR INTERNATIONAL TRANSACTIONS:
REAL AND NOMINAL EXCHANGE RATES
nominal exchange rate the rate at which a person can trade the currency of one country for the currency of another
appr eciation
an increase in the value of a currency as measured by the amount of foreign currency it can buy
depr eciation
a decrease in the value of a currency as measured by the amount of foreign currency it can buy
So far we have discussed measures of the flow of goods and services and the flow of capital across a nation’s border. In addition to these quantity variables, macroeconomists also study variables that measure the prices at which these international transactions take place. Just as the price in any market serves the important role of coordinating buyers and sellers in that market, international prices help coordinate the decisions of consumers and producers as they interact in world markets. Here we discuss the two most important international prices—the nominal and real exchange rates.
NOMINAL EXCHANGE RATES
The nominal exchange rate is the rate at which a person can trade the currency of one country for the currency of another. For example, if you go to a bank, you might see a posted exchange rate of 80 yen per dollar. If you give the bank one U.S. dollar, it will give you 80 Japanese yen; and if you give the bank 80 Japanese yen, it will give you one U.S. dollar. (In actuality, the bank will post slightly different prices for buying and selling yen. The difference gives the bank some profit for offering this service. For our purposes here, we can ignore these differences.)
An exchange rate can always be expressed in two ways. If the exchange rate is 80 yen per dollar, it is also 1/80 ( 0.0125) dollar per yen. Throughout this book, we always express the nominal exchange rate as units of foreign currency per U.S. dollar, such as 80 yen per dollar.
If the exchange rate changes so that a dollar buys more foreign currency, that change is called an appreciation of the dollar. If the exchange rate changes so that a dollar buys less foreign currency, that change is called a depreciation of the dollar. For example, when the exchange rate rises from 80 to 90 yen per dollar, the dollar is said to appreciate. At the same time, because a Japanese yen now buys less of the U.S. currency, the yen is said to depreciate. When the exchange rate falls from 80 to 70 yen per dollar, the dollar is said to depreciate, and the yen is said to appreciate.
At times you may have heard the media report that the dollar is either “strong” or “weak.” These descriptions usually refer to recent changes in the nominal exchange rate. When a currency appreciates, it is said to strengthen because it can then buy more foreign currency. Similarly, when a currency depreciates, it is said to weaken.
16,000 yen per bushel of Japanese rice
CHAPTER 17 OPEN-ECONOMY MACROECONOMICS: BASIC CONCEPTS |
381 |
For any country, there are many nominal exchange rates. The U.S. dollar can be used to buy Japanese yen, British pounds, French francs, Mexican pesos, and so on. When economists study changes in the exchange rate, they often use indexes that average these many exchange rates. Just as the consumer price index turns the many prices in the economy into a single measure of the price level, an exchange rate index turns these many exchange rates into a single measure of the international value of the currency. So when economists talk about the dollar appreciating or depreciating, they often are referring to an exchange rate index that takes into account many individual exchange rates.
REAL EXCHANGE RATES
The real exchange rate is the rate at which a person can trade the goods and services of one country for the goods and services of another. For example, suppose that you go shopping and find that a case of German beer is twice as expensive as a case of American beer. We would then say that the real exchange rate is 1/2 case of German beer per case of American beer. Notice that, like the nominal exchange rate, we express the real exchange rate as units of the foreign item per unit of the domestic item. But in this instance the item is a good rather than a currency.
Real and nominal exchange rates are closely related. To see how, consider an example. Suppose that a bushel of American rice sells for $100, and a bushel of Japanese rice sells for 16,000 yen. What is the real exchange rate between American and Japanese rice? To answer this question, we must first use the nominal exchange rate to convert the prices into a common currency. If the nominal exchange rate is 80 yen per dollar, then a price for American rice of $100 per bushel is equivalent to 8,000 yen per bushel. American rice is half as expensive as Japanese rice. The real exchange rate is 1/2 bushel of Japanese rice per bushel of American rice.
We can summarize this calculation for the real exchange rate with the following formula:
Real exchange rate Nominal exchange rate Domestic price . Foreign price
Using the numbers in our example, the formula applies as follows:
Real exchange rate (80 yen per dollar) ($100 per bushel of American rice)
8,000 yen per bushel of American rice16,000 yen per bushel of Japanese rice
1/2 bushel of Japanese rice per bushel of American rice.
Thus, the real exchange rate depends on the nominal exchange rate and on the prices of goods in the two countries measured in the local currencies.
Why does the real exchange rate matter? As you might guess, the real exchange rate is a key determinant of how much a country exports and imports. When Uncle Ben’s, Inc., is deciding whether to buy U.S. rice or Japanese rice to put into its boxes, for example, it will ask which rice is cheaper. The real exchange rate
r eal exchange rate
the rate at which a person can trade the goods and services of one country for the goods and services of another

382 |
PART SEVEN THE MACROECONOMICS OF OPEN ECONOMIES |
gives the answer. As another example, imagine that you are deciding whether to take a seaside vacation in Miami, Florida, or in Cancun, Mexico. You might ask your travel agent the price of a hotel room in Miami (measured in dollars), the price of a hotel room in Cancun (measured in pesos), and the exchange rate between pesos and dollars. If you decide where to vacation by comparing costs, you are basing your decision on the real exchange rate.
When studying an economy as a whole, macroeconomists focus on overall prices rather than the prices of individual items. That is, to measure the real exchange rate, they use price indexes, such as the consumer price index, which measure the price of a basket of goods and services. By using a price index for a U.S. basket (P), a price index for a foreign basket (P*), and the nominal exchange rate between the U.S. dollar and foreign currencies (e), we can compute the overall real exchange rate between the United States and other countries as follows:
Real exchange rate (e P)/P*.
This real exchange rate measures the price of a basket of goods and services available domestically relative to a basket of goods and services available abroad.
As we examine more fully in the next chapter, a country’s real exchange rate is a key determinant of its net exports of goods and services. A depreciation (fall) in the U.S. real exchange rate means that U.S. goods have become cheaper relative to foreign goods. This change encourages consumers both at home and abroad to buy more U.S. goods and fewer goods from other countries. As a result, U.S. exports rise, and U.S. imports fall, and both of these changes raise U.S. net exports. Conversely, an appreciation (rise) in the U.S. real exchange rate means that U.S. goods have become more expensive compared to foreign goods, so U.S. net exports fall.
QUICK QUIZ: Define nominal exchange rate and real exchange rate, and explain how they are related. If the nominal exchange rate goes from 100 to 120 yen per dollar, has the dollar appreciated or depreciated?
purchasing-power parity
a theory of exchange rates whereby a unit of any given currency should be able to buy the same quantity
of goods in all countries
A FIRST THEORY OF EXCHANGE-RATE DETERMINATION: PURCHASING-POWER PARITY
Exchange rates vary substantially over time. In 1970, a U.S. dollar could be used to buy 3.65 German marks or 627 Italian lira. In 1998, a U.S. dollar bought 1.76 German marks or 1,737 Italian lira. In other words, over this period the value of the dollar fell by more than half compared to the mark, while it more than doubled compared to the lira.
What explains these large and opposite changes? Economists have developed many models to explain how exchange rates are determined, each emphasizing just some of the many forces at work. Here we develop the simplest theory of exchange rates, called purchasing-power parity. This theory states that a unit of any given currency should be able to buy the same quantity of goods in all countries. Many economists believe that purchasing-power parity describes the forces that determine exchange rates in the long run. We now consider the logic on which this
F Y I
The Euro
CHAPTER 17 OPEN-ECONOMY MACROECONOMICS: BASIC CONCEPTS |
383 |
Some of the currencies mentioned in this chapter, such as the French franc, the German mark, and the Italian lira, are in the process of disappearing. Many European nations have decided to give up their national currencies and start using a new common currency called the euro. A newly formed European Central Bank, with representatives from all of the participating countries, issues
the euro and controls the quantity in circulation, much as the Federal Reserve controls the quantity of dollars in the U.S. economy.
Why are these countries adopting a common currency? One benefit of a common currency is that it makes trade easier. Imagine that each of the 50 U.S. states had a different currency. Every time you crossed a state border you would need to change your money and perform the kind of exchange-rate calculations discussed in the text. This would be inconvenient, and it might deter you from buying goods and services outside your own state. The countries of
Europe decided that as their economies became more integrated, it would be better to avoid this inconvenience.
There are, however, costs of choosing a common currency. If the nations of Europe have only one money, they can
have only one monetary policy. If they disagree about what monetary policy is best, they will have to reach some kind of agreement, rather than each going its own way. Because adopting a single money has both benefits and costs, there is debate among economists about whether Europe’s recent adoption of the euro was a good decision. Only time will tell what effect the decision will have.
long-run theory of exchange rates is based, as well as the theory’s implications and limitations.
THE BASIC LOGIC OF PURCHASING-POWER PARITY
The theory of purchasing-power parity is based on a principle called the law of one price. This law asserts that a good must sell for the same price in all locations. Otherwise, there would be opportunities for profit left unexploited. For example, suppose that coffee beans sold for less in Seattle than in Boston. A person could buy coffee in Seattle for, say, $4 a pound and then sell it in Boston for $5 a pound, making a profit of $1 per pound from the difference in price. The process of taking advantage of differences in prices in different markets is called arbitrage. In our example, as people took advantage of this arbitrage opportunity, they would increase the demand for coffee in Seattle and increase the supply in Boston. The price of coffee would rise in Seattle (in response to greater demand) and fall in Boston (in response to greater supply). This process would continue until, eventually, the prices were the same in the two markets.
Now consider how the law of one price applies to the international marketplace. If a dollar (or any other currency) could buy more coffee in the United States than in Japan, international traders could profit by buying coffee in the United States and selling it in Japan. This export of coffee from the United States to Japan