

continuous sensors - 14.25
14.2.5.7 - Positive Displacement Meters
In some cases more precise readings of flow rates and volumes may be required. These can be obtained by using a positive displacement meter. In effect these meters are like pumps run in reverse. As the fluid is pushed through the meter it produces a measurable output, normally on a rotating shaft.
14.2.5.8 - Pitot Tubes
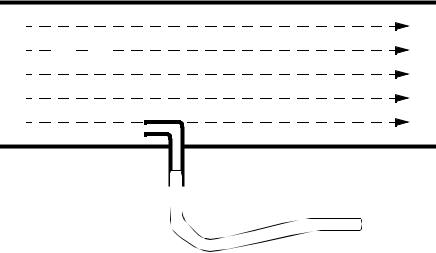
Gas flow rates can be measured using Pitot tubes, as shown in Figure 14.25. These are small tubes that project into a flow. The diameter of the tube is small (typically less than 1/8") so that it doesn’t affect the flow.
gas flow
pitot tube
connecting hose |
pressure |
|
sensor |
||
|
||
|
|
Figure 14.25 Pitot Tubes for Measuring Gas Flow Rates
14.2.6 Temperature
Temperature measurements are very common with control systems. The temperature ranges are normally described with the following classifications.
very low temperatures <-60 deg C - e.g. superconductors in MRI units low temperature measurement -60 to 0 deg C - e.g. freezer controls
fine temperature measurements 0 to 100 deg C - e.g. environmental controls high temperature measurements <3000 deg F - e.g. metal refining/processing
continuous sensors - 14.26
very high temperatures > 2000 deg C - e.g. plasma systems
14.2.6.1 - Resistive Temperature Detectors (RTDs)
When a metal wire is heated the resistance increases. So, a temperature can be measured using the resistance of a wire. Resistive Temperature Detectors (RTDs) normally use a wire or film of platinum, nickel, copper or nickel-iron alloys. The metals are wound or wrapped over an insulator, and covered for protection. The resistances of these alloys are shown in Figure 14.26.
Material |
Temperature |
Typical |
|
Range C (F) |
Resistance |
|
|
(ohms) |
|
|
|
Platinum |
-200 - 850 (-328 - 1562) |
100 |
Nickel |
-80 - 300 (-112 - 572) |
120 |
Copper |
-200 - 260 (-328 - 500) |
10 |
Figure 14.26 RTD Properties
These devices have positive temperature coefficients that cause resistance to increase linearly with temperature. A platinum RTD might have a resistance of 100 ohms at 0C, that will increase by 0.4 ohms/°C. The total resistance of an RTD might double over the temperature range.
A current must be passed through the RTD to measure the resistance. (Note: a voltage divider can be used to convert the resistance to a voltage.) The current through the RTD should be kept to a minimum to prevent self heating. These devices are more linear than thermocouples, and can have accuracies of 0.05%. But, they can be expensive
14.2.6.2 - Thermocouples
Each metal has a natural potential level, and when two different metals touch there is a small potential difference, a voltage. (Note: when designing assemblies, dissimilar metals should not touch, this will lead to corrosion.) Thermocouples use a junction of dissimilar metals to generate a voltage proportional to temperature. This principle was discovered by T.J. Seebeck.
The basic calculations for thermocouples are shown in Figure 14.27. This calculation provides the measured voltage using a reference temperature and a constant specific
continuous sensors - 14.27
to the device. The equation can also be rearranged to provide a temperature given a voltage.
measuring |
|
+ |
|
Vout |
|
|
|
device |
|
- |
|
|
|
||
|
|
|
|
|
|
|
|
Vout = α |
( T – Tref) |
|
|
||||
Vout |
+ Tref |
|
|
||||
T = --------- |
|
|
|||||
|
α |
|
|
|
|
|
|
where, |
|
|
|
|
|
µ V |
|
α |
= |
constant (V/C) |
50 |
||||
------ (typical) |
|||||||
|
|
|
|
|
|
°C |
|
T, Tref |
= current and reference temperatures |
||||||
Figure 14.27 Thermocouple Calculations
The list in Table 1 shows different junction types, and the normal temperature ranges. Both thermocouples, and signal conditioners are commonly available, and relatively inexpensive. For example, most PLC vendors sell thermocouple input cards that will allow multiple inputs into the PLC.
Table 1: Thermocouple Types
ANSI |
|
Temperature |
Voltage Range |
|
Materials |
Range |
|||
Type |
(mV) |
|||
|
(°F) |
|||
|
|
|
||
|
|
|
|
|
|
|
|
|
|
T |
copper/constantan |
-200 to 400 |
-5.60 to 17.82 |
|
|
|
|
|
|
J |
iron/constantan |
0 to 870 |
0 to 42.28 |
|
|
|
|
|
|
E |
chromel/constantan |
-200 to 900 |
-8.82 to 68.78 |
|
|
|
|
|
|
K |
chromel/aluminum |
-200 to 1250 |
-5.97 to 50.63 |
|
|
|
|
|
|
R |
platinum-13%rhodium/platinum |
0 to 1450 |
0 to 16.74 |
|
|
|
|
|
|
S |
platinum-10%rhodium/platinum |
0 to 1450 |
0 to 14.97 |
|
|
|
|
|
|
C |
tungsten-5%rhenium/tungsten-26%rhenium |
0 to 2760 |
0 to 37.07 |
|
|
|
|
|

continuous sensors - 14.28
mV
80 |
|
E |
|
|
|
|
|
|
|
|
|
60 |
|
|
K |
|
|
|
|
|
|
|
|
|
|
J |
|
|
C |
40 |
|
|
|
|
|
|
|
|
|
|
|
20 |
T |
|
|
R |
|
|
|
|
|
S |
|
0 |
|
|
|
|
|
0 |
500 |
1000 |
1500 |
2000 |
2500 |
|
|
|
|
|
( ° F) |
Figure 14.28 Thermocouple Temperature Voltage Relationships (Approximate)
The junction where the thermocouple is connected to the measurement instrument is normally cooled to reduce the thermocouple effects at those junctions. When using a thermocouple for precision measurement, a second thermocouple can be kept at a known temperature for reference. A series of thermocouples connected together in series produces a higher voltage and is called a thermopile. Readings can approach an accuracy of 0.5%.
14.2.6.3 - Thermistors
Thermistors are non-linear devices, their resistance will decrease with an increase in temperature. (Note: this is because the extra heat reduces electron mobility in the semiconductor.) The resistance can change by more than 1000 times. The basic calculation is shown in Figure 14.29.
often metal oxide semiconductors The calculation uses a reference temperature and resistance, with a constant for the device, to predict the resistance at another temperature. The expression can be rearranged to calculate the temperature given the resistance.

 +V
+V