


48 Normal Cells of the Blood and Hematopoietic Organs
Lymphocytes (and Plasma Cells)
Lymphocytes are produced everywhere, particularly in the lymph nodes, spleen, bone marrow, and the lymphatic islands of the intestinal mucosa, under the influence of the thymus (T-lymphocytes, about 80%), or the bone marrow (B-lymphocytes, about 20%). A small fraction of the lymphocytes are NK cells (natural killer cells). Immature precursor cells (lymph node cytology, p. 177) are practically never released into the blood and are therefore of no practical diagnostic significance. The cells encountered in circulating blood are mostly “small” lymphocytes with oval or round nuclei 6–9 µm in diameter. Their chromatin may be described as dense and coarse. Detailed analysis under the microscope, using the micrometer screw to view the chromatin in different planes, reveals not the patch-like or banded structure of myeloblast chromatin, or the “busy” structure of monocyte chromatin, but slate-like formations with homogeneous chromatin and intermittent narrow, lighter layers that resemble geological break lines. Nucleoli are rarely seen. The cytoplasm wraps quite closely around the nucleus and is slightly basophilic. Only a few lymphocytes display the violet stained stippling of granules; about 5% of small lymphocytes and about 3% of large ones. The family of large lymphocytes with granulation consists mostly of NK cells. An important point is that small lymphocytes—which cannot be identified as T- or B-lymphocytes on the basis of morphology—are not functional end forms, but undergo transformation in response to specific immunological stimuli. The final stage of B- lymphocyte maturation (in bone marrow and lymph nodes) is plasma cells, whose nuclei often show radial bars, and whose basophilic cytoplasm layer is always wide. Intermediate forms (“plasmacytoid” lymphocytes) also exist.
Diagnostic Implications. Values between 1500 and 4000/µl and about 35% reflect normal output of the lymphatic system. Elevated absolute lymphocyte counts, often along with cell transformation, are observed predominantly in viral infections (pp. 67, 69) or in diseases of the lymphatic system (p. 75ff.). Relative increases at the expense of other blood cell series may be a manifestation of toxic or aplastic processes (agranulocytosis, p. 87; aplastic anemia, p. 148), because these irregularities are rare in the lymphatic series. A spontaneous decrease in lymphocyte counts is normally seen only in very rare congenital diseases (agammaglobulinemia [Bruton disease], DiGeorge disease [chromosome 22q11 deletion syndrome]). Some systemic diseases also lead to low lymphocyte counts (Hodgkin disease, active AIDS).
Mature plasma cells are rarely found in blood (plasma cell leukemia is extremely rare). Plasma-cell-like (“plasmacytoid”) lymphocytes occur in viral infections or systemic diseases (see p. 68f. and p. 74f.).
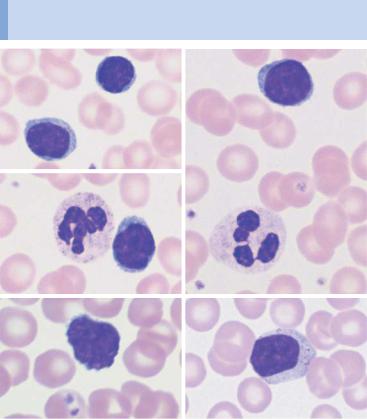
Lymphocytes are small round cells with dense nuclei and some variation in their appearance
a
b |
c |
d |
e |
f 
 g
g
Fig. 16 Lymphocytes a–c Range of appearance of normal lymphocytes (some of them adjacent to segmented neutrophilic granulocytes). d In neonates, some lymphocytes from a neonate show irregularly shaped nuclei with notches or hints of segmentation. e A few larger lymphocytes with granules may occur in a normal person. f Occasionally, and without any recognizable trigger, the cytoplasm may widen. g A smear taken after infection may contain a few plasma cells, the final, morphologically fully developed cells in the B-lymphocyte series (for further activated lymphocyte forms, see p. 67).
49

50 Normal Cells of the Blood and Hematopoietic Organs
Megakaryocytes and Thrombocytes
Megakaryocytes can enter the bloodstream only in highly pathological myeloproliferative disease or acute leukemia. They are shown here in order to demonstrate thrombocyte differentiation. Megakaryocytes reside in the bone marrow and have giant, extremely hyperploid nuclei (16 times the normal number of chromosome sets on average), which build up by endomitosis. Humoral factors regulate the increase of megakaryocytes and the release of thrombocytes when more are needed (e.g., bleeding or increased thrombocyte degradation). Cytoplasm with granules is pinched off from megakaryocytes to form thrombocytes. The residual naked megakaryocyte nuclei are phagocytosed.
Only mature thrombocytes occur in blood. About 1–4 µm in size and anuclear, their light blue stained cytoplasm and its processes give them a star-like appearance, with fine reddish blue granules near the center. Young thrombocytes are larger and more “spread out;” older ones look like pyknotic dots.
Diagnostic Implications. In a blood smear, there are normally 8–15 thrombocytes per view field using a 100! objective; they may appear dispersed or in groups. To someone quickly screening a smear, they will give a good indication of any increase or strong decrease in the count, which can be useful for early diagnosis of acute thrombocytopenias (p. 164f.).
Small megakaryocyte nuclei are found in the bloodstream only in severe myeloproliferative disorders (p. 171).
Megakaryocytes are never present in a normal peripheral blood smear. Thrombocytes are seen in every field view
a |
b |
c 
 d
d
Fig. 17 Megakaryocytes and thrombocytes. a Megakaryocytes in a bone marrow smear. The wide cytoplasm displays fine, cloudy granulation as a sign of incipient thrombocyte budding. b Normal density of thrombocytes among the erythrocytes, with little variation in thrombocyte size. c and d Peripheral blood smears with aggregations of thrombocytes. When such aggregates are seen against a background of apparent thrombocytopenia, the phenomenon is called “pseudothrombocytopenia” and is usually an effect of the anticoagulant EDTA (see also p. 167).
51

52 Normal Cells of the Blood and Hematopoietic Organs
Bone Marrow: Cell Composition
and Principles of Analysis
As indicated above, and as will be shown below, almost all disorders of the hematopoietic system can be diagnosed using clinical findings, blood analysis, and humoral data. There is no mystery about bone marrow diagnostics. The basic categories are summarized here to give an understanding of how specific diagnostic information is achieved; photomicrographs will show the appearance of specific diseases. Once the individual cell types, as given in the preceding pages, are recognized, it becomes possible to interpret the bone marrow smears that accompany the various diseases, and to follow further, analogous diagnostic steps. As a first step in the analysis of a bone marrow tissue smear or squash preparation, various areas in several preparations are broadly surveyed. This is followed by individual analysis of at least 200 cells from two representative areas. Table 4 shows the mean normal values and their wide ranges.
A combination of estimation and quantitative analysis is used, based on the following criteria:
Cell Density. This parameter is very susceptible to artifacts. Figure 18 shows roughly the normal cell density. A lower count may be due to the manner in which the sample was obtained or to the smearing procedure. A bone marrow smear typically shows areas where connective tissue adipocytes with large vacuoles predominate. Only if these adipocytes areas are present is it safe to assume that the smear contains bone marrow material and that an apparent deficit of bone marrow cells is real.
Increased cell density: e.g., in all strong regeneration or compensation processes, and in cases of leukemia and myeloproliferative syndromes (except osteomyelosclerosis).
Decreased cell density: e.g., in aplastic processes and myelofibrosis.

Bone Marrow: Cell Composition and Principles of Analysis |
53 |
|
|
Table 4 Cell composition in the bone marrow: normal values (%)
|
Median |
Median values and normal |
|
|
values |
range |
|
|
(J. Boll) |
(K. Rohr) |
|
Red cell series |
|
|
|
– Proerythrocytes |
1 |
|
|
– Macroblasts (basophilic |
3 |
3.5 |
0.5–7.5 |
erythroblasts) |
|
|
|
– Normoblasts (polyand |
16 |
19 |
(7–40) |
orthochromic erythro- |
|
|
|
blasts) |
|
|
|
|
|
|
|
Neutrophil series |
|
|
|
– Myeloblasts |
2.7 |
1 |
(0.5–5) |
– Promyelocytes |
9.5 |
3 |
(0–7.5) |
– Myelocytes |
14 |
15 |
(5–25) |
– Metamyelocytes |
10.5 |
15 |
(5–20) |
– Band neutrophils |
9.8 |
15 |
(5–25) |
– Segmented neutrophils |
17.5 |
7 |
(0.5–15) |
|
|
|
|
Small cell series |
|
|
|
– Eosinophilic granulocytes |
5 |
3 |
(1–7) |
– Basophilic granulocytes |
1 |
0.5 |
(0–1) |
– Monocytes |
2 |
2 |
(0.5–3) |
– Lymphocytes |
6 |
7.5 |
(2.5–15) |
– Plasma cells |
1.5 |
1 |
(0.5–3) |
Megakaryocytes
Cell densities vary widely, 0.5–2 per view field during screening at low magnification.
Ratios of Red Cell Series to White Cell Series. In the final analysis, bone marrow cytology allows a quantitative assessment only in relative terms.
The important ratio of red precursor cells to white cells is 1 : 2 for men and 1 : 3 for women.
Shifts towards erythropoiesis are seen in all regenerative anemias (hemorrhagic anemia, iron deficiency anemia, vitamin deficiency anemia, and hemolysis), pseudopolycythemia (Gaisböck syndrome), and polycythemia, also in rare pseudo-regenerative disorders, such as sideroachrestic anemia and myelodysplasias. Shifts toward granulopoiesis are seen in all reactive processes (infections, tumor defense) and in all malignant processes of the white cell series (chronic myeloid leukemia, acute leukoses).

54 Normal Cells of the Blood and Hematopoietic Organs
Distribution and Cell Quality in Erythropoiesis. In erythropoiesis polychromatic erythroblasts normally predominate. Proerythroblasts and basophilic erythroblasts only make up a small portion (Table 4). Here, too, a left shift indicates an increase in immature cell types and a right shift an increase in orthochromatic erythroblasts. Qualitatively, vitamin B12 and folic acid deficiency lead to a typical loosening-up of the nuclear structure in proerythroblasts and to nuclear segmentation and break-up in the erythroblasts (megaloblastic erythropoiesis).
A left shift is seen in regenerative anemias except hemolysis. Atypical proerythroblasts predominate in megaloblastic anemia and erythremia.
A right shift is seen in hemolytic conditions (nests of normoblasts, erythrons).
Distribution and Cell Quality in Granulopoiesis. The same principle is valid as for erythropoiesis: the more mature the cells, the greater proportion of the series they make up. A left shift indicates a greater than normal proportion of immature cells and a right shift a greater than normal proportion of mature cells (Table 4). Strong reactive conditions may lead to dissociations in the maturation process, e.g., the nucleus shows the structure of a myelocyte while the cytoplasm is still strongly basophilic. In malignancies, the picture is dominated by blasts, which may often be difficult to identify with any certainty.
A left shift is observed in all reactive processes and at the start of neoplastic transformation (smoldering anemia, refractory anemia with excess blasts [RAEB]). In acute leukemias, undifferentiated and partially matured blasts may predominate. In agranulocytosis, promyelocytes are most abundant.
A right shift is diagnostically irrelevant.
Cytochemistry. To distinguish between reactive processes and chronic myeloid leukemia, leukocyte alkaline phosphatase is determined in fresh smears of blood. To distinguish between different types of acute leukemia, the peroxidase and esterase reactions are carried out (pp. 97and 99), and iron staining is performed (p. 109) if myelodysplasia is suspected.
Cytogenetic Analysis. This procedure will take the diagnosis forward in cases of leukemia and some lymphadenomas. The fresh material must be heparinized before shipment, preferably after discussion with a specialist laboratory.

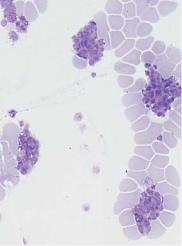
The bone marrow contains a mixture of all the hematopoietic cells
a 
 b
b
c
Fig. 18 Bone marrow cytology. a Bone marrow cytology of normal cell density in a young adult (smear from a bone marrow spicule shown at the lower right; magnification !100). b More adipocytes with large vacuoles are present in this bone marrow preparation with normal hematopoietic cell densities; usually found in older patients. c Normal bone marrow cytology (magnification !400). Even this overview shows clearly that erythropoiesis (dense, black, round nuclei) accounts for only about one-third of all the cells.
55

56 Normal Cells of the Blood and Hematopoietic Organs
Qualitative and Quantitative Assessment of the Remaining Cells. Lymphocyte counts may be slightly raised in reactive processes, but a significant increase suggests a disease of the lymphatic system. The exact classification of these disease follows the criteria of lymphocyte morphology (Fig. 16). If elevated lymphocyte counts are found only in one preparation or within a circumscribed area, physiological lymph follicles in the bone marrow are likely to be the source. In a borderline case, the histology and analysis of lymphocyte surface markers yield more definitive data.
Plasma cell counts are also slightly elevated in reactive processes and very elevated in plasmacytoma. Reactive increase of lymphocytes and plasma cells with concomitant low counts in the other series is often an indication of panmyelopathy (aplastic anemia).
Raised eosinophil and monocyte counts in bone marrow have the same diagnostic significance as in blood (p. 44).
Megakaryocyte counts are reduced under the effects of all toxic stimuli on bone marrow. Counts increase after bleeding, in essential thrombocytopenia (Werlhof syndrome), and in myeloproliferative diseases (chronic myeloid leukemia, polycythemia, and essential thrombocythemia).
Iron Staining of Erythropoietic Cells. Perls’ Prussian blue (also known as Perls’ acid ferrocyanide reaction) shows the presence of ferritin in 20–40% of all normoblasts, in the form of one to four small granules. The ironcontaining cells are called sideroblasts. Greater numbers of ferritin granules in normoblasts indicate a disorder of iron utilization (sideroachresia, especially in myelodysplasia), particularly when the granules form a ring around the nucleus (ring sideroblasts). Perls’ Prussian blue reaction also stains the diffuse iron precipitates in macrophages (Fig. 19 b).
Under exogenous iron deficiency conditions the proportion of sideroblasts and iron-storing macrophages is reduced. However, if the shift in iron utilization is due to infectious and/or toxic conditions, the iron content in normoblasts is reduced while the macrophages are loaded with iron to the point of saturation. In hemolytic conditions, the iron content of normoblasts is normal; it is elevated only in essential or symptomatic refractory anemia (including megaloblastic anemia).

Not just the individual cell, but its relative proportion is relevant in bone marrow diagnostics
a |
b |
c 
 d
d
Fig. 19 Normal bone marrow findings. a Normal bone marrow: megakaryocyte (1), erythroblasts (2), and myelocyte (3). b Iron staining in the bone marrow cytology: iron-storing macrophage. c Normal bone marrow with slight preponderance of granulocytopoiesis, e.g., promyelocyte (1), myelocyte (2), metamyelocyte (3), and band granulocyte (4). d Normal bone marrow with slight preponderance of erythropoiesis, e.g., basophilic erythroblast (1), polychromatic erythroblasts (2), and orthochromatic erythroblast (3). Compare (differential diagnosis) with the plasma cell (4) with its eccentric nucleus.
57