

MPS_Day1_World_Class_Reliability_Performance
.pdfPhone: +61 (0) 402 731 563
Fax: +61 (8) 9457 8642
Email: info@lifetime-reliability.com
Website: www.lifetime-reliability.com
Causes of Atomic and Microstructure Stress
61
Operating stresses work on the atomic and microstructure of a material. The loads and forces of operation are absorbed by the atoms and crystals of the material of construction. If the stresses in the atomic bonds are too great they break the bond. Where operating stresses are beyond the capacity of the material structure the structure fails. Once enough stress failures accumulate the part breaks and then a machine stops.
The materials of which parts are made do not know what causes them stress. They simply react to the stress experienced. If the stress is beyond their material capacity, they deform as the atomic structure collapses7. All materials of construction suffer structural damage at the atomic level when concentrated overload stress occurs. The greatest stress occurs when the load is localised to a very small area on a part. Once a failure site starts in the atomic matrix it progresses and grows larger whenever sufficient stress is present. The stress to propagate a failure is significantly less than the stress needed to generate the failure. Any load applied at a highly localised stress concentration point is multiplied by orders of magnitude8. Once the material of construction is damaged even normal operating loads maybe enough to extend the damage to the point of failure.
7Gordon, J. E., The New Science of Strong Materials or Why You Don‘t Fall Through the Floor, Penguin Books, Second Edition, 1976
8Juvinall, R. C., Engineering Considerations of Stress, Strain and Strength, McGraw-Hill, 1967
-71 -
Phone: +61 (0) 402 731 563
Fax: +61 (8) 9457 8642
Email: info@lifetime-reliability.com
Website: www.lifetime-reliability.com
Know the Limits of Your Parts
Failure
Failure
10,000 cycles |
1,000,000 |
Limited life |
Infinite cycles |
|
at this stress |
||||
at this stress |
cycles at this |
at this stress |
||
level for non- |
||||
level |
stress level |
level for steel |
||
ferrous |
||||
|
|
|
We must know what our equipment parts are made of and prevent high stress in those with infinite life but replace those of finite life before they fail.
62
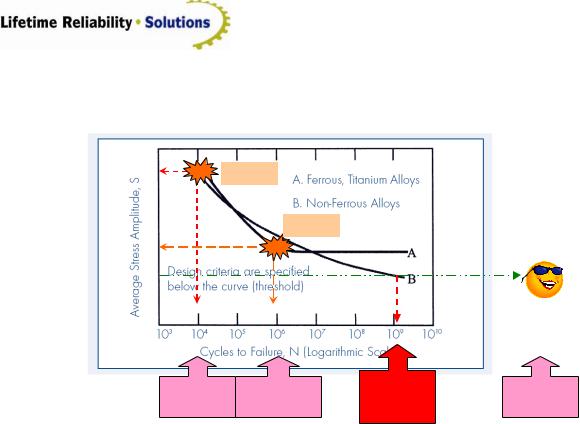
This graph is called a stress-life cycle curve. A great deal of fatigue load testing, where the load cycles in one direction and is then reversed, has been done with a wide range of metals. These tests produce graphs of tensile strength verses number of cycles to failure. From these tests graphs of tensile strength verses number of cycles to failure have been developed. An example of one for wrought (worked) steel commonly used in many industries is shown in the Figure. It helps us to understand how much load a material can repeatable take and still survive. Under loads at 90% its maximum yield strength it will last 10,000 cycles. Loads about 50% of maximum yield get 1,000,000 cycles before failure. But if loads are below half its yield strength, it has an indefinite life. Note that not all metals have a defined fatigue limit like steels. Some metals continue to degrade throughout use and parts made of such materials need replacement well before the part approaches fatigue failure. The replacement of parts before failure from operational age and use is known as preventive maintenance.
The vertical scale on this log-log plot shows the applied stresses as a proportion of the steel‘s ultimate tensile stress ‗Su‘ while the horizontal scale is the number of stress cycles to failure.
The left hand sloping line tells us is that a steel part put under high cyclic loads producing stresses in high proportion to its ultimate tensile stress will fail after a given number of cycles. Whereas the right hand side of the curve indicates that if cyclic stresses are maintained below a definable limit the part will have infinite life. The curve also tells us that a steel part made of this metal will fail if it has just one load cycle with a stress greater than its ultimate tensile strength. (Like when a small bolt snaps-off if over-tightened) It will also fail in less than several thousand cycles if the imposed stresses are 90% or more of the tensile strength. But if the stresses are kept below half of the tensile strength it will never fatigue. As a rough guide, the fatigue limit is usually about 40% of the tensile strength. In principle, components designed so that the applied stresses do not exceed this level should not fail in service. Note that Curve B advises us that not all metals have a fatigue limit.
- 72 -
Phone: +61 (0) 402 731 563
Fax: +61 (8) 9457 8642
Email: info@lifetime-reliability.com
Website: www.lifetime-reliability.com
Have you ever bent a metal wire back and forth until it breaks from being worked? If you have then you were performing a stress life-cycle test. The wire does not last long when bent severely one way and then back the other way. Each bend is an overstress, and eventually the overstress damage accumulates and the wire fatigues and fails.
Owing to the statistical nature of the failure, several specimens have to be tested at each stress level. Some materials, notably low-carbon steels, exhibit a flattening off at a particular stress level as at (A) in the figure which is referred to as the fatigue limit. The difficulty is a localised stress concentration may be present or introduced during service which leads to initiation, despite the design stress being normally below the 'safe' limit. Most materials, however, exhibit a continually falling curve as at (B) and the usual indicator of fatigue strength is to quote the stress below which failure will not be expected in less than a given number of cycles which is referred to as the endurance limit.
Although fatigue data may be determined for different materials it is the shape of a component and the level of applied stress which dictate whether a fatigue failure is to be expected under particular service conditions. Surface condition is also important to prevent crack initiation. Often complete components or assemblies, e.g. railway bogie frames or aircraft fuselage, will be tested by subjecting them to an accelerated loading spectrum reproducing what they are likely to experience over their entire service lifetime.
Operating Stresses Cause Failure
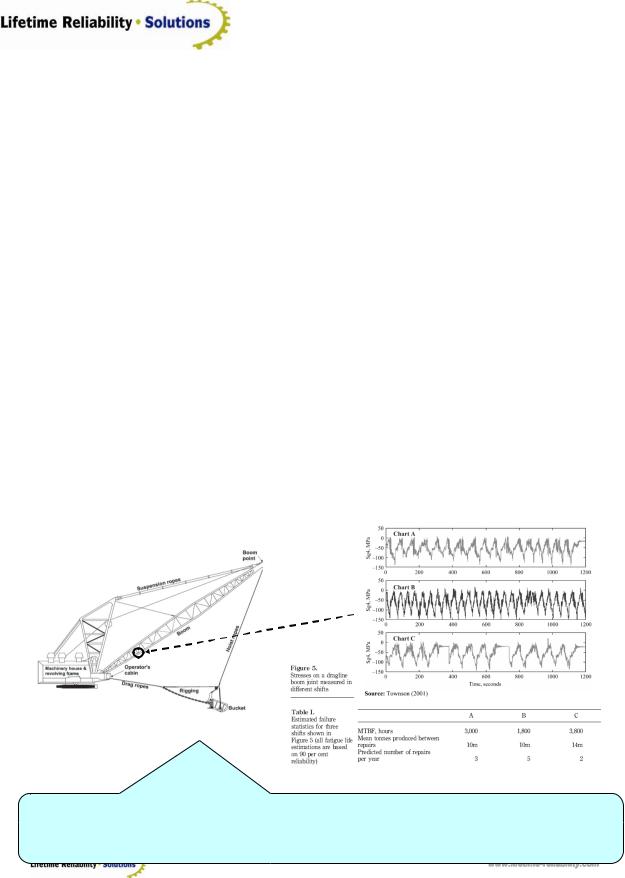
Extract from ‘Mobile Plant Maintenance and the Duty Meter Concept’, Hal Gurgenci, Zhihqiang Guan, Journal of Quality in Maintenance Engineering, Vol 7, No4, 2001.
Walking Dragline
Production |
30m |
50m |
28m |
Tip: Because each operator handles the dragline differently, at their own work rate, there are varying stresses placed on it. The cumulative wear on the machine is not consistent hour after hour, so using an hour-based preventive maintenance period is inappropriate; you may be maintaining too early, or too late. The right way is to also count the stress peaks and estimate how much life each one destroys and add that to the usage meter.
The diagram shows how three different operating methods stress a dragline boom. The way a machine is used affects its rate of failure. The Table provides a measure of the operating impact of each practice. Method B causes a lot of damage – the loads are higher and the fatigue from stress cycling accumulates faster. Method A is slower and method C is most gentle. ‗B‘ has an expected 5 failures a year and ‗C‘ only 2 a year. But which operating practice is best for the business?
- 73 -
Phone: +61 (0) 402 731 563
Fax: +61 (8) 9457 8642
Email: info@lifetime-reliability.com
Website: www.lifetime-reliability.com
To make the necessary assessment, we need to know the DAFT Costs for each option. Then we can see if the extra throughput from ‗B‘ actually produces a lower unit cost product. If it does, then ‗B‘ should become the standard way to operate. But if it does not, then Method B must be abandoned.
Recall that the unit cost equation is,
Unit Cost = Total Cost of Production ÷ Total Throughput.
If the DAFT Costs of the extra 3 failures from using Method B, cost more than the extra 22 million units produced from Method C, the company will be losing money. Until we can do an economic model of the different ways to operate the equipment it is not possible to say which of Methods A, B or C is the best one to use for the business.
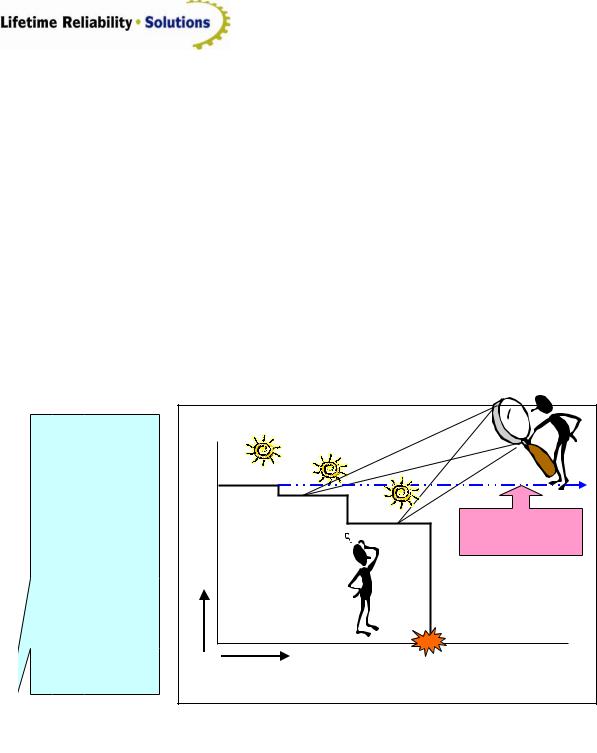
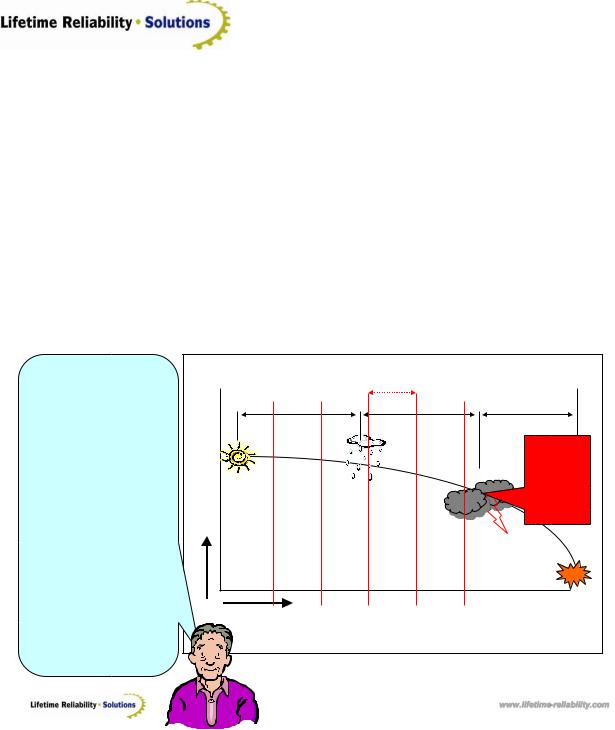
The Overload Cycle is Optional
Many parts fail without exhibiting warning signs of a coming failure – they show no evidence of degradation; there is just sudden catastrophic failure. In such cases the parts were too weak for the loads they had to take. In virtually every case those loads are imposed by human error.
Performance |
Smooth Running |
|
|
|
|
Smooth Running |
|
|
|
An |
|
|
|
|
Overload |
Another |
Smooth Running |
|
|
|
Potential operating |
|||
|
Overload |
|
||
|
|
|
life lost; now |
|
Operating |
|
|
The „Death‟ |
|
|
|
Overload |
curtailed and wasted |
|
|
|
|
|
|
|
|
|
Failed!? |
|
|
|
Time (Depending on the |
|
|
|
|
situation this can be at anytime.) |
|
|
|
The Stress-Driven Failure Degradation Sequence |
|||
|
|
|
|
64 |
We know that parts fail from being overstressed. This overstress is imposed on the part. Each overstress takes away a portion of the part‘s strength. When enough overstress accumulates, or there is one large overload incident, the part suddenly fails. To overload a part is a choice that eventually leads to failure. Overloading is a mistake that robs our machines of a long, troublefree service life.
- 74 -
Phone: +61 (0) 402 731 563
Fax: +61 (8) 9457 8642
Email: info@lifetime-reliability.com
Website: www.lifetime-reliability.com
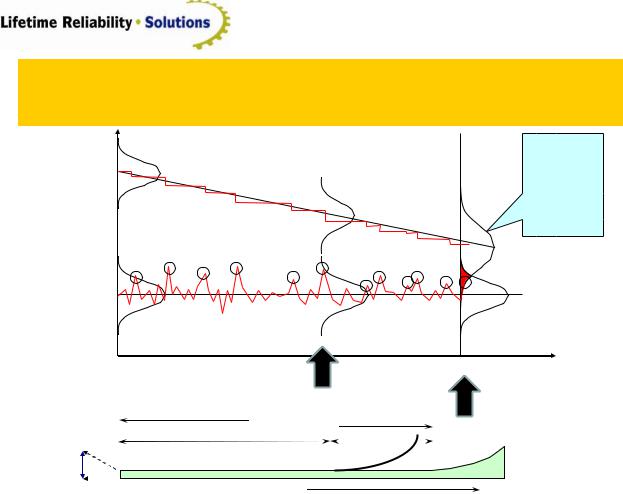
Cause of Aging Failures
Time Dependent Load and Strength Variation
Strength
The strength distribution widens and falls over time.
An |
Another |
The „Death‟ |
|
Overload |
Overload |
||
Overload |
|||
|
|
Load
Likelihood of  failure is higher
in this region
Equipment replaced here – Few Problems! |
|
Time/Load Cycles |
|
|
|
|
Log Scale |
|
Equipment replaced here – Lots of Problems! |
||
|
|
||
|
|
|
|
|
|
Estimated Life |
|
|
|
Wear-out |
|
|
|
|
|
||||
|
|
|
|
|
|
|
|
|
|
Probable Life |
|
|
Uncertainty |
|
|
|
|
|
|
|
|||
|
|
|
|
|
Zone |
||
Rate that |
|
|
|
|
|
|
|
|
|
|
|
|
|
|
|
parts fail |
|
Time |
|
|
|
65 |
|
|
|
|
|
|
|||
The stresses that parts experience result from their situation and circumstances. Overstress or fatigue a part and you damage it. The damage stays in the part, continually weakening it. Where local operating conditions attacks the part, for example from corrosion or erosion, the two factors
– overload and weakening – act together to compound the rate of failure.
Overstressed parts fail. The imposed overstress comes from external incidents where an action is done to overload a parts microstructure. Each overstress takes away a portion of the part‘s strength. When enough overstress accumulates (fatigue), or there is one large load incident (overload), the part suddenly fails.
Excessive stresses lower the capacity of materials of construction to accommodate future overloads. A portion of the material strength is lost with each high stress incident until a last high stress incident occurs which finally fails the part. These excessive stresses are not necessarily the fault of poor operating practices. In fact they are unlikely to only be due to operator abuse. They are more likely to be due to the acceptance of bad engineering and maintenance quality standards that increase the probability of failure in stressful situations.
Wear-out failures are any failure mechanism that result from parts weakening with age and usage. Included are processes involving material fatigue, wearing between surfaces/substances in contact, corrosion, degrading insulation, and wear-out in light bulbs and fluorescent tubes. Initially the strength is adequate for the applied load, but over time the strength deceases. In every case the average strength value falls and the spread of strength distribution widens. This makes it very difficult to provide accurate predictions of operating life for such items.
The Figure highlights the failure prediction dilemma–the timing and severity of overload incidents is unknowable. They may happen and they may not happen. It seems a matter of luck and chance whether parts are exposed to high risk situations that could cause them to fail. When
- 75 -
Phone: +61 (0) 402 731 563
Fax: +61 (8) 9457 8642
Email: info@lifetime-reliability.com
Website: www.lifetime-reliability.com
they are overstressed the materials of construction degrade and fatigue. Eventually an incident occurs that makes the item break.
Nothing lasts forever. In time all parts will need to be replaced or a new machine purchased. Preventive Maintenance is done to replace parts before they fail from usage or age. Maintainers try to estimate the safe period before failure and renew parts before the risk gets too high. Overhauls are undertaken to replace aged parts. Eventually the overhauls do not regain much more working life and the entire asset needs to be renewed with a complete replacement.
It is important that companies put money into their capital budgets to buy new assets to replace those that are too tired and fatigues from fair wear and use or damaged and destroyed before their full term from abuse.
Degradation Cycle of Machines and Parts
Most parts show evidence, or exhibit warning signs, of failing. They follow a sequence of gradual degradation. As they degrade their condition changes. These changed conditions can be observed and the parts replaced before they fail. Some items, like electronic parts, can fail without warning. Situations of huge, sudden stress or overload can cause parts to immediately fail.
|
Condition Inspection Interval |
Do Maintenance & |
Equipment Unusable |
Condition Monitor |
Repair or Replace |
Performance |
|
P |
P-F Interval |
|
|
|
|
||
|
|
|
|
|
|
|
|
|
Replace |
|
|
|
F |
before |
|
|
|
parts‟ |
|
|
|
|
|
|
Operating |
Smooth |
|
|
condition |
Running |
Change in |
|
gets to |
|
|
|
|||
|
|
Performance is |
|
functional |
|
|
Detectable |
|
|
|
|
|
failure point |
|
|
|
|
|
|
|
|
|
Impending |
|
|
|
|
Functional Failure |
|
|
|
|
|
Failed |
Time (Depending on the situation this can be from hours to months.)
The Failure Degradation Sequence
www.lifetime-reliability.com
66
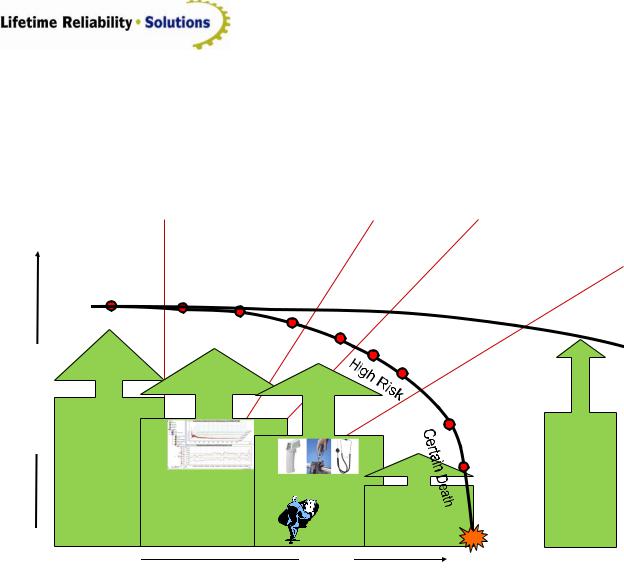
The degradation cycle shows the failure sequence for parts. Under abnormal operation equipment parts can start to fail. They go through the recognisable stages of degradation shown in the Figure. This degradation cycle is the basis of condition monitoring, which is also known as Predictive Maintenance. The degradation curve is useful in explaining why and when to use condition monitoring. Knowing that many mechanical parts show evidence of developing failure it is sensible to inspect them at regular time intervals for signs of approaching failure. Once you select an appropriate technology that detects and measures the degradation, the part‘s condition can be trended and the impending failure monitored until it is time to make a repair.
The point at which degradation is first possible to detect is known as the potential failure, ‗P‘, point. The point at which failure has progressed beyond salvage is the functional failure, ‗F‘ point. At this stage the equipment cannot perform its duty, though it may still be operating. We must condition monitor frequently enough to detect the onset of failure (the ‗P‘ point) so we have time to address the functional failure before it happens.
- 76 -
Phone: +61 (0) 402 731 563
Fax: +61 (8) 9457 8642
Email: info@lifetime-reliability.com
Website: www.lifetime-reliability.com
Some parts fail without exhibiting warning signs of a coming disaster. They show no evidence of degradation, there is just sudden catastrophic failure. In such cases, all we see is the sudden death of the part. This commonly happens to electronic parts. It is worth noting that almost all failures, even to electrical and electronic parts, are ultimately mechanical, contaminant or overtemperature related. Largely we can prevent those situations.
Roller Bearing Defect Severity
Part Condition
|
|
Stage 1. |
|
|
|
|
|
Approx 10% to 20% |
Stage 2. |
|
|
|
|
remaining life |
|
5% to 10% |
Stage 3. |
|
Ultrasonic |
|
|
remaining life |
|
Failure |
|
|
1% to 5% |
||
Energy |
Vibration Analysis |
Oil Analysis |
|
||
Induced |
|
of remaining life |
|||
Detected |
Fault Detection |
Detected |
|
||
|
|
|
|||
|
|
|
|
||
P |
Low Risk |
Temperature Rise |
|
|
|
|
|
|
F |
Audible Noise |
Stage 4. |
|
|
To Hot to Touch |
|
|
|
Remaining life |
|
|
|
|
|
|
|
|
one hour to 1% |
|
|
Mechanically |
|
|
|
Loose |
|
|
|
|
Ancillary |
|
|
|
Damage |
PREVENTIVE |
|
|
PRECISION |
|
PREDICTIVE |
|
|
|
OPERATOR CARE |
|
|
|
|
RUN TO FAILURE |
Catastrophic |
|
|
|
|
|
|
|
Failure |
|
Time |
|
|
Source: Ricky Smith, Allied Reliability, 2009 |
|
|
|
Machinery Lubrication Article (5/2007) |
|
67 |
|
|
|
|
|
An example of using the degrading curve is when monitoring the remaining life of roller bearings. There are defined zones of health as the bearing degrades.
Stage 1. Earliest detectable indication of bearing failure using vibration analysis. Signals appear in the ultrasonic frequency bands around 250 KHz to 350 KHz. At this point, there is approximately 10 to 20 percent remaining bearing life.
Stage 2. Bearing failure begins to "ring" at its natural frequency, (500 to 2,000 Hz) signal appears at the first harmonic bearing frequency. Five to 10 percent remaining bearing life.
Stage 3. Bearing failure harmonics of the fundamental frequency are now apparent. Defects in the inner and outer race are now apparent and visible on vibration analysis of the noise signal. Temperature increase is now apparent. One to five percent of remaining bearing life.
Stage 4. Bearing failure is indicated by high vibration. The fundamental and harmonics begin to actually decrease, random ultrasonic noise greatly increases, temperatures increase quickly. Remaining life one hour to one percent.
The problem with condition monitoring is that we have not actually stopped the cause of the failure. We simply detect an imminent failure before it happens and turn a breakdown into a planned maintenance job. As good as that is in reducing production costs and downtime, the failure causes remain and the failure will recur.
- 77 -
Phone: +61 (0) 402 731 563
Fax: +61 (8) 9457 8642
Email: info@lifetime-reliability.com
Website: www.lifetime-reliability.com
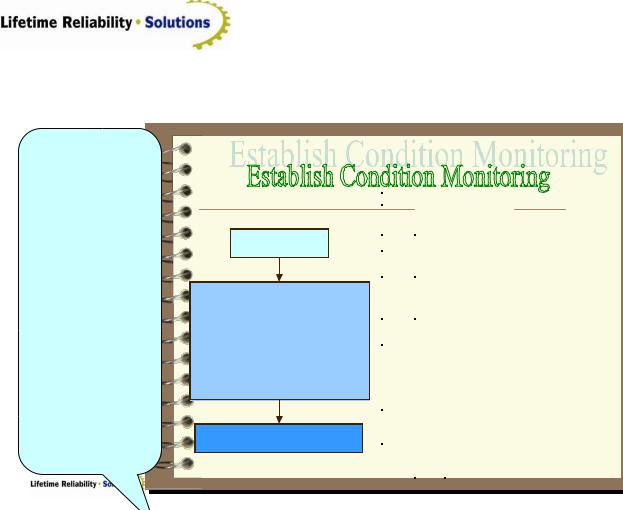
Establish Equipment Condition Monitoring
Since we can see the condition of our parts degrading, we only need to monitor for the evidence that things are deteriorating. Once the condition has got close to the functional failure point on the degradation curve it must be changed. Usually the job can be planned and prepared ahead of time so that the work can be done during a planned production outage.
AIM
•Early detection of abnormalities, prevention of grave failure.
•Prediction of life, decision on renewing time
•Securing the reliability, reduction of maintenance working time, rationalise maintenance costs.
Present condition
Kind |
Position |
Diagnostic Method |
Purpose |
Object |
|
Rotating |
|
|
Early detection of |
|
|
Bearing |
Vibration measurement |
Level of |
|
||
Machinery |
abnormalities by |
|
|||
|
|
importance. |
|
||
|
|
|
controlling the |
|
|
|
|
|
SABC rank. |
|
|
|
|
|
trend. |
|
|
|
|
|
|
|
|
|
Stator |
Insulation diagnosis |
Detection of |
High voltage |
|
|
Coil |
|
repair time. |
MO |
|
Heat |
Tube |
Eddy current |
Prevention of |
SUS heat |
|
Exchanger |
|
||||
(SUS, |
|
trouble by |
exchanger |
|
|
|
|
|
|||
|
CU) |
|
detecting faults. |
|
|
|
Tube |
Wall thickness |
Estimate of |
Steel pipe heat |
|
|
(CS) |
measurement and |
residual life. |
exchanger |
|
|
|
extreme-value analysis |
Decision of |
|
|
|
|
using the ultrasonic |
renewal time. |
|
|
|
|
immersion test method |
|
|
|
|
Tube |
Colour check (Dye |
Prevention of |
Each time |
|
|
Sheet |
Penetrant) |
trouble by |
|
|
|
|
|
detecting faults. |
|
|
Static |
Main |
Wall thickness |
Early detection of |
Legal |
|
Equipment |
|
||||
body, |
measurement, |
troubles by |
inspection |
|
|
|
Nozzle |
PT, MT, UT, RT, |
controlling the |
Each time |
|
|
|
trend. Decision of |
|
||
|
|
|
|
|
|
|
|
GL pinhole inspection |
repair time. |
Each time |
|
|
|
|
Detecting faults. |
|
|
|
|
|
Prevention of |
|
|
|
|
|
trouble, etc. |
|
|
Piping |
Main |
Wall thickness |
Early detection of |
Legal |
|
|
|
||||
|
body, |
measurement |
troubles by |
inspection |
|
|
Nozzle |
|
controlling the |
|
|
|
|
|
trend. |
|
|
Cables |
Insulation |
Insulation measurement |
Early detection of |
High voltage |
|
|
|
||||
|
|
Hot line diagnosis |
troubles by |
cable |
|
|
|
controlling the |
|
|
|
|
|
|
|
|
|
|
|
|
trend. |
|
|
www.lifetime-reliability.com
68
Condition monitoring can detect an impending failure. It spots tell-tale signs of degradation and warns when to do a repair. Instead of a breakdown from a failure, the equipment repair becomes a planned maintenance task. From being a breakdown, it becomes a shutdown. Planned maintenance allows maintenance work to be done cheaper than breakdown repair because the repair time is reduced through good preparation and the production stoppage is scheduled at a convenient time to minimise production impact.
As part of a condition monitoring strategy you will need to develop a table such as that in the Figure. This table identifies which machines will be condition monitored, with what techniques and for what purpose. The strategy then becomes part of your annual maintenance management plans and is funded from your annual maintenance budget.
Condition monitoring saves companies from breakdowns, but it does not stop failure initiation. With condition monitoring, organisations may not suffer an equipment breakdown, but they will still have to stop and do a repair. That work would not be necessary if they prevented failure initiating defects from starting.
- 78 -
Phone: +61 (0) 402 731 563
Fax: +61 (8) 9457 8642
Email: info@lifetime-reliability.com
Website: www.lifetime-reliability.com
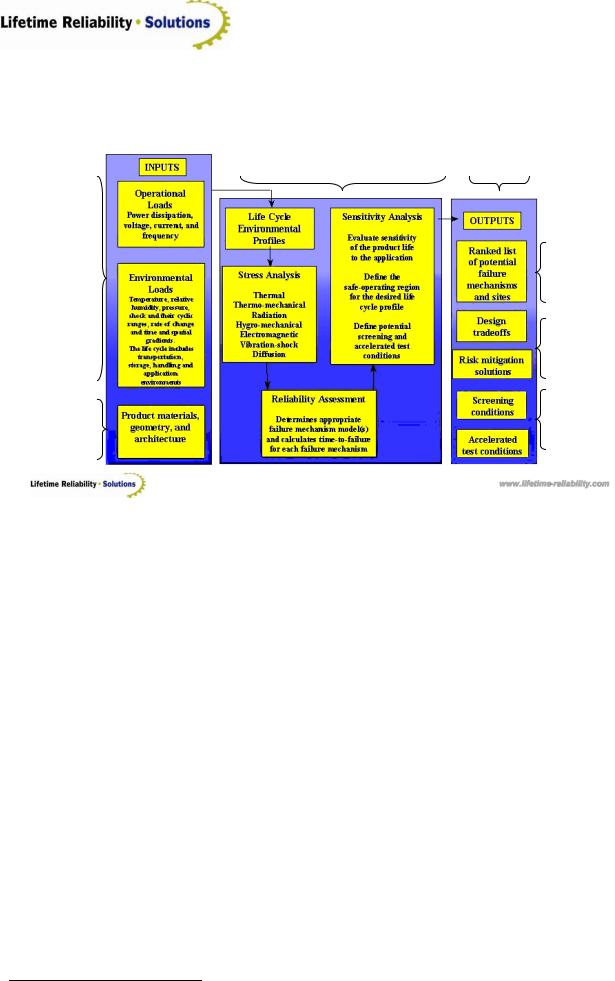
Building for the Physics of Failure
Environment
and
Operating
Stresses
Strength
Of the
Material
Design for Reliability and Low |
Operating Risk |
Operating/Maintenance Cost |
Management |
Failure
Mode
Effects
Criticality
Analysis
Life Cycle
Mgmt
Reliability
Engineering
www.lifetime-reliability.com
Source: Pecht, Michael., „Why the traditional reliability prediction models do not work - is there an alternative?‟, CALCE |
69 |
Electronic Product and Systems Center of the University of Maryland, College Park, MD, 20742, USA. |
|
The mechanisms of failure caused by stressing components has become known as the Physics of Failure (PoF).
It recognises the influences and effects of the Physics of Failure on parts9. The parts are modelled with Finite Element Analysis (or prototype tested in a laboratory), and their behaviours analysed under varying operating load conditions. The modelling identifies likely life cycle performance in those situations. The results warn of the design limit and operating envelope of the materials-of-construction. The tests indicate what loads equipment parts can take before failing. During operation we must ensure parts never get loaded and stressed to those levels, or that they are allowed to degrade to the point they cannot take the loads. It is the role of maintenance management and reliability engineering to ensure parts do not fail and machines do not stop.
We know the factors that cause our parts and equipment to fail – sudden excess stress and accumulated stress. During the design of plant and equipment we apply the knowledge of the Physics of Failure to select the right materials and designs that deliver affordable reliability during operating life. The design stress tolerances set the limit of a part‘s allowable distortion. To maximise reliability we first must keep the parts in good condition to take the service loads. Secondly we must ensure the equipment is operated so that loads are kept well within the design envelope. If the loads applied to a part deforms it so far that it forces the atomic structure to collapse, there will be a failure. It may be immediate if it is an overload, or it will be eventually if it is fatigue. If you want highly reliable equipment don‘t let your machine‘s parts get tired, or twisted out-of-shape.
9 Pecht, Michael., ‗Why the traditional reliability prediction models do not work - is there an alternative?‘, CALCE Electronic Product and Systems Center of the University of Maryland, College Park, MD, 20742, USA.
- 79 -

Phone: +61 (0) 402 731 563
Fax: +61 (8) 9457 8642
Email: info@lifetime-reliability.com
Website: www.lifetime-reliability.com
Failure Mode and Effects Analysis
Definitions
•A failure is any unwanted or disappointing behaviour of a product.
•A failure mode is the effect by which a failure is observed. Failure modes can be electrical (open or short circuit, stuck at high), physical (loss of speed, excessive noise), or functional (loss of power gain, communication loss, high error level).
•Failure mechanism refers to the processes by which the failure modes are induced. It includes physical, mechanical, electrical, chemical, or other processes and their combinations. Knowledge of failure mechanism provides insight into the conditions that precipitate failures.
•A failure site describes the physical location where the failure mechanism is observed to occur, and is often the location of the highest stresses and lowest strengths.
We can foretell what parts are going to cause trouble by doing experiments, from conducting tests and by using past failure history of similar parts. If we can predict what will go wrong, and the conditions that will cause it to happen, we can design maintenance and operational loading strategies to give maximum part life.
FMEA is both a qualitative and quantitative technique to identify how equipment can fail in order to design-out a failure, or to identify and apply suitable maintenance practices to correct a developing problem before it leads to a failure.
This is a methodology for analysing potential reliability problems early in the development cycle where it is easier to take actions to overcome these issues, thereby enhancing reliability through design. FMEA identifies potential failure modes, determine their effect on the operation of the plant, and identify actions to mitigate the failures. A crucial step is anticipating what might go wrong with a process. While anticipating every failure mode is not possible, the development team should formulate as extensive a list of potential failure modes as possible.
The early and consistent use of FMEAs in the design process allows the design-out of failures and production of reliable, safe, and easily operable plant and equipment. FMEAs also capture historical information for use in future improvements. Initially a high-level Failure Mode and Effect Analysis (FMEA) is conducted at the equipment and assembly level using the production process maps.
A small team of people knowledgeable in the design, use and maintenance of the equipment assemble together to work through the maps, asking what causes each operating equipment item to fail, including identifying failures from possible combined causes. The size and composition of the team is not critical as long as it contains the necessary design, operation and maintenance knowledge and expertise covering the equipment being reviewed. Ideally, Operations and Maintenance shopfloor level supervisors are in the review team so they understand the purpose of the review, and can later support the efforts needed to instigate and perform the risk control activities that will arise.
- 80 -